. 2021 May 5;23(5):743-756.
doi: 10.1093/neuonc/noaa279.

Rolling-translated EGFR variants sustain EGFR signaling and promote glioblastoma tumorigenicity

Affiliations

Rolling-translated EGFR variants sustain EGFR signaling and promote glioblastoma tumorigenicity

Yi Liu et al. Neuro Oncol. .

Abstract

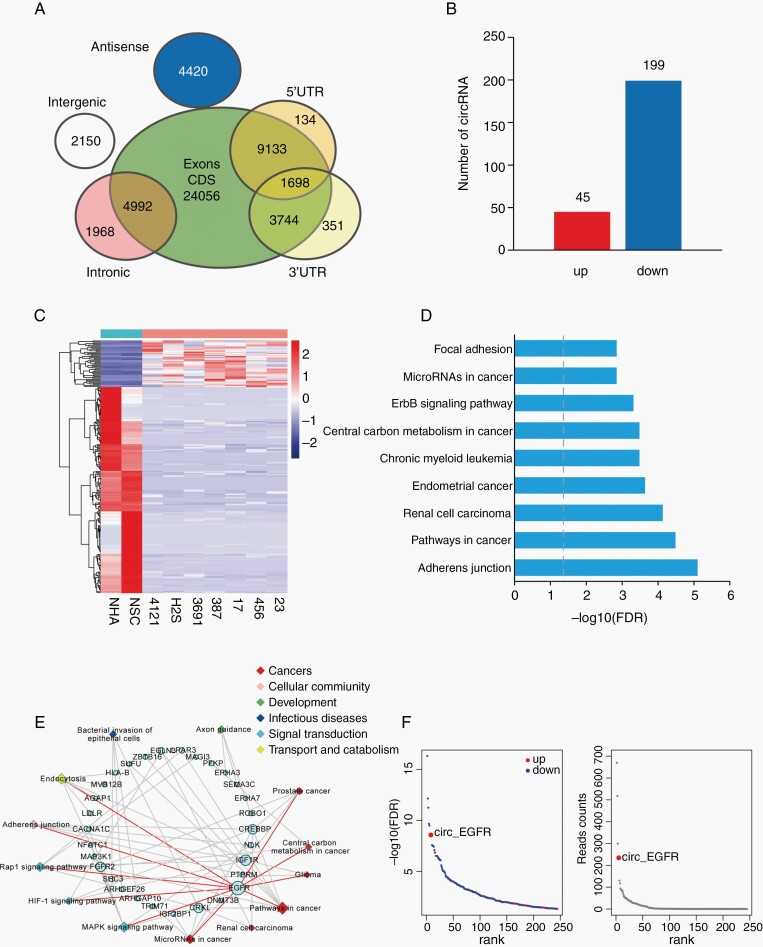
Background: Aberrant epidermal growth factor receptor (EGFR) activation is observed in over 50% of cases of adult glioblastoma (GBM). Nevertheless, EGFR antibodies are ineffective in clinical GBM treatment, suggesting the existence of redundant EGFR activation mechanisms. Whether circular RNA (circRNA) encodes a protein involved in EGFR-driven GBM remains unclear. We reported an unexpected mechanism in which circular EGFR RNA (circ-EGFR) encodes a novel EGFR variant to sustained EGFR activation.

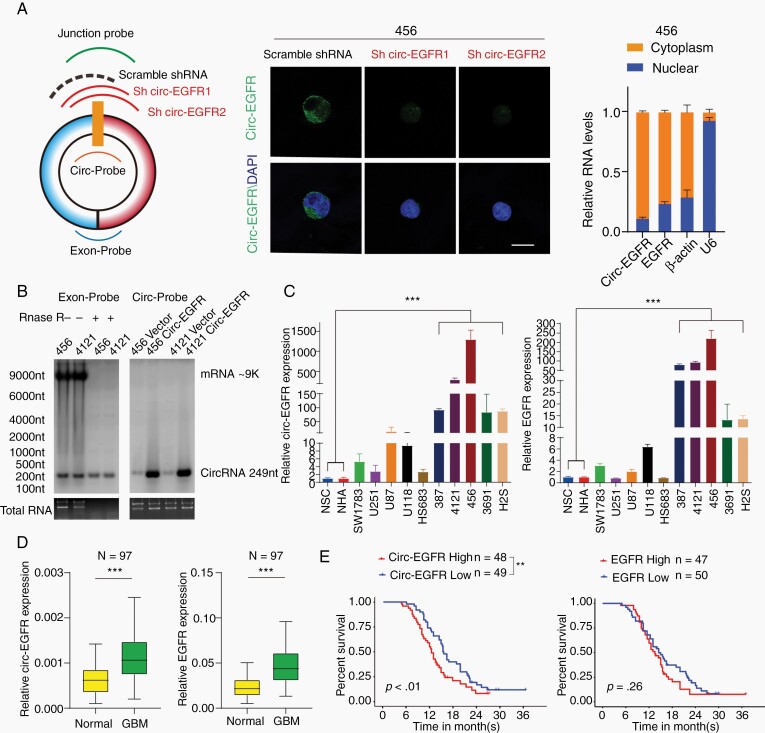
Method: We used RNA-seq, Northern blot, and Sanger sequencing to confirm the existence of circ-EGFR. Antibodies and a liquid chromatograph tandem mass spectrometer were used to identify circ-EGFR protein products. Lentivirus-transfected stable cell lines were used to assess the biological functions of the novel protein in vitro and in vivo. Clinical implications of circ-EGFR were assessed using 97 pathologically diagnosed GBM patient samples.

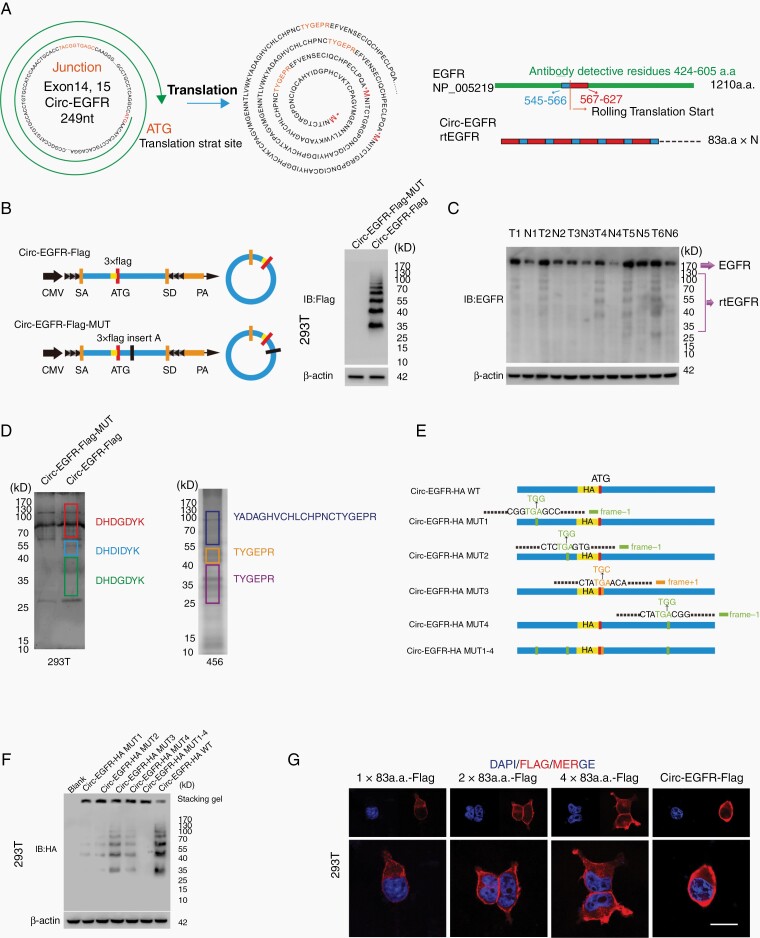
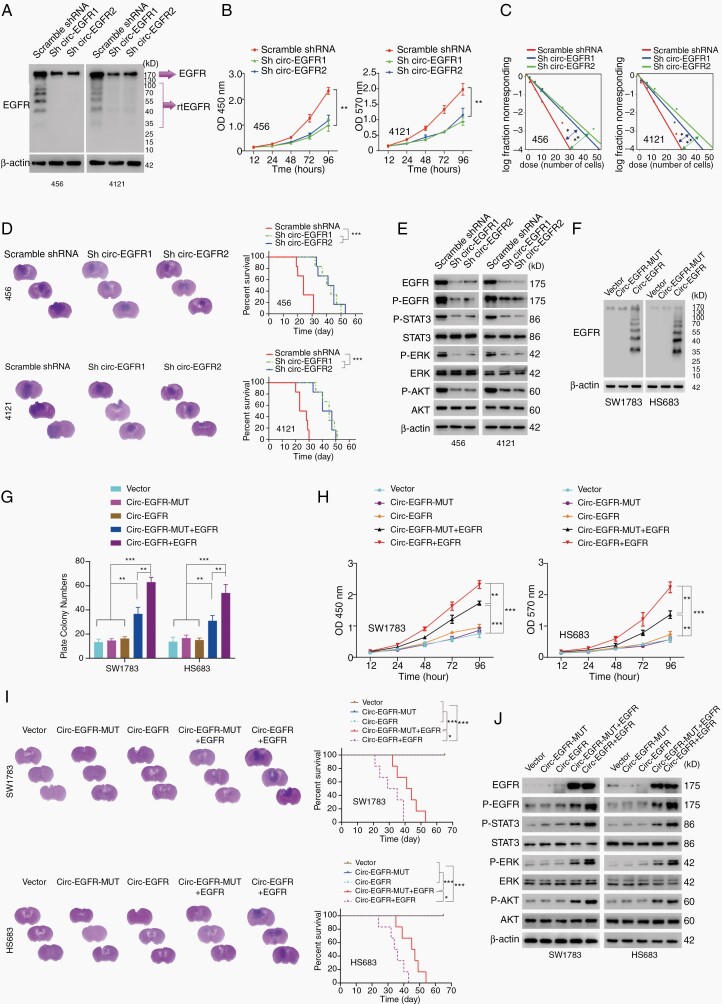
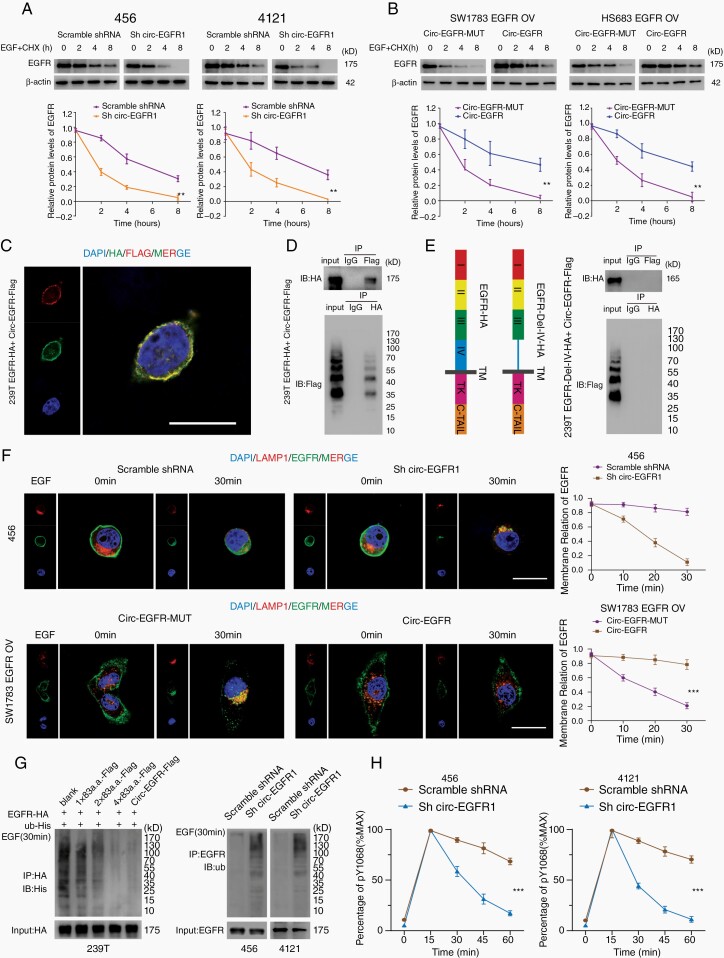
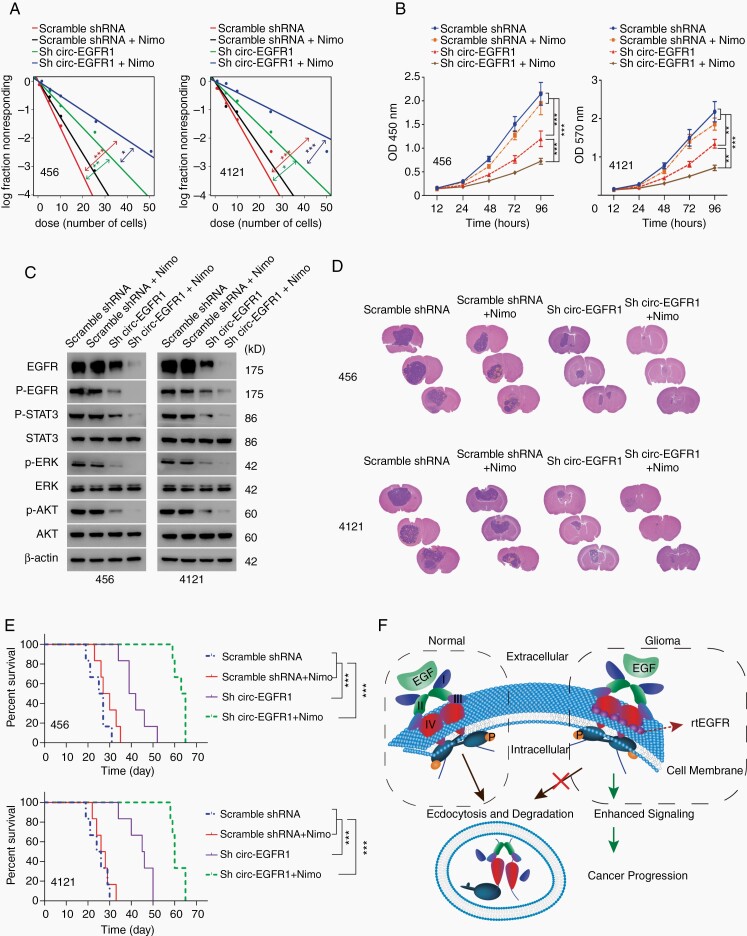
Results: The infinite open reading frame (iORF) in circ-EGFR translated repeating amino acid sequences via rolling translation and programmed -1 ribosomal frameshifting (-1PRF) induced out-of-frame stop codon (OSC), forming a polymetric novel protein-complex, which we termed rolling-translated EGFR (rtEGFR). rtEGFR directly interacted with EGFR, maintained EGFR membrane localization and attenuated EGFR endocytosis and degradation. Importantly, circ-EGFR levels correlated with the EGFR signature and predicted the poor prognosis of GBM patients. Deprivation of rtEGFR in brain tumor-initiating cells (BTICs) attenuated tumorigenicity and enhanced the anti-GBM effect.

Conclusion: Our findings identified the endogenous rolling-translated protein and provided strong clinical evidence that targeting rtEGFR could improve the efficiency of EGFR-targeting therapies in GBM.

Keywords: CircRNA; EGFR; glioblastoma; iORF; rolling translation.


Figures

Fig. 1
Fig. 1
Profiling of circular RNAs in brain tumor-initiating cells (BTICs), neuro stem cells (NSCs), and NHAs. (A). Venn plot showing the number of all circRNAs derived from different genomic regions. (B). The numbers of differentially expressed circRNAs (DEcRs) with false discovery rate (FDR) < .05 and fold change > 2 between cancerous and normal cells. (C). Heat map of all DEcRs. (D). The top 9 enrichment scores by Kyoto Encyclopedia of Genes and Genomes (KEGG) pathway analysis among DEcRs derived host genes. X axis: enriched pathways, Y axis: −log10 FDR. (E). The network of 13 enriched pathways and host genes of DEcRs. Circular nodes represent host genes; rhombic nodes represent pathways. The size denotes the number of genes or pathways related to the nodes. (F). Left, −log10 FDR of DEcRs. The blue and red points represented downregulated and upregulated circRNAs. X axis: DEcRs, Y axis: −log10 FDR. Right, Reads count of DEcRs. X axis: DEcRs, Y axis: read counts.
Fig. 2
Fig. 2
Characterization of circ-EGFR in glioblastoma (GBM). (A). Left, circ-EGFR junction probe, 2 junction shRNAs and a scramble shRNA. Middle, fluorescence in situ hybridization (FISH) with junction probes was used to decide the subcellular localization of circ-EGFR in 456 brain tumor-initiating cells (BTICs). circ-EGFR shRNA1 and circ-EGFR shRNA2 were used to show the specificity. Scale bars, 20 μM. Right, cytoplasmic and nuclear fractions were isolated to determine circ-EGFR and linear EGFR. β-actin and U6 were used as cytoplasmic or nuclear markers. (B). Left, detection of linear EGFR mRNA and circ-EGFR with exon probe plus RNAse R treatment. Right, detection of circ-EGFR with junction probe. (C). Relative circ-EGFR (left) and linear EGFR (right) mRNA levels in indicated cell lines. (D). Relative circ-EGFR and linear EGFR mRNA levels of GBM and paired adjacent normal tissues in a cohort of 97 GBM patients. (E). Left, 97 patients in the cohort were divided into 2 groups according to relative circ-EGFR expression. The overall survival time of each group was calculated, Right, GBM patient overall survival based on linear EGFR mRNA expression in above cohort. Lines show the mean ± SD. *P < .05, **P < .01, ***P < .001. Data are representative of 2–3 experiments with similar results.
Fig. 3
Fig. 3
Circ-EGFR encoded rolling-translated EGFR (rtEGFR). (A). Upper, the putative iORF in circ-EGFR and the sequences. Lower, illustration of EGFR sequence and rtEGFR sequence. The antibody used in the study recognized 424–605 a.a. of EFGR. (B). Left, illustration of Circ-EGFR-Flag and Circ-EGFR-Flag-MUT. Right, rtEGFR expression was confirmed by immunoblotting (IB) using Flag antibody in Circ-EGFR-Flag and Circ-EGFR-Flag-MUT transfected 293T. (C). Endogenous rtEFGR expression was detected in paired glioblastoma (GBM) samples by using EGFR antibody. (D). Left, the differential gel bands 30–40 kD, 40–55 kD, and 70–170 kD from Circ-EGFR-Flag and Circ-EGFR-Flag-MUT transfected 293T cells were cut and subjected to LC–MS/MS separately. The identified 3xFlag sequences are shown. Right, the differential gel bands 30–40 kD, 40–55 kD, and 70–170 kD from 456 cells were cut and subjected to LC–MS/MS separately. rtEGFR junction-specific peptides are shown. (E). Illustration of circ-EGFR-HA-WT, circ-EGFR-HA-MUT1, circ-EGFR-HA-MUT2, circ-EGFR-HA-MUT3, circ-EGFR-HA-MUT4, and circ-EGFR-HA-MUT1-4 plasmids. Out of frame stop codons (OSC) are shown (green for −1 frame, orange for +1 frame). (F). Total protein from circ-EGFR-HA-WT, circ-EGFR-HA-MUT1, circ-EGFR-HA-MUT2, circ-EGFR-HA-MUT3, circ-EGFR-HA-MUT4 and circ-EGFR-HA-MUT1-4, circ-EGFR-HA-WT transfected 293T cells was evaluated by immunoblotting using HA antibody. Stacking gel was preserved and transferred to detected extra-large proteins. (G). 293T cells were transfected with 1×83a.a.-Flag, 2×83a.a.-Flag, 4×83a.a.-Flag or Circ-EGFR-Flag. Immunofluorescence using anti-Flag was performed. Scale bars, 20 μM. Lines show the mean ± SD. ***P < .001. Data are representative of 2–3 experiments with similar results.
Fig. 4
Fig. 4
Biological functions of circ-EGFR in glioma cell lines. (A). 456 and 4121 brain tumor-initiating cells (BTICs) were transfected with circ-EGFR shRNA1, 2 or scramble shRNA. (B). Cell proliferation of indicated cells was determined by CCK8. (C) In vitro extreme limiting dilution assays (LDAs) in indicated cells. (D) 456 and 4121 BTICs with indicated modification were intracranially injected into nude mice (1 × 10⁵ cells, per mice, 6 mice per group). Representative HE staining of brain sections in each experimental group is shown. Survival analysis was calculated by Kaplan–Meier curve. (E). The expression of the downstream signaling pathway of EGFR was determined by IB in 456 and 4121 BTICs with indicated modifications. (F). SW1783 and Hs683 glioma cells were transfected with circ-EGFR-MUT, circ-EGFR, or empty vector. The rolling-translated EGFR (rtEGFR) expression was confirmed by immunoblotting. (G). Plate colony formation of vector, circ-EGFR-MUT, circ-EGFR, circ-EGFR-MUT+EGFR, and circ-EGFR+EGFR transfected SW1783 and Hs683. (H). Cell proliferation of vector, circ-EGFR-MUT, circ-EGFR, circ-EGFR-MUT+EGFR, and circ-EGFR+EGFR transfected SW1783 and Hs683. (I). SW1783 and Hs683 cells with vector, circ-EGFR-MUT, circ-EGFR, circ-EGFR-MUT+EGFR, and circ-EGFR+EGFR overexpression were intracranially injected into nude mice (1 × 10⁵ per mice, 6 mice per group). Representative HE staining of brain sections in each experimental group is shown. Survival analysis was calculated by Kaplan–Meier curve. (J) The expression of EGFR downstream signaling was determined by Western blotting in vector, circ-EGFR-MUT, circ-EGFR, circ-EGFR-MUT+EGFR, and circ-EGFR+EGFR transfected SW1783 and Hs683. Lines show the mean ± SD. *P < .05, **P < .01, ***P < .001. Data are representative of 2–3 experiments with similar results.
Fig. 5
Fig. 5
Rolling-translated EGFR (rtEGFR) sustained EGFR membrane localization and prevented EGFR degradation. (A). Upper panel, 456 and 4121 brain tumor-initiating cells (BTICs) with indicated modifications were treated with EGF and cycloheximide. Total lysates at the indicated time points were collected, and indicated proteins were evaluated by immunoblotting. Lower panel, semi-quantification of EGFR protein levels in above immunoblotting. (B). Upper panel, SW1783 and Hs683 glioma cells with indicated modifications were treated with EGF and cycloheximide. Total lysates at the indicated time points were collected, and indicated proteins were determined by immunoblotting. Lower panel, semi-quantification of EGFR protein levels in above immunoblotting. (C). EGFR-HA and circ-EGFR-Flag vector were transfected into 239T cells, and immunofluorescence was performed using anti-Flag and anti-HA antibodies. Scale bar, 20 μm. (D). Mutual interaction of EGFA-HA and circ-EGFR-Flag was determined by IP in 293T cells. (E). Left, illustration of EGFR-HA and EGFR-Del-IV-HA plasmids. Right panel, in vivo interaction of EGFR-HA and circEGFR-Flag was detected by IP in 293T cells. (F). Immunofluorescence using anti-EGFR (green) and anti-lamp1 (red) was performed to show EGFR cellular localization after EGF stimulation in 456 BTICs or SW1783 with indicated modifications. Scale bars, 20 μM. (G) Left, HA-tagged-EGFR and His-tagged-Ub were cotransfected with 1×83a.a.-flag, 2×83a.a.-flag, 4×83a.a.-flag or circ-EGFR-Flag in 293T cells. IP was performed, followed by IB using the indicated antibodies. Right, Ub levels were detected in 456 and 4121 BTICs with circ-EGFR knockdown and their control cells, followed by IP using the indicated antibodies. (H). Quantitation of EGFR phosphorylation time courses, normalized by signal at 15 min. Lines show the mean ± SD. *P < .05, **P < .01, ***P < .001. Data are representative of 2–3 experiments with similar results.
Fig. 6
Fig. 6
Circ-EGFR knockdown enhanced the therapeutic effect of nimotuzumab in glioblastoma (GBM). (A). Neurosphere-forming capability in indicated cells. (B). Cell proliferation of the indicated groups was determined by CCK8. (C). The expression of EGFR downstream signaling was determined in each group. (D). Representative HE staining in each experimental group are shown. (E). Survival analysis was conducted with the Kaplan–Meier curve in indicated groups. (F). Illustration of circ-EGFR function. Normally, after activation by EGF, the ubiquitylated EGFR was followed by endocytosis and degradation. In brain tumor cells where rolling-translated EGFR (rtEGFR) was abundantly expressed, rtEGFR formed a complex with EGFR and prevented its endocytosis. This disrupted the normal downregulation of the EGFR, extended it signaling lifespan and promoted tumorigenesis. Lines show the mean ± SD. *P < .05, **P < .01, ***P < .001. Data are representative of 2–3 experiments with similar results.

Comment in

  • You spin me right 'round.
    Hoogstrate Y, French PJ. Hoogstrate Y, et al. Neuro Oncol. 2021 May 5;23(5):707-708. doi: 10.1093/neuonc/noab032. Neuro Oncol. 2021. PMID: 33704479 Free PMC article. No abstract available.

References

    1. Hanahan D, Weinberg RA. Hallmarks of cancer: the next generation. Cell. 2011;144(5):646–674. - PubMed
    1. Furnari FB, Cloughesy TF, Cavenee WK, Mischel PS. Heterogeneity of epidermal growth factor receptor signalling networks in glioblastoma. Nat Rev Cancer. 2015;15(5):302–310. - PMC - PubMed
    1. Westphal M, Maire CL, Lamszus K. EGFR as a target for glioblastoma treatment: an unfulfilled promise. CNS Drugs. 2017;31(9): 723–735. - PMC - PubMed
    1. An Z, Aksoy O, Zheng T, Fan QW, Weiss WA. Epidermal growth factor receptor and EGFRvIII in glioblastoma: signaling pathways and targeted therapies. Oncogene. 2018;37(12):1561–1575. - PMC - PubMed
    1. Stasyk T, Huber LA. Spatio-temporal parameters of endosomal signaling in cancer: implications for new treatment options. J Cell Biochem. 2016;117(4):836–843. - PMC - PubMed

Publication types