. 2021 Mar 1;218(3):e20200547.
doi: 10.1084/jem.20200547.

CD4+ follicular regulatory T cells optimize the influenza virus-specific B cell response

Affiliations

CD4+ follicular regulatory T cells optimize the influenza virus-specific B cell response

Yisi Lu et al. J Exp Med. .

Abstract

CD4+ follicular regulatory T (Tfr) cells control B cell responses through the modulation of follicular helper T (Tfh) cells and germinal center development while suppressing autoreactivity; however, their role in the regulation of productive germinal center B cell responses and humoral memory is incompletely defined. We show that Tfr cells promote antigen-specific germinal center B cell responses upon influenza virus infection. Following viral challenge, we found that Tfr cells are necessary for robust generation of virus-specific, long-lived plasma cells, antibody production against both hemagglutinin (HA) and neuraminidase (NA), the two major influenza virus glycoproteins, and appropriate regulation of the BCR repertoire. To further investigate the functional relevance of Tfr cells during viral challenge, we used a sequential immunization model with repeated exposure of antigenically partially conserved strains of influenza viruses, revealing that Tfr cells promote recall antibody responses against the conserved HA stalk region. Thus, Tfr cells promote antigen-specific B cell responses and are essential for the development of long-term humoral memory.


Conflict of interest statement

Disclosures: K.C. O’Connor reported personal fees from Alexion and grants from Ra Pharma outside the submitted work; is the recipient of a sponsored research subaward from the University of Pennsylvania, the primary financial sponsor of which is Cabaletta Bio; and is a consultant and equity shareholder of Cabaletta Bio. No other disclosures were reported.

Figures

Figure S1.
Figure S1.
The kinetics of follicular regulatory CD4+ T cells, Tfh cells, GC B cells, and HA-specific GC B cells following influenza virus infection and characterization of Tfr cell–deficient animals. (A) Frequency and number of Tfr cells defined as CD4+CD44hiLy6CPSGL1lowCXCR5hiPD1hiFoxp3+. (B) Frequency and number of Tfh cells defined as CD4+CD44hiFoxp3Ly6CPSGL1lowCXCR5hiPD1hi. (C) Frequency and number of GC B cells defined as B220+IgDloGL7+CD38. (D) Frequency and number of HA-specific GC B cells defined as B220+IgMIgDloGL7+CD38HA+. (E) Bcl6f/f Foxp3-Cre mice have a lack of Tfr cells. Frequencies of Tfr cells at days 8 and 40 p.i. in Tfr cell–sufficient (Bcl6f/f) and Tfr cell–deficient (Bcl6f/f Foxp3-Cre) mice. (F) Analyses of the number of B cells, activated B cells, GC B cells, activated CD4+ T cells, Tfh cells, and Treg cells in the spleen of naive Bcl6f/f and Bcl6f/f Foxp3-Cre animals. Statistical analyses were performed using the unpaired two-tailed Student’s t test (****, P < 0.0001). Data for A–D are from one experiment representative of two experiments with three to six mice per time point after influenza virus infection. Data for E are from one experiment representative of three experiments with six to eight mice per group. Data for F are from one experiment representative of two experiments with three or four mice per group.
Figure 1.
Figure 1.
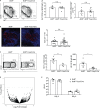
Mice lacking follicular regulatory CD4+ T cells have reduced antigen-specific GC responses. Analysis of the GC B cell responses in Bcl6f/f and Bcl6f/f Foxp3-Cre mice at the late time point following influenza virus infection. (A) Left: Representative plots of the GC B cell responses in Bcl6f/f or Bcl6f/f Foxp3-Cre mice at day 38 p.i. Right: Frequency and number of cells as indicated by the gates shown on the left. (B) Representative confocal images of the GCs from Bcl6f/f or Bcl6f/f Foxp3-Cre mice at day 36 p.i. IgD shown in blue and peanut agglutinin shown in red. Right: GC sizes as measured by ImageJ. Scale bar, 100 µm. (C) Left: Representative plots of HA-specific GC B cells at day 38 p.i. The cells were gated on GL7+ CD38 GC B cells of the B220+IgMIgDlow population. Right: Frequency and absolute numbers of HA-specific GC B cells. (D) RNA-seq analysis of HA+ GC B cells from Bcl6f/f and Bcl6f/f Foxp3-Cre mice at 36 d following influenza virus infection. Volcano plot of -log10 P value vs. log2 fold change of the most differentially expressed 5,000 genes. The dashed line plotted indicates the level of Bonferroni-corrected P value <0.05. No gene is found to show significance change with adjusted P value <0.05. (E) Plaque assay measuring viral load in Bcl6f/f and Bcl6f/f Foxp3-Cre mice at day 5 and day 9 p.i. Statistical analyses were performed using the unpaired two-tailed Student’s t test (*, P < 0.05; **, P < 0.01). Data for A and C are from one experiment representative of four experiments with five to seven mice per group. Data for B and E are from one experiment representative of two experiments with three to five mice per group. Data for D are from two independent experiments with three to four mice per group pooled for each sample. n.s., not significant.
Figure 2.
Figure 2.
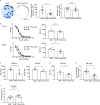
CD4+ Tfr cells are important for antigen-specific plasma cell and antibody responses following influenza virus infection. (A) Left: Representative image from ELISPOT of HA-specific IgG ASCs. Right: Quantification of HA+ ASCs and total bone marrow cells of Bcl6f/f or Bcl6f/f Foxp3-Cre mice at day 38 p.i. Scale bar, 3 mm. (B) ELISA analysis of serum influenza-specific antibody titers in Tfr cell–deficient (Bcl6f/f Foxp3-Cre) and wild-type (Bcl6f/f) mice at various time points following infection with PR8. At day 15 p.i. (top) and day 36 p.i. (bottom), HA-specific IgG in sera from two groups of mice were quantified by ELISA. (C) Representative plots of quantification of HA-specific IgG1 (left) and HA-specific IgG2a (right) from Bcl6f/f Foxp3-Cre and control mice. (D) Representative plot of NA-specific IgG. (E) Affinity measurements of Bcl6f/f or Bcl6f/f Foxp3-Cre mice at day 36 p.i. determined by 7 M urea ELISA, expressed as percentage of IgG bound to HA treated by 7 M urea divided by untreated IgG bound. (F) The concentration of total IgG in the sera from Tfr cell–deficient (Bcl6f/f Foxp3-Cre) and wild-type (Bcl6f/f) mice at day 36 p.i. Statistical analyses were performed using the unpaired two-tailed Student’s t test (*, P < 0.05; **, P < 0.01). Data for A are pooled from two experiments representative of four or five experiments with four to six mice per group performed day 38 p.i. with PR8. Data for B–D and F are from one experiment representative of three experiments with five to eight mice per group. Data for E are pooled from two independent experiments with four to six mice per group. AUC, area under the curve; BM, bone marrow; n.s., not significant.
Figure S2.
Figure S2.
Bcl6f/fFoxp3-Cre animals have reduced HA-specific GC B cells and antibody response compared with Foxp3-Cre littermate controls. (A) Analysis of the GC B cell responses in Foxp3-Cre and Bcl6f/f Foxp3-Cre mice at day 38 following influenza virus infection. Left: Representative plots of the HA+ GC B cell responses in Foxp3-Cre and Bcl6f/f Foxp3-Cre mice at day 38 p.i. Right: Frequency and number of cells as indicated by the gates shown on the left. (B) ELISA analysis of serum influenza-specific antibody titers in Bcl6f/f Foxp3-Cre and littermate wild-type Foxp3-Cre mice at day 38 p.i. Statistical analyses were performed using the unpaired two-tailed Student’s t test (*, P < 0.05; **, P < 0.01). Data are pooled from two independent experiments with four to six mice per group. AUC, area under the curve.
Figure S3.
Figure S3.
Tfr cell–deficient animals show weakly positive ANA staining following influenza virus infection. (A–D) Representative images of ANA staining from Bcl6f/f and Bcl6f/f Foxp3-Cre mice at 36 d following influenza virus infection, with a serum dilution of 1:20; positive control from a 6-mo MRL/lpr mouse, scale bar, 100 µm (A); naive 4-mo-old Bcl6f/f and Bcl6f/f Foxp3-Cre mice, with a serum dilution of 1:20 (B); Bcl6f/f and Bcl6f/f Foxp3-Cre mice at 36 d following influenza virus infection, with a serum dilution of 1:5 (C); naive 4-mo-old Bcl6f/f and Bcl6f/f Foxp3-Cre mice, with a serum dilution of 1:5 (D). (E) Blinded scoring of ANA staining for Bcl6f/f and Bcl6f/f Foxp3-Cre mice at 36 d following influenza virus infection. Negative control is serum from a naive 6-wk-old B6 animal, and positive control serum is from a lupus-prone 6-mo-old MRL/lpr mouse. Data are from one experiment representative of two independent experiments with five to seven mice per group. *, P < 0.05. Data from A–D are from three individual mice per condition from one experiment.
Figure 3.
Figure 3.
Adoptive transfer of regulatory CD4+ T cells rescues impairment in antigen-specific B cell responses. (A) Schematic for the Treg cell adoptive transfer experiment. (B) Left: Representative plots of HA-specific GC B cells as determined by HA probe in Bcl6f/f, Bcl6f/f Foxp3-Cre, and Bcl6f/f Foxp3-Cre + Treg cell group. Right: Quantification of the percentages and numbers of HA-specific GC B cell responses with adoptive transfer strategy at day 38 p.i. (C) Left: Representative plot of the adoptively transferred Treg cell population defined as CD4+CD44hiCD45.1+. Middle and right: Representative plots of the adoptively transferred population (CD45.1+) in the Tfh cell compartment defined as CD4+CD44hiFoxp3Ly6CPSGL1lowCXCR5hiPD1hi. (D) Representative plots of Tfr cells derived from the transferred Treg cells gated as CD45.1+ Foxp3+ in Bcl6f/f, Bcl6f/f Foxp3-Cre and Bcl6f/f Foxp3-Cre + Treg cell animals. Tfr cells are defined as CD4+CD44hiLy6CPSGL1loCXCR5hiPD1hiFoxp3+. Statistical analyses were performed using the unpaired two-tailed Student’s t test (*, P < 0.05; **, P < 0.01). Data are from one experiment representative of two experiments with four or five mice per group performed 38 d following influenza virus infection.
Figure S4.
Figure S4.
Mice lacking follicular regulatory CD4+ T cells mount similar Tfh cell responses compared with control mice at 8 and 38 d following influenza virus infection. (A) Left: Representative plots of the polyclonal CD4+ Tfh cell response in Bcl6f/f Foxp3-Cre and Bcl6f/f mice at day 8 p.i. CD4+CD44+Foxp3PSGL1lowLy6C cells were gated on CXCR5 and PD1 to define the Tfh cell population. Right: Quantification of the percentage and number of Tfh cells as shown in the left plots. (B) Mean fluorescence intensity (MFI) of Bcl6 (left) and Ki67 (right) intracellular staining in Tfh cells gated as described. (C) Volcano plot of differentially expressed genes from RNA-seq of CD4+ Tfh cells from Bcl6f/f and Bcl6f/f Foxp3-Cre mice at 8 d p.i. The red dashed line plotted indicates the level of Bonferroni-corrected P value <0.05. (D) Left: Representative plots of the HA-specific and NP-specific CD4+ Tfh cell response in Bcl6f/f Foxp3-Cre, Bcl6f/f and naive mice at day 8 p.i. Tfh cells were gated as described in A; T cells from naive mice were gated on CD4+ CD44hi population. Right: Quantification of the percentage and number of HA-specific and NP-specific Tfh cells as shown in the left plots. (E) Left: Representative plots of the polyclonal CD4+ Tfh cell response in Bcl6f/f Foxp3-Cre and Bcl6f/f mice at day 38 p.i. Right: Quantification of the percentage and number of Tfh cells as shown in the left plots. (F and G) Quantification of the percentage and number of Treg cells in Bcl6f/f Foxp3-Cre and Bcl6f/f mice at day 8 p.i. and day 38 p.i., respectively. Statistical analyses were performed using the unpaired two-tailed Student’s t test (**, P < 0.01). Data for A, B, and E–G are from one experiment representative of three experiments with five to eight mice per group. Data for C are from three independent experiments with three or four mice per group pooled for each sample. Data for D are from one experiment representative of two experiments with four to six mice per group. n.s., not significant.
Figure 4.
Figure 4.
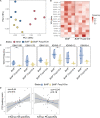
Mice lacking follicular regulatory CD4+ T cells exhibit a distinct BCR repertoire following influenza virus infection. (A) Principal component analysis visualization of VH gene usage frequency for total unique Igh sequences isolated from the mLN-derived repertoire. (B) Heatmaps showing VH gene usage frequencies for the top 15 VH genes based on maximal principal component 2 score from principal component analysis of total Igh sequences. These are shown with values normalized for each row based on Z-score. (C) Individual VH gene frequencies relative to the total number of unique variant VDJ sequences are plotted for the top six VH genes. Significance was assessed using a two-tailed Wilcoxon test with a significance threshold of *, P < 0.1; **, P, < 0.05. Horizontal bars show the average frequency of VH gene usage for samples of a specific genotype. (D) Scatterplots for VH genes based on their principal component 2 loading score compared with their usage frequency among the published set of VH sequences from Kuraoka et al. (2016) associated with HA specificity (compared with non-HA specifics; left) or with PA specificity (compared with non-PA specific sequences; right) at day 16 after immunization. Correlations were computed as Pearson correlation coefficients, and a P value was assigned to the significance of the correlation with a significance threshold of P < 0.05. For the BCR repertoire analysis, data are from one experiment with four mice per group performed 15 d following PR8 influenza virus infection. Cor., Pearson correlation coefficient.
Figure S5.
Figure S5.
Many mLN Igh repertoire features are consistent between wild-type and mice lacking follicular regulatory CD4+ T, including clonality, selection pressure, isotype usage, and somatic hypermutation. (A) Left: Principal component analysis visualization of VH gene usage frequency for Igh sequences associated with an IgG constant region. Right: Heatmaps showing VH gene usage frequencies for the top 15 VH genes based on maximal principal component 1 score from the principal component analysis of IgG-only sequences. (B) Overall isotype usage of IgM, IgG, and IgA. Horizontal bars indicate the mean isotype frequency. (C) Somatic hypermutation frequencies of the VH gene region for IgG and IgM. Igh somatic hypermutation frequencies are computed relative to the best matched germline references from IMGT. Horizontal bars indicate the mean of the mutation frequency. (D) Mutability, the frequency at which 5-mer sequences with hot (WRC/GYW and WA/TW) or cold (SYC/GRS) spots are observed to be mutated, is plotted for each sample. Horizontal bars show the mean mutability frequency. (E) Clonal diversity at Hill diversity indices of Q = 0 (richness) and Q = 2 are plotted. Each point represents an estimated diversity score based on bootstrap realizations of the clonal abundance curve from each sample. Horizontal bars correspond to the mean diversity index across samples of a given genotype. (F) Baseline selection pressure analysis is shown as a density on the y axis and selection strength (å) on the x axis for both the complementarity determining region (CDR) and the framework region (FWR). For BCR repertoire analysis, data are from one experiment with four mice per group performed 15 d following PR8 influenza virus infection.
Figure 5.
Figure 5.
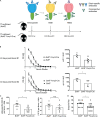
Mice generate impaired influenza virus stalk-specific B cell responses in the absence of follicular regulatory CD4+ T cells in a sequential vaccination model with antigenically diverse antigens. Analysis of the stalk-specific B cell response in Bcl6f/f Foxp3-Cre and Bcl6f/f mice following multiple boosts in an influenza virus sequential vaccination model. (A) Schematic of the sequential vaccination model. (B) Quantification of stalk-specific IgG antibody titers as determined by ELISA using chimeric HA cH11/1 as coating substrate at 40 d following the first boost (top) and 40 d following the second boost (bottom). (C) Left: Quantification of stalk-specific ASCs in the bone marrow compartment from Bcl6f/f or Bcl6f/f Foxp3-Cre mice at 42 d following the second boost. Right: Quantification of the total number of bone marrow cells in each mouse. (D) Antibody response against the H1N1 head domain in Bcl6f/f Foxp3-Cre and Bcl6f/f mice measured by influenza hemagglutination inhibition assay following sequential vaccination. Statistical analyses were performed using the unpaired two-tailed Student’s t test (*, P < 0.05). Data for A–C are from one experiment representative of two experiments with five to seven mice per group performed at various time points following sequential vaccination with diverse group 1 influenza viruses. Data for D are pooled from two independent experiments with five to seven mice per group following sequential vaccination. AUC, area under the curve; n.s., not significant.

References

    1. Anders, S., McCarthy D.J., Chen Y., Okoniewski M., Smyth G.K., Huber W., and Robinson M.D.. 2013. Count-based differential expression analysis of RNA sequencing data using R and Bioconductor. Nat. Protoc. 8:1765–1786. 10.1038/nprot.2013.099 - DOI - PubMed
    1. Andrews, S.F., Huang Y., Kaur K., Popova L.I., Ho I.Y., Pauli N.T., Henry Dunand C.J., Taylor W.M., Lim S., Huang M., et al. . 2015. Immune history profoundly affects broadly protective B cell responses to influenza. Sci. Transl. Med. 7:316ra192. 10.1126/scitranslmed.aad0522 - DOI - PMC - PubMed
    1. Angeletti, D., Gibbs J.S., Angel M., Kosik I., Hickman H.D., Frank G.M., Das S.R., Wheatley A.K., Prabhakaran M., Leggat D.J., et al. . 2017. Defining B cell immunodominance to viruses. Nat. Immunol. 18:456–463. 10.1038/ni.3680 - DOI - PMC - PubMed
    1. Botta, D., Fuller M.J., Marquez-Lago T.T., Bachus H., Bradley J.E., Weinmann A.S., Zajac A.J., Randall T.D., Lund F.E., León B., and Ballesteros-Tato A.. 2017. Dynamic regulation of T follicular regulatory cell responses by interleukin 2 during influenza infection. Nat. Immunol. 18:1249–1260. 10.1038/ni.3837 - DOI - PMC - PubMed
    1. Böttcher-Friebertshäuser, E., Freuer C., Sielaff F., Schmidt S., Eickmann M., Uhlendorff J., Steinmetzer T., Klenk H.-D., and Garten W.. 2010. Cleavage of influenza virus hemagglutinin by airway proteases TMPRSS2 and HAT differs in subcellular localization and susceptibility to protease inhibitors. J. Virol. 84:5605–5614. 10.1128/JVI.00140-10 - DOI - PMC - PubMed

Publication types

MeSH terms