. 2019 Jan 1:2019:baz085.
doi: 10.1093/database/baz085.

Large expert-curated database for benchmarking document similarity detection in biomedical literature search

Collaborators, Affiliations

Large expert-curated database for benchmarking document similarity detection in biomedical literature search

Peter Brown et al. Database (Oxford). .

Abstract

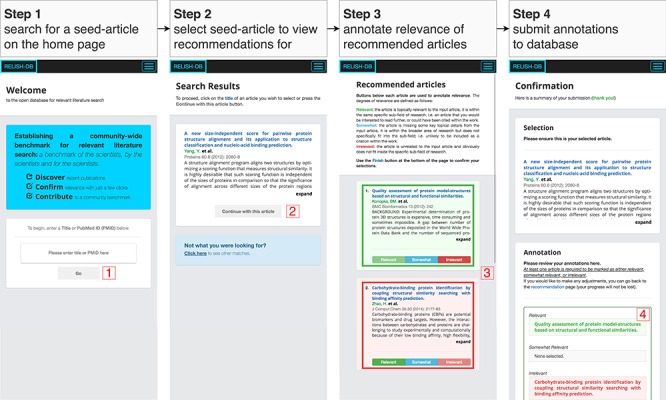
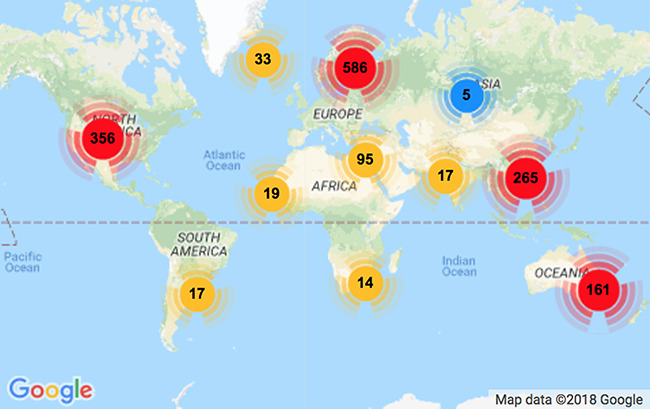
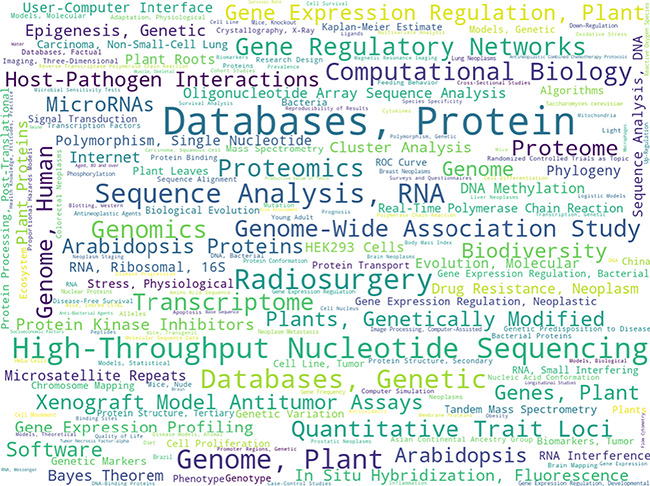
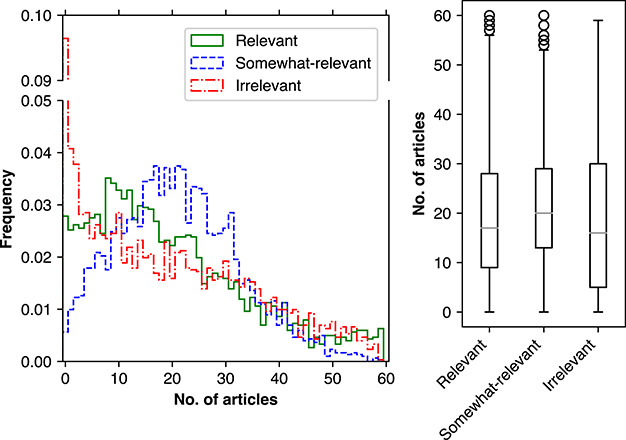
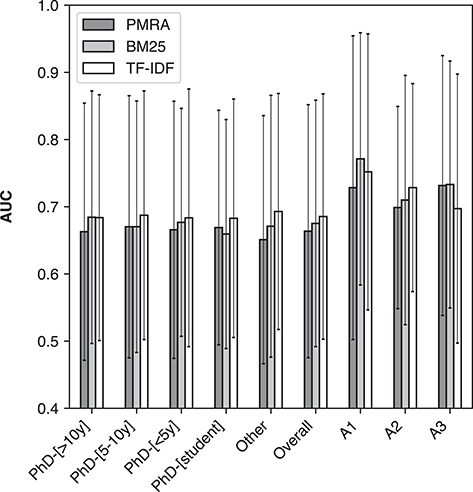
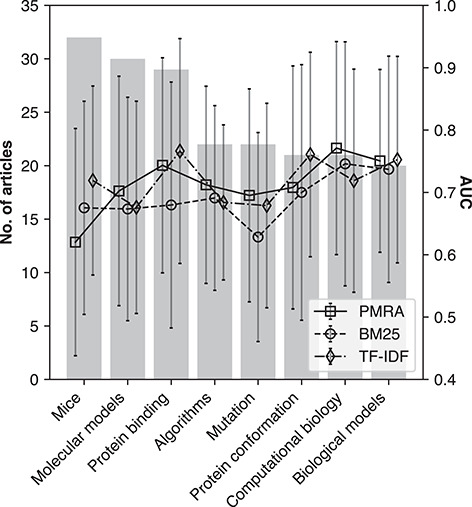
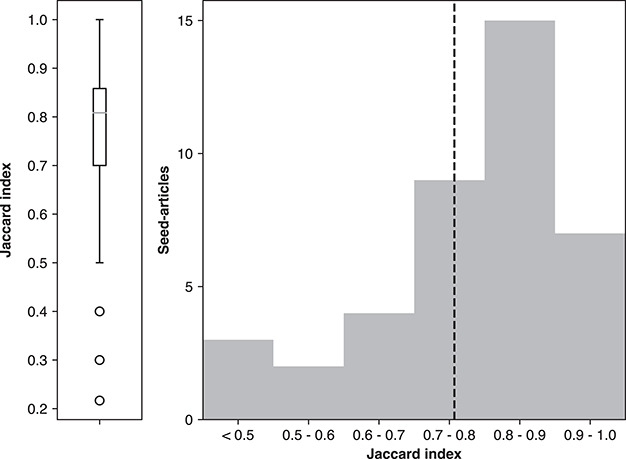
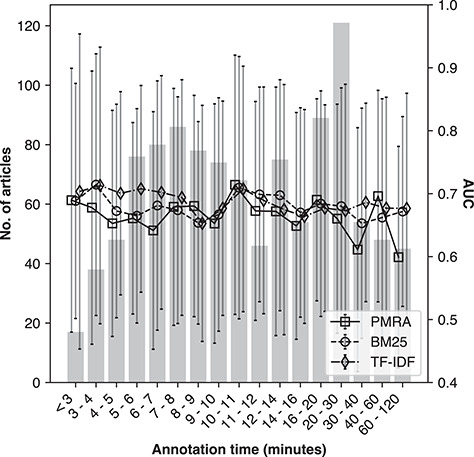
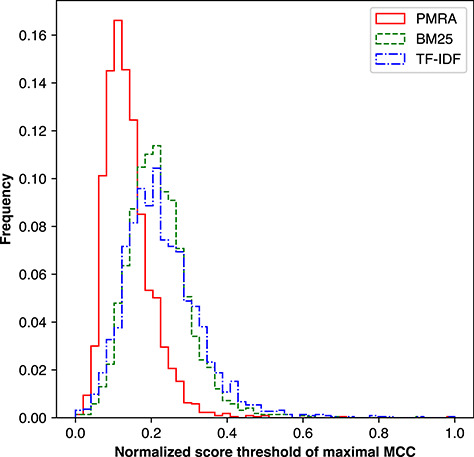
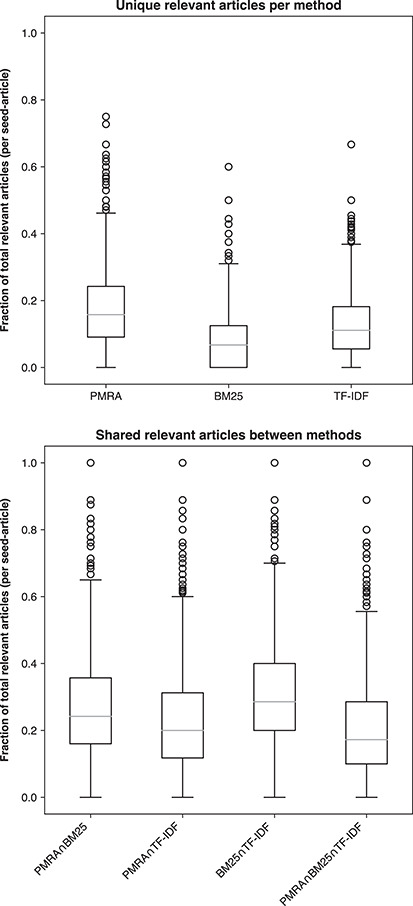
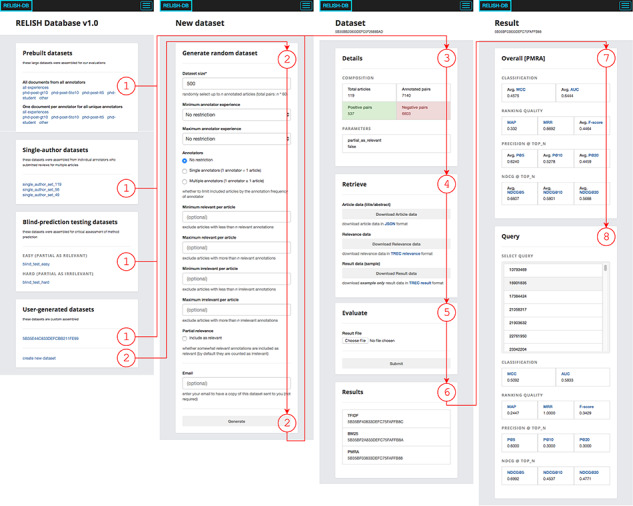
Document recommendation systems for locating relevant literature have mostly relied on methods developed a decade ago. This is largely due to the lack of a large offline gold-standard benchmark of relevant documents that cover a variety of research fields such that newly developed literature search techniques can be compared, improved and translated into practice. To overcome this bottleneck, we have established the RElevant LIterature SearcH consortium consisting of more than 1500 scientists from 84 countries, who have collectively annotated the relevance of over 180 000 PubMed-listed articles with regard to their respective seed (input) article/s. The majority of annotations were contributed by highly experienced, original authors of the seed articles. The collected data cover 76% of all unique PubMed Medical Subject Headings descriptors. No systematic biases were observed across different experience levels, research fields or time spent on annotations. More importantly, annotations of the same document pairs contributed by different scientists were highly concordant. We further show that the three representative baseline methods used to generate recommended articles for evaluation (Okapi Best Matching 25, Term Frequency-Inverse Document Frequency and PubMed Related Articles) had similar overall performances. Additionally, we found that these methods each tend to produce distinct collections of recommended articles, suggesting that a hybrid method may be required to completely capture all relevant articles. The established database server located at https://relishdb.ict.griffith.edu.au is freely available for the downloading of annotation data and the blind testing of new methods. We expect that this benchmark will be useful for stimulating the development of new powerful techniques for title and title/abstract-based search engines for relevant articles in biomedical research.


Figures

Figure 1
Figure 1
An overview of the four stages comprising the annotation procedure. In step 1, the title or PubMedID of a desired seed article is searched; in step 2, a seed article is selected; in step 3, the result list is presented to the participant for annotation; and in step 4, all annotations are reviewed before being submitted to the database.
Figure 2
Figure 2
Distribution of participant geolocation. There are 1570 registered participants from 84 unique countries. The majority of contributors are from Europe, North America, China and Australia.
Figure 3
Figure 3
Word cloud of the 250 most frequent MeSH qualifiers from all seed articles normalized by frequencies in the whole PubMed library. In total, unique qualifiers present in the seed article collection (i.e. each seed article with its recommended candidate articles) cover 76% of all unique MeSH qualifiers.
Figure 4
Figure 4
Left: frequency of seed articles (y-axis) containing formula image annotated candidate articles of respective labels (x-axis). Right: distribution of annotated candidate articles across all seed articles. Boxes represent the quartiles; middle lines are the median values.
Figure 5
Figure 5
Method performance in terms of average AUC (ROC) for PMRA, BM25 and TF-IDF on the ‘NR1220’ set across experience levels within annotators and across three individual annotators (A1, A2 and A3). Error bars represent standard deviation.
Figure 6
Figure 6
Method performance in terms of AUC (ROC) for PMRA, BM25 and TF-IDF across eight different research areas: Mice (‘D051379’), Molecular models (‘D008958’), Protein binding (‘D011485’), Algorithms (‘D000465’), Mutation (‘D009154’), Protein conformation (‘D011487’), Computational biology (‘D019295’) and Biological models (‘D008954’). Bars correspond to number of seed articles in the topic area, whereas lines indicate method performance according to AUC values. Error bars represent standard deviation.
Figure 7
Figure 7
Agreement between different annotators for the same seed article using Jaccard Index shown as average (left) and distribution (right). The box on the left represents quartiles with the median as the middle line. The dashed line on the right is the average agreement value.
Figure 8
Figure 8
Method performance as a function of annotation time spent for the ‘NR1220’ evaluation set; the x-axis is binned time-spent in minutes; the vertical bars corresponding to the left y-axis is the number of seed articles per bin; the lines corresponding to the right y-axis show average AUC (ROC) per bin for the PMRA, BM25 and TF-IDF methods, respectively.
Figure 9
Figure 9
Distribution of score thresholds yielding the highest MCC value per seed article for the PMRA, BM25 and TF-IDF methods.
Figure 10
Figure 10
Consistency and difference among three methods: PMRA, BM25 and TF-IDF; upper—unique relevant recommendations given by each method; lower—overlap of relevant recommendations between methods. Boxes represent the quartiles; middle lines are the median.
Figure 11
Figure 11
An overview of the database retrieval and evaluation process: (1) use existing datasets—both pre-built and user-generated; (2) create custom datasets—allows for user-defined dataset construction by tuning dataset generation parameters; (3) dataset details—shows the size, number of positive and negative pairs and any custom parameters used to generate; (4) dataset article data—allows user download of (a) raw article metadata (id, title and abstract) (b) annotation data and (c) sample result file for evaluation function; (5) result file upload—allows input of result files for automatic performance assessment; (6) uploaded evaluations—results of uploaded result file evaluations for the respective dataset will be presented here; (7) overall evaluation view—provides a performance summary of the dataset as a whole; (8) detailed evaluation view—performance details are broken down on a per-query basis.

References

    1. Anderson D.P. (2004) BOINC: a system for public-resource computing and storage. In: Proceedings of the 5th IEEE/ACM International Workshop on Grid Computing. pp. 4–10. IEEE Computer Society, Washington, DC, USA.
    1. Baeza-Yates R., Hurtado C. and Mendoza M. (2004) Query recommendation using query logs in search engines. In: International Conference on Extending Database Technology. Springer, Berlin, Heidelberg, pp. 588–596.
    1. Beel J., Breitinger C., Langer S. et al. (2016) Towards reproducibility in recommender-systems research. User Model. User-adapt. Interact., 26, 69–101.
    1. Beel J., Gipp B., Langer S. et al. (2016) Research paper recommender systems: a literature survey. Int. J. Digit. Libr., 17, 305–338.
    1. Boughorbel S., Jarray F., and El-Anbari M. (2017) Optimal classifier for imbalanced data using Matthews correlation coefficient metric. PLoS One, 12, e0177678. - PMC - PubMed