. 2020 Dec 16;16(12):e1009163.
doi: 10.1371/journal.ppat.1009163. eCollection 2020 Dec.

mRNA induced expression of human angiotensin-converting enzyme 2 in mice for the study of the adaptive immune response to severe acute respiratory syndrome coronavirus 2

Affiliations

mRNA induced expression of human angiotensin-converting enzyme 2 in mice for the study of the adaptive immune response to severe acute respiratory syndrome coronavirus 2

Mariah Hassert et al. PLoS Pathog. .

Abstract

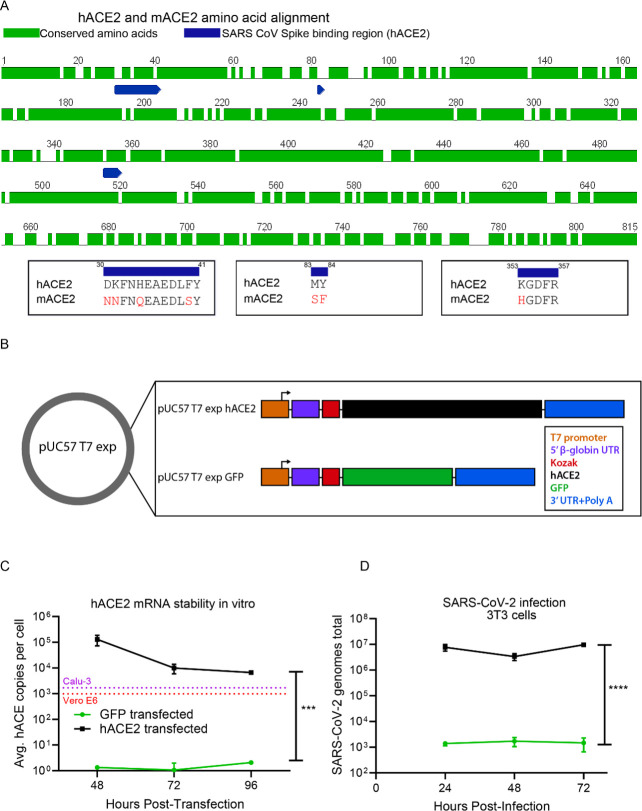
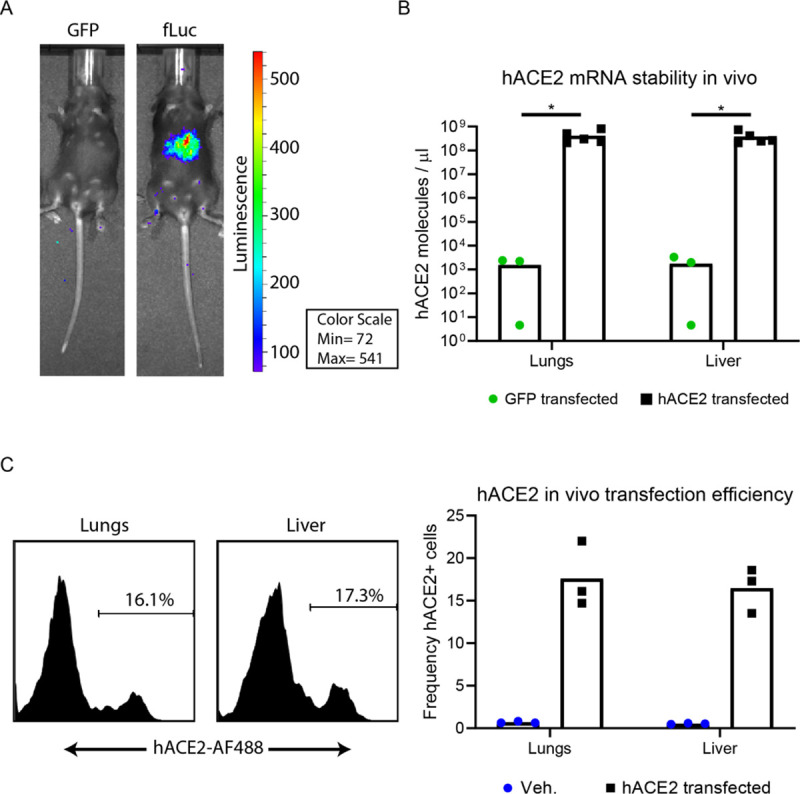
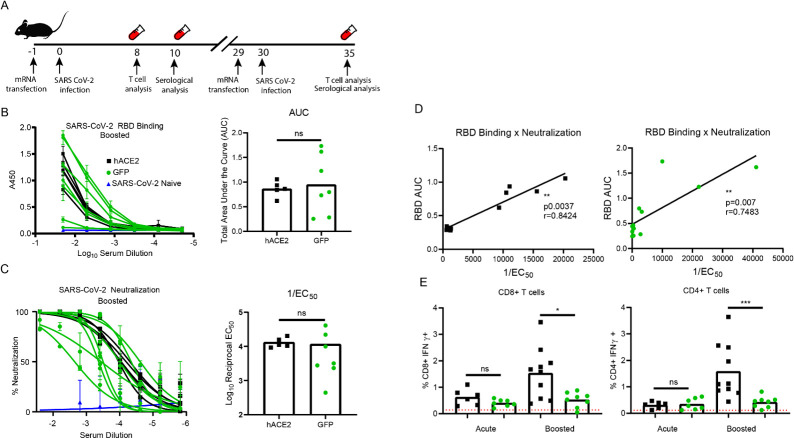
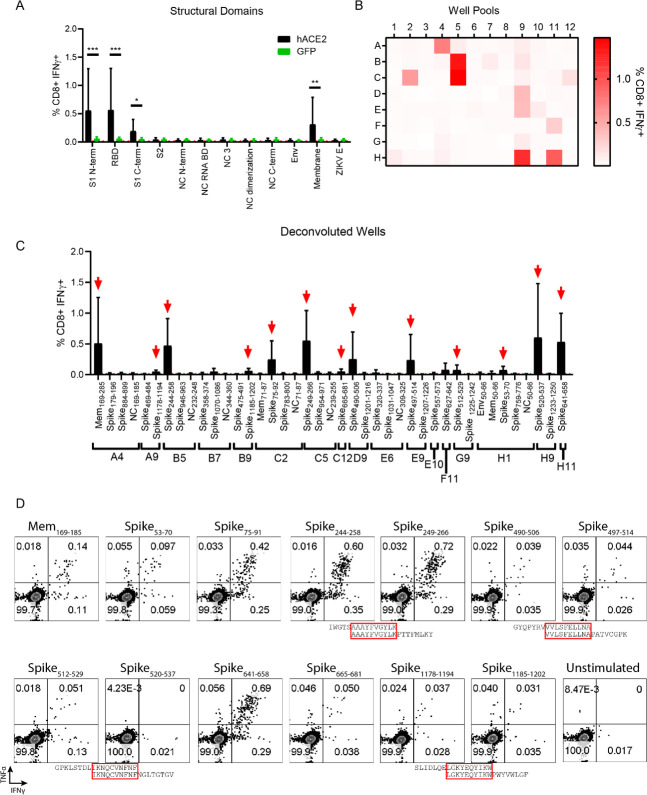
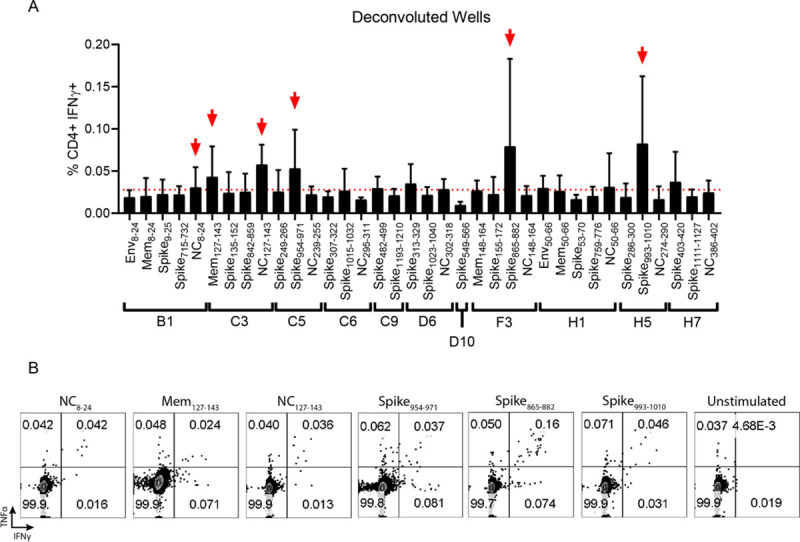
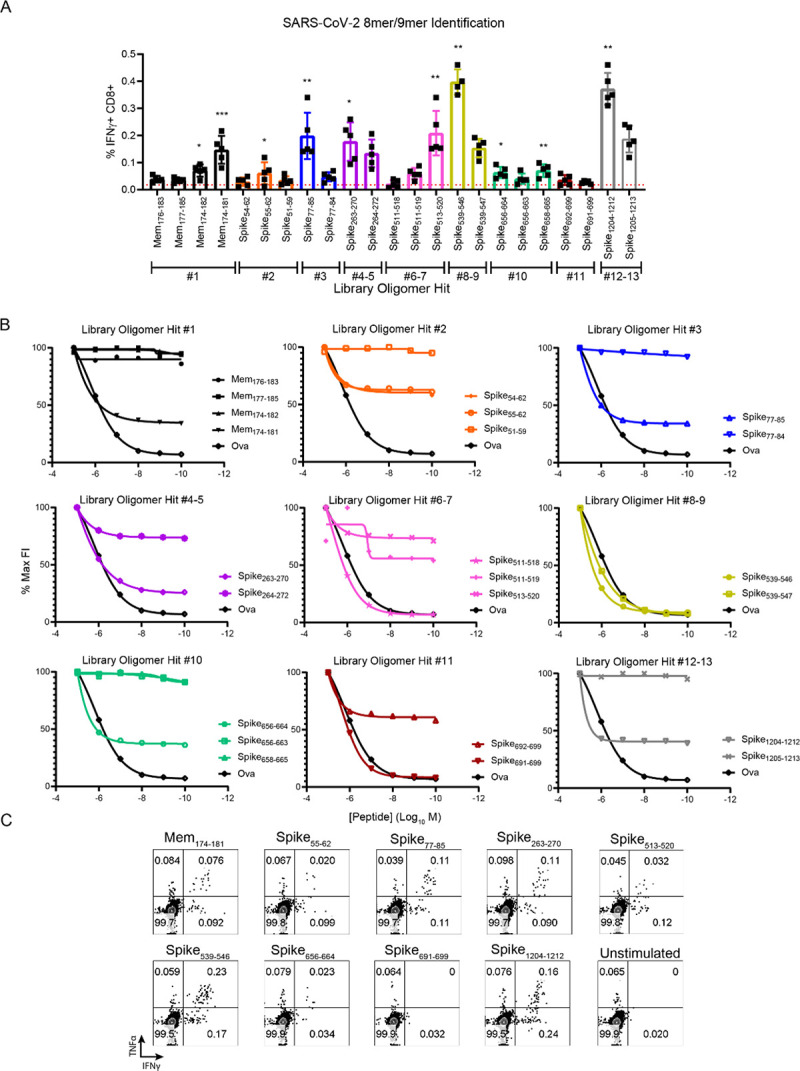
The novel human coronavirus, severe acute respiratory syndrome coronavirus 2 (SARS-CoV-2) has caused a pandemic. Critical to the rapid evaluation of vaccines and antivirals against SARS-CoV-2 is the development of tractable animal models to understand the adaptive immune response to the virus. To this end, the use of common laboratory strains of mice is hindered by significant divergence of the angiotensin-converting enzyme 2 (ACE2), which is the receptor required for entry of SARS-CoV-2. In the current study, we designed and utilized an mRNA-based transfection system to induce expression of the hACE2 receptor in order to confer entry of SARS-CoV-2 in otherwise non-permissive cells. By employing this expression system in an in vivo setting, we were able to interrogate the adaptive immune response to SARS-CoV-2 in type 1 interferon receptor deficient mice. In doing so, we showed that the T cell response to SARS-CoV-2 is enhanced when hACE2 is expressed during infection. Moreover, we demonstrated that these responses are preserved in memory and are boosted upon secondary infection. Importantly, using this system, we functionally identified the CD4+ and CD8+ structural peptide epitopes targeted during SARS-CoV-2 infection in H2b restricted mice and confirmed their existence in an established model of SARS-CoV-2 pathogenesis. We demonstrated that, identical to what has been seen in humans, the antigen-specific CD8+ T cells in mice primarily target peptides of the spike and membrane proteins, while the antigen-specific CD4+ T cells target peptides of the nucleocapsid, membrane, and spike proteins. As the focus of the immune response in mice is highly similar to that of the humans, the identification of functional murine SARS-CoV-2-specific T cell epitopes provided in this study will be critical for evaluation of vaccine efficacy in murine models of SARS-CoV-2 infection.


Conflict of interest statement

The authors have declared that no competing interests exist.

Figures

Fig 1
Fig 1. Transient expression of hACE2 in murine cells allows for SARS-CoV-2 entry.
(A) Amino acid identity between hACE2 and mACE2. The amino acid sequences of human ACE2 (hACE2) (BAB40370) and murine ACE2 (mACE2) (NP_081562) were globally aligned using a BLOSUM62 cost matrix in the computational program Geneious. The two sequences showed 81.2% amino acid identity. Specific regions of interest included the amino acid residues important for SARS-CoV spike binding (and putative SARS-CoV-2 spike binding) (residues 30–41, 83–83, and 353–357). Multiple amino acid differences were noted in red in these critical regions between hACE2 and mACE2. (B) mRNA expression construct for induced expression of hACE2. T7 expression cassettes for hACE2 (and negative control GFP) were cloned into a pUC57 backbone by Gibson assembly. Each expression cassette includes a T7 promoter element, a 5’ β-globin UTR, Kozak sequence, CDS of each gene of interest (hACE2 or GFP), followed by a 3’ UTR and polyA tail. Following plasmid linearization and purification, mRNA was prepared in vitro using an ARCA T7 in vitro transcription kit. (C) In vitro stability of hACE2 mRNA. 2x10⁶ Murine 3T3 cells were transfected with 2 μg of either hACE2 or GFP mRNA and plated at a density of 5x10⁶ cells in each well of a 6 well dish. At 48, 72, and 96 hours post transfection, the stability of the hACE2 mRNA within the cells was assessed by qRT-PCR. Statistical significance was determined by 2-way ANOVA (p = 0.004). (D) In vitro expression of hACE2 permits SARS-CoV-2 entry. 2x10⁶ Murine 3T3 cells were transfected with 2 μg of either hACE2 or GFP mRNA and plated at a density of 5x10⁶ cells in each well of a 6 well dish. 24 hours post transfection, cells were infected with SARS-CoV-2. At 24, 48, and 72 hours post infection, SARS-CoV-2 RNA was quantified from the 3T3 cell pellets by qRT-PCR. Statistical significance was determined by 2-way ANOVA (p<0.0001).
Fig 2
Fig 2. In vivo transfection efficiency.
(A) fLuc reporter expression. 10 μg of fLuc or GFP mRNA was prepared in Polyplus in vivo-jet RNA in vivo transfection reagent and administered to Ifnar1-/- via IV and IN combination route. 24 hours following transfection, mice were injected IP with D-luciferin and imaged via IVIS 15 minutes later. (B) hACE2 mRNA stability in vivo. Ifnar1-/- mice were transfected with 10 μg of GFP or hACE2 mRNA. 24 hours post transfection, mice were euthanized and liver and lung tissue homogenized in TriReagent RT for RNA extraction. hACE2 mRNA levels were quantified from extracted RNA via qRT-PCR. Statistical significance was determined by Mann-Whitney test (p = 0.03 and p = 0.03, in the lungs and liver, respectively) (C) hACE2 in vivo transfection efficiency, Ifnar1-/- mice were transfected with 10 μg of hACE2 mRNA or vehicle alone. 24 hours post transfection, mice were euthanized and liver and lung tissue were dissociated into single cell suspensions and stained with a human-ACE-2 specific antibody, followed by an AF488-conjugated anti-human secondary antibody. Live cells were analyzed on an Attune focusing flow cytometer and are represented as frequency of hACE2 expressing cells.
Fig 3
Fig 3. In vivo transfection of hACE2 mRNA yields enhanced CD4+ and CD8+ T cell responses.
(A) Experimental design. 8-week-old Ifnar1-/- mice were transfected with 10 μg of GFP or hACE2 mRNA. 24 hours post transfection, mice were infected with SARS-CoV-2. At days 8 and 10 post infection, blood was collected for acute phase T cell stimulation assays and serology recpectively. At days 29 post initial infection, the mice were again transfected with 10 μg of GFP or hACE2 mRNA and infected 24 hours later. 5 days post boost, blood and serum was collected for memory recall T cell stimulation assays and serological analysis. (B) Spike RBD ELISA. Serially diluted serum from mice five days post boost was added to a recombinant SARS-CoV-2 spike RBD protein coated plate to determine RBD binding potential by absorbance at 450nm. The results of the dilution series was used to calculate the area under the curve calculation. (C) Neutralization potential of polyclonal sera. As above serum from boosted mice was serially diluted with ~100 focus forming units of SARS-CoV-2. Neutralization was determined by enumerating a reduction in infectious particles with increased serum concentration and determining the EC50. (D) Correlation between RBD binding and SARS-CoV-2 neutralization for both the hACE2 and GFP transfected SARS-CoV-2 infected Ifnar1-/- mice. Correlative analysis between RBD ELISA AUC values and 1/EC50 values was performed using linear regression analysis and a two-tailed Pearson analysis p<0.0037, r = 0.8424 and p<0.007, r = 0.7483 for the hACE2 and GFP transfected mice respectively. (E) Global T cell responses during SARS-CoV-2 infection. Eight days post infection and five days post boost, collected blood lymphocytes were stimulated with anti-CD3 nd stained with anti CD19, CD4, CD8, IFNγ and TNFα. The frequency of responding CD8+ and CD4+ T cells was demonstrated by quantifying the frequency of CD8+ or CD4+ T cells producing IFNγ. The gating strategy is shown in S3 Fig. Statistical significance was determined by Mann-Whitney test (p = 0.025 and 0.0009 for CD8+ and CD4+ boosted T cell responses, respectively).
Fig 4
Fig 4. In vivo transfection of hACE2 mRNA permits the detection and functional mapping of SARS-CoV-2 specific CD8+ T cell responses.
(A) CD8+ T cell responses to pooled peptide domains. Each equimolar peptide library pools was demarcated by peptides contained in functional domains of each protein (11 total pools). Five days post boosted infection with SARS-CoV-2 following mRNA transfection harvested splenocytes were stimulated with each peptide pool. Cells were stained to evaluate the frequency of responsive CD8+ T cells by IFN-γ expression. (B) CD8+ T cell responses to smaller well peptide pools. Each library was incorporated into multiple 96-well plate formats (S5 Fig). Within the same layout, wells from the plates were pooled such that all A1 peptides were pooled, all A2 peptides, etc. maintaining the 96-well plate format reducing the overall number of screened samples. As in 3A splenocytes boosted mice were harvested and stimulated with each peptide pool. The frequency of IFN-γ+ CD8+T cells—the magnitude of which represents responsiveness to a peptide in the pool, is enumerated in a heat map format as the average responses of 3 mice. (C) Identified potential well hits, were deconvoluted and used individually to stimulate splenocytes from hACE2 transfected, SARS-CoV-2 infected mice. 13 potential epitopes were identified (marked with red arrows) as defined by the frequency of IFN-γ+ CD8+T cells being at least 2-fold above background (stimulated with vehicle) in at least 3 of the 4 mice screened. (D) Representative flow cytometry plots displaying IFN-γ and TNFα expression in CD8+ T cells for each putative epitope in comparison to a vehicle control. Due to the overlapping nature of the peptide library, Spike244-258 and Spike249-266, likely are demonstrating responsiveness to the same peptide epitope. 3 other instances of this phenomenon are denoted with red boxes surrounding the amino acid sequence overlap. Statistical significance was determined by Mann-Whitney test (*p = .0159, **p = 0.0079).
Fig 5
Fig 5. In vivo transfection of hACE2 mRNA permits the detection and functional mapping of SARS-CoV-2 specific CD4+ T cell responses.
(A) As potential “well” hits were identified, the peptides contained in each well were deconvoluted and used individually to stimulate splenocytes from hACE2 transfected, SARS-CoV-2 infected mice. 6 potential epitopes were identified (marked with red arrows) as defined by the frequency of IFN-γ+ CD4+ T cells being at least 2-fold above background (stimulated with vehicle) in at least 3 of the 4 mice screened. (B) Representative flow cytometry plots displaying IFN-γ and TNFα expression in CD4+ T cells for each putative epitope in comparison to a vehicle control.
Fig 6
Fig 6. Identification of optimal 8-mer and 9-mer peptide epitopes.
(A) T cell response to 8-mer or 9-mer peptides. Multiple SARS-CoV-2 8-mer or 9-mer peptide variants from each potential library hit were identified and purchased based on known Kb or Db anchor residues. Five days post boosted infection with SARS-CoV-2 following transfection with hACE2 mRNA, splenocytes were harvested and stimulated for 6 hours with each peptide in the presence of brefeldin A. After stimulation, cells were stained for flow cytometry to evaluate the frequency of responsive CD8+T cells by IFN-γ expression. Each color is indicative of a peptide variant being derived an individual potential library hit. (B) Kb RMA-S stabilization assay. To determine relative ability of individual peptide variants to stabilize the Kb molecule, decreasing concentrations of each peptide variant were incubated for 4 hours with TAP deficient RMA-S cells at 29 degrees C before being moved to 37 degrees C for 1 hour. Cells were then stained for either Kb or Db with fluorescently conjugated antibodies and geometric mean fluorescent intensity (gMFI) was measured using an Atttune focusing flow cytometer. Fluorescence index (FI) was determined by dividing the gMFI of cells pulsed with peptide by cells with no peptide. Data is presented as a percentage of the maximum FI for each peptide. As a positive control, the Kb restricted peptide Ovalbumin (SIINFEKL) was used. (C) Representative cytokine responses to each optimal epitope of mice transfected with hACE2 and infected with SARS-CoV-2 five days post boost.

Update of

Similar articles

Cited by

References

    1. Gouveia CC, Campos L. Coronavirus Disease 2019: Clinical Review. Acta Med Port. 2020. Epub 2020/06/06. 10.20344/amp.13957 . - DOI - PubMed
    1. Jiang S, Hillyer C, Du L. Neutralizing Antibodies against SARS-CoV-2 and Other Human Coronaviruses. Trends Immunol. 2020;41(5):355–9. Epub 2020/04/07. 10.1016/j.it.2020.03.007 - DOI - PMC - PubMed
    1. Grifoni A, Weiskopf D, Ramirez SI, Mateus J, Dan JM, Moderbacher CR, et al. Targets of T Cell Responses to SARS-CoV-2 Coronavirus in Humans with COVID-19 Disease and Unexposed Individuals. Cell. 2020;181(7):1489–501 e15. Epub 2020/05/31. 10.1016/j.cell.2020.05.015 - DOI - PMC - PubMed
    1. Peng Y, Mentzer AJ, Liu G, Yao X, Yin Z, Dong D, et al. Broad and strong memory CD4 (+) and CD8 (+) T cells induced by SARS-CoV-2 in UK convalescent COVID-19 patients. bioRxiv. 2020. Epub 2020/06/25. 10.1101/2020.06.05.134551 - DOI - PMC - PubMed
    1. Zost SJ, Gilchuk P, Case JB, Binshtein E, Chen RE, Reidy JX, et al. Potently neutralizing human antibodies that block SARS-CoV-2 receptor binding and protect animals. bioRxiv. 2020. Epub 2020/06/09. 10.1101/2020.05.22.111005 - DOI - PMC - PubMed

Publication types

MeSH terms