. 2020 Dec 23;183(7):2020-2035.e16.
doi: 10.1016/j.cell.2020.11.024. Epub 2020 Dec 15.

High-Throughput Discovery and Characterization of Human Transcriptional Effectors

Affiliations

High-Throughput Discovery and Characterization of Human Transcriptional Effectors

Josh Tycko et al. Cell. .

Abstract

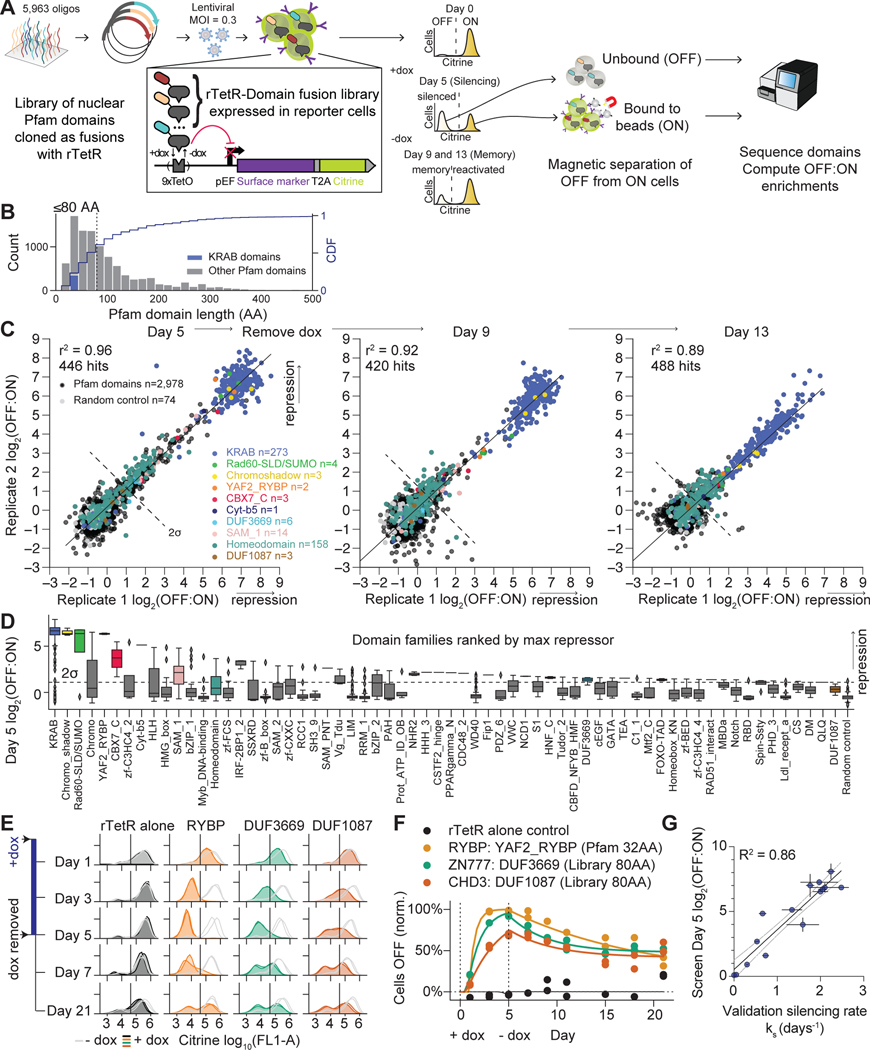
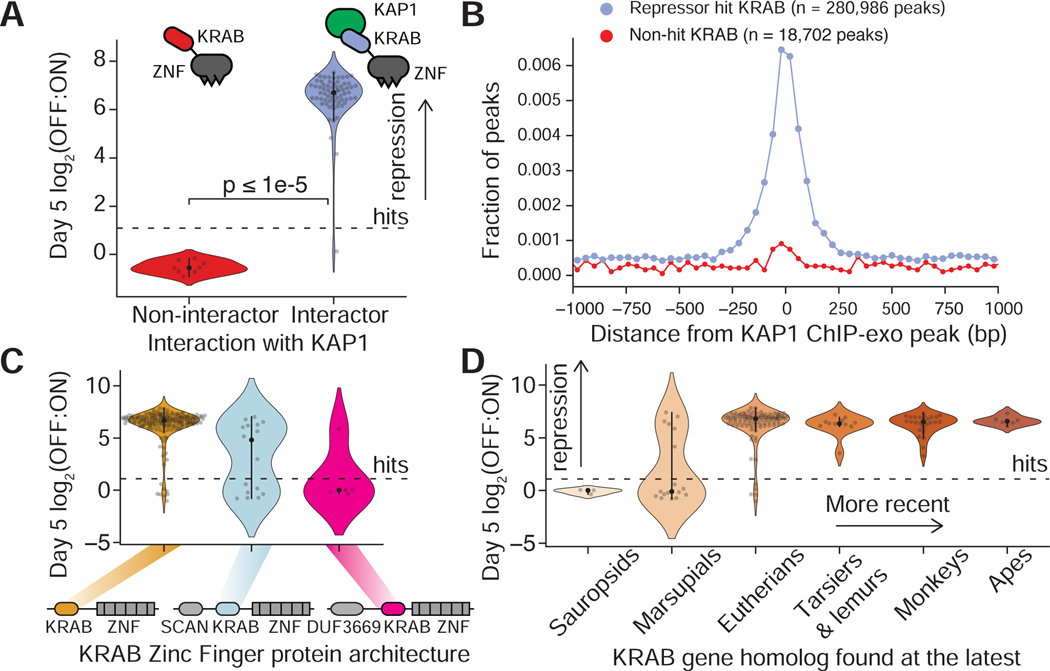
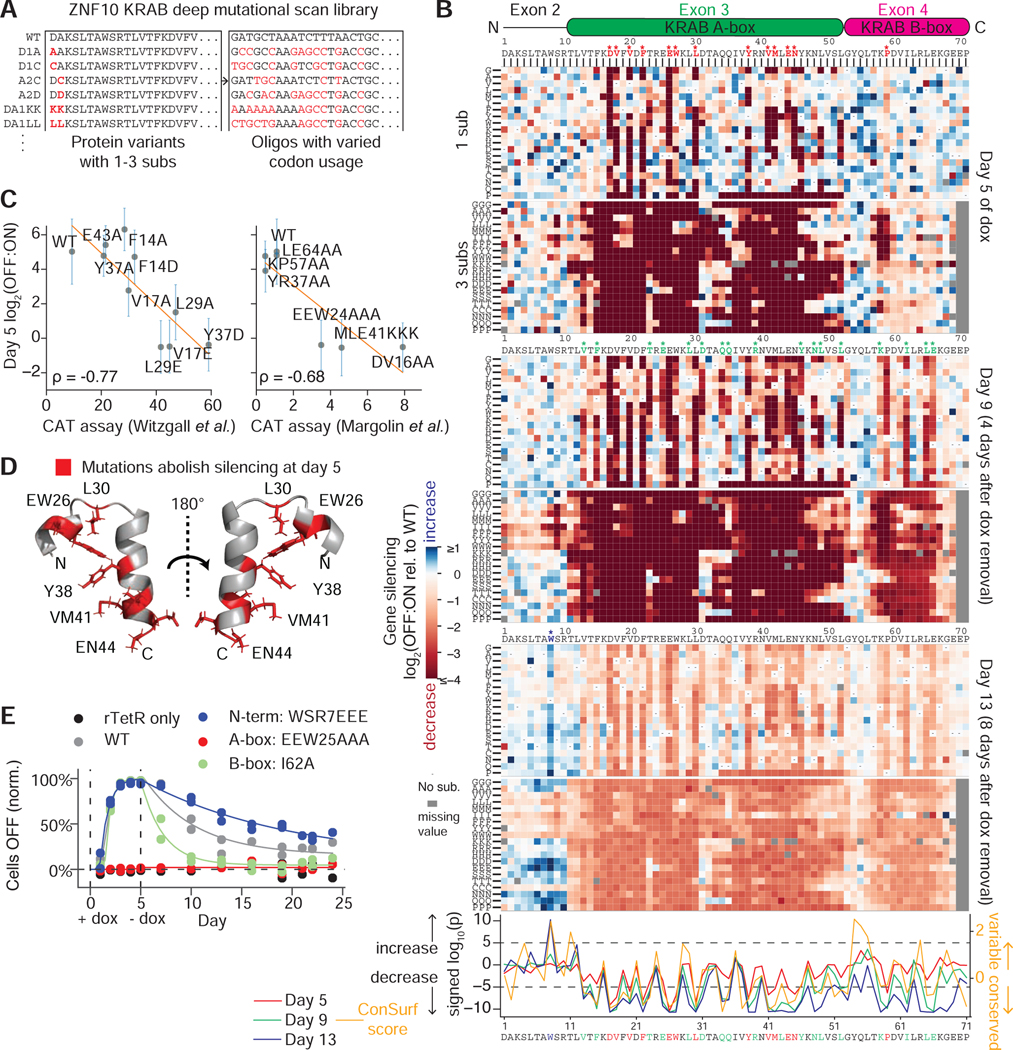
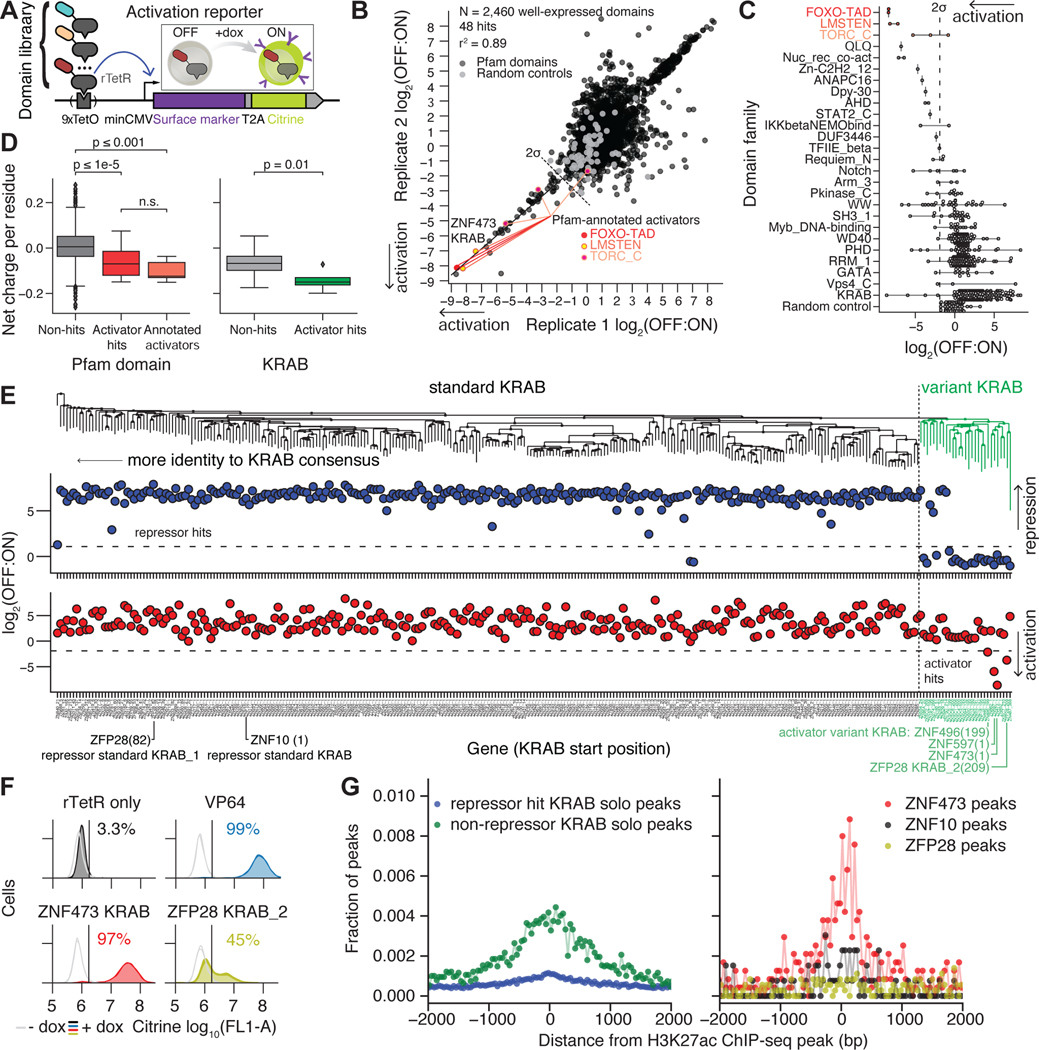
Thousands of proteins localize to the nucleus; however, it remains unclear which contain transcriptional effectors. Here, we develop HT-recruit, a pooled assay where protein libraries are recruited to a reporter, and their transcriptional effects are measured by sequencing. Using this approach, we measure gene silencing and activation for thousands of domains. We find a relationship between repressor function and evolutionary age for the KRAB domains, discover that Homeodomain repressor strength is collinear with Hox genetic organization, and identify activities for several domains of unknown function. Deep mutational scanning of the CRISPRi KRAB maps the co-repressor binding surface and identifies substitutions that improve stability/silencing. By tiling 238 proteins, we find repressors as short as ten amino acids. Finally, we report new activator domains, including a divergent KRAB. These results provide a resource of 600 human proteins containing effectors and demonstrate a scalable strategy for assigning functions to protein domains.

Keywords: CRISPRi; Hox; KRAB; chromatin regulation; deep mutational scan; domain of unknown function; high-throughput screening; mammalian synthetic biology; protein domains; transcriptional effectors.


Conflict of interest statement

Declaration of Interests Stanford University has filed a provisional patent related to this work.

Figures

Figure 1.
Figure 1.. HT-recruit discovers hundreds of repressors in a screen of thousands of Pfam domains.
A. Schematic of high-throughput recruitment assay (HT-recruit). A pooled library of Pfam domains is synthesized, cloned as a fusion to the rTetR DNA-binding domain, and delivered to reporter cells. The repression reporter uses a pEF promoter that can be silenced by dox-mediated recruitment of repressor domains via rTetR at TetO sites. The reporter includes a fluorescent citrine and a synthetic surface marker (Igκ-hIgG1-Fc-PDGFRβ) for magnetic bead separation of ON from OFF cells. Cells were treated with dox for 5 days, ON and OFF cells were separated, and domains were sequenced. Dox was removed and time points were taken to measure epigenetic memory. B. Pfam domain lengths for nuclear proteins. Domains ≤80 AA (dashed line) were selected for the library. Cumulative Distribution Function (CDF) on the right-side axis. KRAB is an example effector family. C. Reproducibility from 2 biological replicates with selected families colored. The hit threshold is set two S.D. above the mean of the poorly expressed negative controls (dashed line). D. Boxplots of repressor families, ranked by maximum repression of any domain in the family. Line=median. Whiskers extend beyond the high- and low-quartile by 1.5X the interquartile range. Diamonds=outliers. Dashed line=hit threshold. E. Individual validations for RYBP domain and 2 DUFs, measured by flow cytometry. Untreated cell distributions (grey) and dox-treated cells (colors); 2 independently-transduced biological replicates per condition. Vertical line=citrine gate used to determine OFF fraction. F. Validation time courses fit with the gene silencing model: exponential silencing with rate ks, followed by exponential reactivation (Methods). Dox (1000 ng/ml) added on day 0 and removed on day 5 (N=2 biological replicates). The fraction of mCherry positive cells with the citrine reporter OFF was determined by flow cytometry, as in (E), and normalized for background silencing using the untreated, time-matched controls. G. Correlation of high-throughput measurements at day 5 with the silencing rate ks (R2=0.86, n=15 domains, N=2–3 biological replicates). Horizontal error bars are S.D. for the fitted rates, vertical error bars are the range of screen biological replicates, and dashed lines are the 95% confidence interval of the linear regression.
Figure 2.
Figure 2.. Repressor KRAB domains are found in younger KRAB-Zinc finger proteins that co-localize and bind to the KAP1 co-repressor.
A. KRAB domain repression strength distributions (OFF:ON ratio after 5 days of recruitment) categorized by whether their KRAB Zinc Finger protein (KZFP) interacts significantly with co-repressor KAP1 by co-IP mass-spec. Mass spec dataset from (Helleboid et al., 2019). Each dot is a KRAB domain; dashed line=hit threshold (N=76 domains). B. Aggregate distance of solo ChIP peak locations (Methods) of KZFPs away from the nearest peaks of the co-repressor KAP1. Each dot shows the fraction of peaks in a 40 bp bin. ChIP data retrieved from external datasets (Table S5) (N=150 hit KZFP ChIP datasets, N=11 non-hit KZFP ChIP datasets). C. Repression measurements for KRAB domains (dots) natively found in KZFPs with three different architectures. Dashed line=hit threshold. D. Repression strength for KRAB domains (dots) from KZFPs of varying evolutionary age as determined by the most recent human ancestor with a genetic homolog (ages as reported in (Imbeault et al., 2017)). Dashed line=hit threshold.
Figure 3.
Figure 3.. Deep mutational scan of the ZNF10 KRAB domain identifies substitutions that reduce or enhance repressor function.
A. Library including all single and consecutive double and triple substitutions in the KRAB domain of ZNF10 (5,731 elements). Red residues differ from the WT. DNA oligos are designed to be more distinct by varying codon usage. B. (Top) All single and triple substitution (sub) variant repressor measurements relative to the WT are shown underneath a schematic of the KRAB domain. The N-terminal extension is encoded on exon 2, the KRAB A-box is encoded on exon 3, and the KRAB B-box is encoded on exon 4. Substitutions start at the position indicated. Dashes=WT residue and grey =missing value. Asterisks show significant residues. (Bottom) For each position at each timepoint, the distribution of all single substitutions was compared to the distribution of wild-type effects (Wilcoxon rank sum test). Positions with signed log10(p)<−5 at day 5 are colored in red (highly significantly decrease in silencing), with signed log10(p)<−5 at day 9 but not day 5 are colored in green, and the position W8 with log10(p)>5 at day 13 is colored in blue (highly significant increase). Dashed horizontal lines=hit thresholds. ConSurf is a sequence conservation score. C. HT-recruit measurements correlate with previously published low-throughput recruitment CAT assay (Margolin et al., 1994; Witzgall et al., 1994). Vertical bars=S.E. from 2 biological replicates. A lower CAT assay value reflects a higher KRAB silencing activity. D. Residues that abolish silencing at day 5 when mutated are mapped onto the ordered region of the NMR structure of mouse KRAB A-box (PDB: 1v65). E. Individual validations of rTetR-KRAB mutant fusions. 1000 ng/ml dox was added on day 0 and removed on day 5, the percentage of cells OFF was measured by flow cytometry, normalized for background silencing, and fit with the gene silencing model (Methods, N=2 biological replicates of lentiviral infection).
Figure 4.
Figure 4.. Hox homeodomain repression strength is colinear with Hox gene organization.
A. Ranking of homeobox gene classes by median repression strength of their homeodomain at day 5. Horizontal line=hit threshold. The CERS class is not shown because none of the 5 homeodomains were well-expressed. B. Homeodomains from the Hox gene families. (Top) Hox gene expression pattern along the anterior-posterior axis is colored by Hox paralog number on an adapted embryo image (Hueber et al., 2010). Hox 11 and 12 are expressed at the posterior end and along the proximal-distal axis of limbs (Wellik and Capecchi, 2003). (Middle) Repression strength. Dots are colored by the Hox cluster. Spearman’s rho and p-value were computed for the relationship between the paralog number and repressor strength across all Hox genes. (Bottom) Colored arrows represent the genes in human Hox clusters and point in the direction of transcription from 5′ to 3′. Grey bars separate gene sequence similarity groups as previously classified (Hueber et al., 2010). C. Alignment of Hox homeodomains, ranked by OFF:ON ratio at day 5, highlighting the RKKR motif (red) and basic residues within the N-terminal arm (lavender). D. Correlation between the number of positively charged residues in the N-terminal arm of each Hox homeodomain and the repression at day 5. Dot color=paralog number. E. NMR structure of the HOXA13 homeodomain (PDB ID: 2L7Z, positions G15-S81 in coordinates from (C)), with RKKR motif (red).
Figure 5.
Figure 5.. HT-recruit discovers activator domains.
A. Activation reporter using a minCMV promoter that can be activated by dox-mediated recruitment of activating effector domains fused to rTetR. B. HT-recruit activator measurements from 2 independently transduced biological replicates. Activation reporter cells were transduced with the nuclear domain library and treated with dox for 48 hours; ON and OFF cells were magnetically separated, and the domains were sequenced. The OFF:ON ratios are shown for domains that were well-expressed. Pfam-annotated activator domain families are colored in shades of red. A line is drawn to the strongest hit, KRAB from ZNF473. Dashed line=hit threshold two S.D. below the mean of the poorly expressed domains. C. Rank list of domain families with an activator hit. Dashed line=hit threshold. D. Acidity of domains, calculated as net charge per residue. Non-hit, well-expressed Pfam domains (except KRAB and annotated activators) compared with hits (left). Pfam-annotated activator domain families are shown as a group as a positive control (orange). Comparison of the activator hits and non-hits from the KRAB family (right). P-values from Mann-Whitney test shown, with bars between groups. n.s. = not significant. E. Phylogenetic tree of well-expressed KRAB domains with the variant KRAB cluster shown in green (top). HT-recruit measurements for repression at Day 5 are shown in blue (middle) and for activation are shown in red (bottom). Dashed horizontal lines=hit thresholds. KRAB domain start position is written in parentheses. F. Individual validation of variant KRAB activators. Untreated cells (grey) and dox-treated cells (colors) shown with 2 biological replicates in each condition. Vertical line=citrine gate used to determine the fraction of cells ON (written above distributions). G. Distance of KZFP ChIP peaks from the nearest peaks of H3K27ac. KRAB proteins are classified based on the repressor screen at day 5 (left). Data is shown individually for ZNF10 (repressor, black), ZNF473 (activator, red), and ZFP28 (contains both an activator and a repressor, yellow) (right). Dots=fraction of peaks in a 40 bp bin. ChIP data retrieved from external datasets (Table S5). Only solo peaks, where a single KRAB Zinc Finger binds, are included for the aggregated data (left), but all peaks are included for the individual proteins because their number of solo peaks is low (right) (Methods).
Figure 6.
Figure 6.. Tiling screen discovers compact repressor domains within nuclear proteins.
A. Tiling library covering 238 nuclear proteins (15,737 elements). These tiles were fused to rTetR and tested with HT-recruit as in Figure 1A. B. Genes ranked by maximum repressor strength. Dots=tiles. Hit threshold is log2(OFF:ON) ≥ 2 S.D. above the mean of the negative controls. Genes with a hit (gradient) and genes no hit (grey) are divided by vertical line.. C. Tiling CTCF. Protein annotations from UniProt. Horizontal bars show the tile span and vertical error bars show the S.E. from 2 biological replicates. The strongest hit tile is highlighted with a vertical gradient and annotated as a repressor (orange). D. Tiling BAZ2A (also known as TIP5). E. Individual lentiviral rTetR(SE-G72P)-tile fusions were delivered to reporter cells, cells were treated with 100 ng/ml dox for 5 days, and then dox was removed. Cells were analyzed by flow cytometry, the fraction of cells with citrine reporter OFF was determined and the data fit with the gene silencing model (Methods) (N=2 biological replicates). KRAB repressor domains are positive controls. Tiling data corresponding to the validations shown on the right (blue) is in Figure S6. F. Tiling MGA. Two repressor domains are found outside the previously annotated regions and labeled as Repressor 1 and 2 (dark red, purple). The minimized repressor sequences at the overlap of hit tiles are highlighted with narrow red vertical gradients. G. The maximal strength repressor tiles from two peaks in MGA were individually validated as in (E). H. MGA repressor 1 was minimized by selecting the region shared between all hit tiles in the peak (red shade between vertical lines). Below, the sequence conservation ConSurf score is shown (orange line) with the confidence interval (the 25th and 75th percentiles of the inferred evolutionary rate distribution, grey). Asterisks=residues Consurf predicts are functional (Methods). I. The MGA effectors were minimized to 10 and 30 AA sub-tiles, as shown in (H), cloned as lentiviral rTetR(SE-G72P)-tile fusions, and delivered to reporter cells. Cells were treated with 100 or 1000 ng/ml dox for 5 days and the percentages of cells with the reporter silenced were measured by flow cytometry (N=2 biological replicates).

References

    1. Al Chiblak M, Steinbeck F, Thiesen H-J, and Lorenz P. (2019). DUF3669, a “domain of unknown function” within ZNF746 and ZNF777, oligomerizes and contributes to transcriptional repression. BMC Mol Cell Biol 20, 60. - PMC - PubMed
    1. Arnold CD, Nemčko F, Woodfin AR, Wienerroither S, Vlasova A, Schleiffer A, Pagani M, Rath M, and Stark A. (2018). A high-throughput method to identify trans-activation domains within transcription factor sequences. EMBO J. e98896. - PMC - PubMed
    1. Ashkenazy H, Erez E, Martz E, Pupko T, and Ben-Tal N. (2010). ConSurf 2010: calculating evolutionary conservation in sequence and structure of proteins and nucleic acids. Nucleic Acids Res. 38, W529–W533. - PMC - PubMed
    1. Bakan A, Meireles LM, and Bahar I. (2011). ProDy: protein dynamics inferred from theory and experiments. Bioinformatics 27, 1575–1577. - PMC - PubMed
    1. Ballas N, Battaglioli E, Atouf F, Andres ME, Chenoweth J, Anderson ME, Burger C, Moniwa M, Davie JR, Bowers WJ, et al. (2001). Regulation of neuronal traits by a novel transcriptional complex. Neuron 31, 353–365. - PubMed

Publication types

MeSH terms