. 2021 Jan 7;108(1):49-67.
doi: 10.1016/j.ajhg.2020.11.016. Epub 2020 Dec 15.

Leveraging phenotypic variability to identify genetic interactions in human phenotypes

Affiliations

Leveraging phenotypic variability to identify genetic interactions in human phenotypes

Andrew R Marderstein et al. Am J Hum Genet. .

Abstract

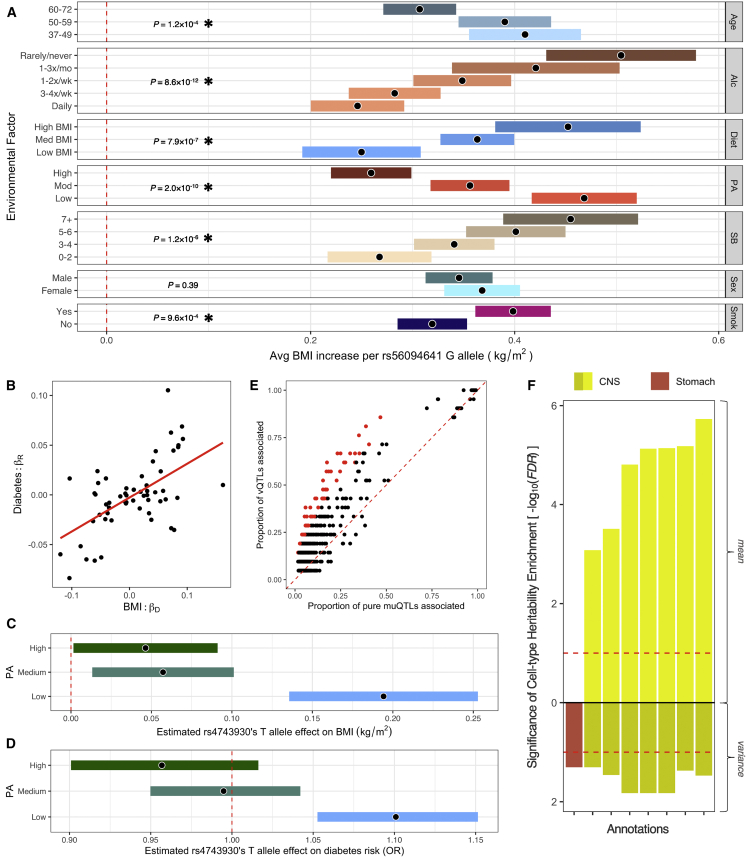
Although thousands of loci have been associated with human phenotypes, the role of gene-environment (GxE) interactions in determining individual risk of human diseases remains unclear. This is partly because of the severe erosion of statistical power resulting from the massive number of statistical tests required to detect such interactions. Here, we focus on improving the power of GxE tests by developing a statistical framework for assessing quantitative trait loci (QTLs) associated with the trait means and/or trait variances. When applying this framework to body mass index (BMI), we find that GxE discovery and replication rates are significantly higher when prioritizing genetic variants associated with the variance of the phenotype (vQTLs) compared to when assessing all genetic variants. Moreover, we find that vQTLs are enriched for associations with other non-BMI phenotypes having strong environmental influences, such as diabetes or ulcerative colitis. We show that GxE effects first identified in quantitative traits such as BMI can be used for GxE discovery in disease phenotypes such as diabetes. A clear conclusion is that strong GxE interactions mediate the genetic contribution to body weight and diabetes risk.

Keywords: GWAS; GxE; body mass index; complex traits; diabetes; gene-environment interactions; phenotypic variance; vQTL.


Conflict of interest statement

O.E. is scientific advisor and equity holder in Freenome, Owkin, Volastra Therapeutics, and One Three Biotech. C.V.V.H. is an employee of the Regeneron Genetics Center.

Figures

Figure 1
Figure 1
vQTLs could arise from a genetic interaction (A) We refer to a genetic variant associated with the variance of the phenotype as a variance QTL (vQTL). The orange line, representing the line of best fit, has slope close to 0 and indicates that the mean of the phenotype does not change with a difference in genotype. (B) A vQTL could also arise from a genetic interaction. The displayed data in (B) is the same data as in (A), except the points are colored to reflect the genotype at a second locus or the level of an environmental variable. This second factor interacts with locus 1 to create a mean-based interaction effect, and this mean-based interaction effect gives the appearance of a vQTL at locus 1. Data in both figures are simulated.
Figure 2
Figure 2
Assessing a variance test for finding SNPs with interaction effects (A) The DRM uses the absolute difference between an individual’s phenotype Yij (for each genotype i and individual j) (y axis) and the within-genotype phenotype median (Yi) as a dependent variable. The absolute difference is modeled in a linear regression across genotypes (x axis). Simulated data shown. (B and C) False positive rates for different variance tests at SNPs with varied mean effects in a (B) normal and (C) non-normal phenotype. Methods tested are as follows: DRM, Levene’s test (LT), Brown-Forsythe test (BF), Bartlett’s test (BT), Fligner-Killeen test (FK), double generalized linear model (DGLM), two-step squared residual approach (TSSR), squared value linear modeling (SVLM), and extended Levene’s test of generalized scale (gS). (D) Power of the DRM, BF, and SVLM in non-normally distributed phenotypes. The gS method’s power is nearly identical to the DRM and is not displayed. (E) The elapsed time to perform each method on a single SNP across 1,000 simulations. The data are summarized as boxplots where the middle line is the median, the lower and upper hinges are the first and third quartiles, and the whiskers extend from the hinge with a length of 1.5× the inter-quartile range. (F) vQTL test power, quantified by the DRM, stratified by whether the SNPs are detected by a muQTL test (linear regression). By using a 2-by-2 contingency table representing the counts of muQTL and vQTL test rejection across 1,000 simulations, Fisher’s exact test assessed whether muQTL power and vQTL power show non-random association. p values are displayed.
Figure 3
Figure 3
GWAS of body mass index levels in UK Biobank (A) Data for imputed genotypes and BMI in unrelated British European individuals were split into a discovery set, representing 80% of the data, and a replication set, representing 20% of the data. Within the discovery set, a GWAS was performed on the means (muQTLs) and variances (raw vQTLs) of untransformed BMI and on the variances (RINT vQTLs) and dispersion (dQTLs) of RINT BMI. (B–H) Across SNPs, the effect sizes (B) and p values (C) were highly correlated between muQTLs and raw vQTLs. The RINT reduced mean-variance correlation (D) and identified a set of RINT vQTLs with smaller muQTL effects (E). Dispersion effects had the least correlation with mean effects (F), and all dQTLs were not the most significant muQTLs (G). In (B)–(G), the red line represents the line of best fit. Points are colored by the –log10 p value of the y axis analysis, and purple represents significance (p < 5 × 10−8 with raw BMI, p < 10−5 with RINT BMI). The GWAS results are summarized in (H), broken down into by the number of QTLs passing the different criteria (indicated by the red coloring and gray counts).
Figure 4
Figure 4
Discovery and replication of GxE interactions (A) Heatmap of all QTLs with an FDR < 0.1 GxE interaction in the discovery set. Each box colored by significance level in the discovery set. Raw vQTL SNPs are highlighted in orange. Smok, smoking status; SB, sedentary behavior level; PA, physical activity level; Alc, alcohol intake frequency. (B–E) Quantile-quantile plots for all GxE interactions across environmental factors and (B) 5,016 matched genome-wide SNPs, (C) 502 QTLs, (D) 448 muQTLs that are not raw vQTLs, or (E) 21 raw vQTLs. The x axis shows the –log10 p values under the null distribution, and the y axis shows the observed –log10 p values, where each point represents a different GxE interaction. The red line represents the expectation under the null with intercept = 0 and slope = 1. (F–I) Replication rates of GxE interactions, as quantified by those with the same direction of effect in both discovery and replication sets and pR < 0.05. Given a threshold x (x axis), the replication rate (y axis) is calculated for all interactions with pD < x. (F) GxE interactions using 5,016 matched genome-wide SNPs. (G) GxE interactions using all 502 QTL-nominated SNPs. (H) GxE interactions using 448 muQTLs that are not raw vQTLs. (I) GxE interactions using 21 raw vQTLs. In (F)–(I), the confidence interval over replication rates is shown in gray and the expected replication rate under random observations (2.5%) is shown in red. Red points are FDR < 0.1, < 0.05, and < 0.01 cut-offs. In (G) and (I), there are no FDR < 0.1 associations.
Figure 5
Figure 5
GxE interactions across environmental factors, human phenotypes, and cell types (A) The estimated marginal BMI effect of the rs56094641 G allele conditioned on the different environmental co-variates. For visualization, age, sedentary behavior values, and diet (bottom 20%, middle 60%, upper 20%) were grouped and ”rarely” or “never” answers for alcohol intake frequency were combined. Significant GxE interactions are highlighted with an asterisk (FDR < 0.1), and nominal p values are shown. (B) Estimated GxE effects in BMI within the 80% discovery set (x axis) from linear regression were correlated with estimated GxE effects on diabetes risk within the 20% replication set (y axis) from logistic regression. Each data point represents a different SNP × co-factor interaction. BMI GxE interactions appear predictive of diabetes GxE interactions. (C and D) The estimated marginal effect of the rs4743930 T allele on (C) BMI and (D) diabetes risk, conditioned on physical activity levels. Estimated diabetes risk effect is in terms of the relative odds ratio (OR). In (A), (C), and (D), the estimate is shown by the black dot, and the bars indicate the 95% confidence intervals. Smok, smoking status; SB, sedentary behavior level; PA, physical activity level; Alc, alcohol intake frequency. (E) The proportion of pure muQTLs (those with no significant raw vQTL association) associated with a phenotype were compared to the proportion of raw vQTLs that are associated. Each point is a different phenotype that is included in the Open Targets database. Phenotype associations significantly enriched in the raw vQTL set (FDR < 0.1) are highlighted in red. (F) The −log10(FDR) describe the partitioned enrichment of BMI mean and BMI variance heritability in specifically expressed genes for a given cell type. Only cell-types with FDR < 0.1 in the BMI variance analysis are shown. Dashed red lines drawn at FDR < 0.1.

References

    1. Carbone M., Emri S., Dogan A.U., Steele I., Tuncer M., Pass H.I., Baris Y.I. A mesothelioma epidemic in Cappadocia: scientific developments and unexpected social outcomes. Nat. Rev. Cancer. 2007;7:147–154. - PubMed
    1. Roushdy-Hammady I., Siegel J., Emri S., Testa J.R., Carbone M. Genetic-susceptibility factor and malignant mesothelioma in the Cappadocian region of Turkey. Lancet. 2001;357:444–445. - PubMed
    1. Testa J.R., Cheung M., Pei J., Below J.E., Tan Y., Sementino E., Cox N.J., Dogan A.U., Pass H.I., Trusa S. Germline BAP1 mutations predispose to malignant mesothelioma. Nat. Genet. 2011;43:1022–1025. - PMC - PubMed
    1. Bononi A., Giorgi C., Patergnani S., Larson D., Verbruggen K., Tanji M., Pellegrini L., Signorato V., Olivetto F., Pastorino S. BAP1 regulates IP3R3-mediated Ca2+ flux to mitochondria suppressing cell transformation. Nature. 2017;546:549–553. - PMC - PubMed
    1. Kadariya Y., Cheung M., Xu J., Pei J., Sementino E., Menges C.W., Cai K.Q., Rauscher F.J., Klein-Szanto A.J., Testa J.R. Bap1 is a bona fide tumor suppressor: genetic evidence from mouse models carrying heterozygous germline Bap1 mutations. Cancer Res. 2016;76:2836–2844. - PMC - PubMed

Publication types

LinkOut - more resources