. 2020 Dec 15;33(11):108498.
doi: 10.1016/j.celrep.2020.108498.

Divergent Role for STAT5 in the Adaptive Responses of Natural Killer Cells

Affiliations

Divergent Role for STAT5 in the Adaptive Responses of Natural Killer Cells

Gabriela M Wiedemann et al. Cell Rep. .

Abstract

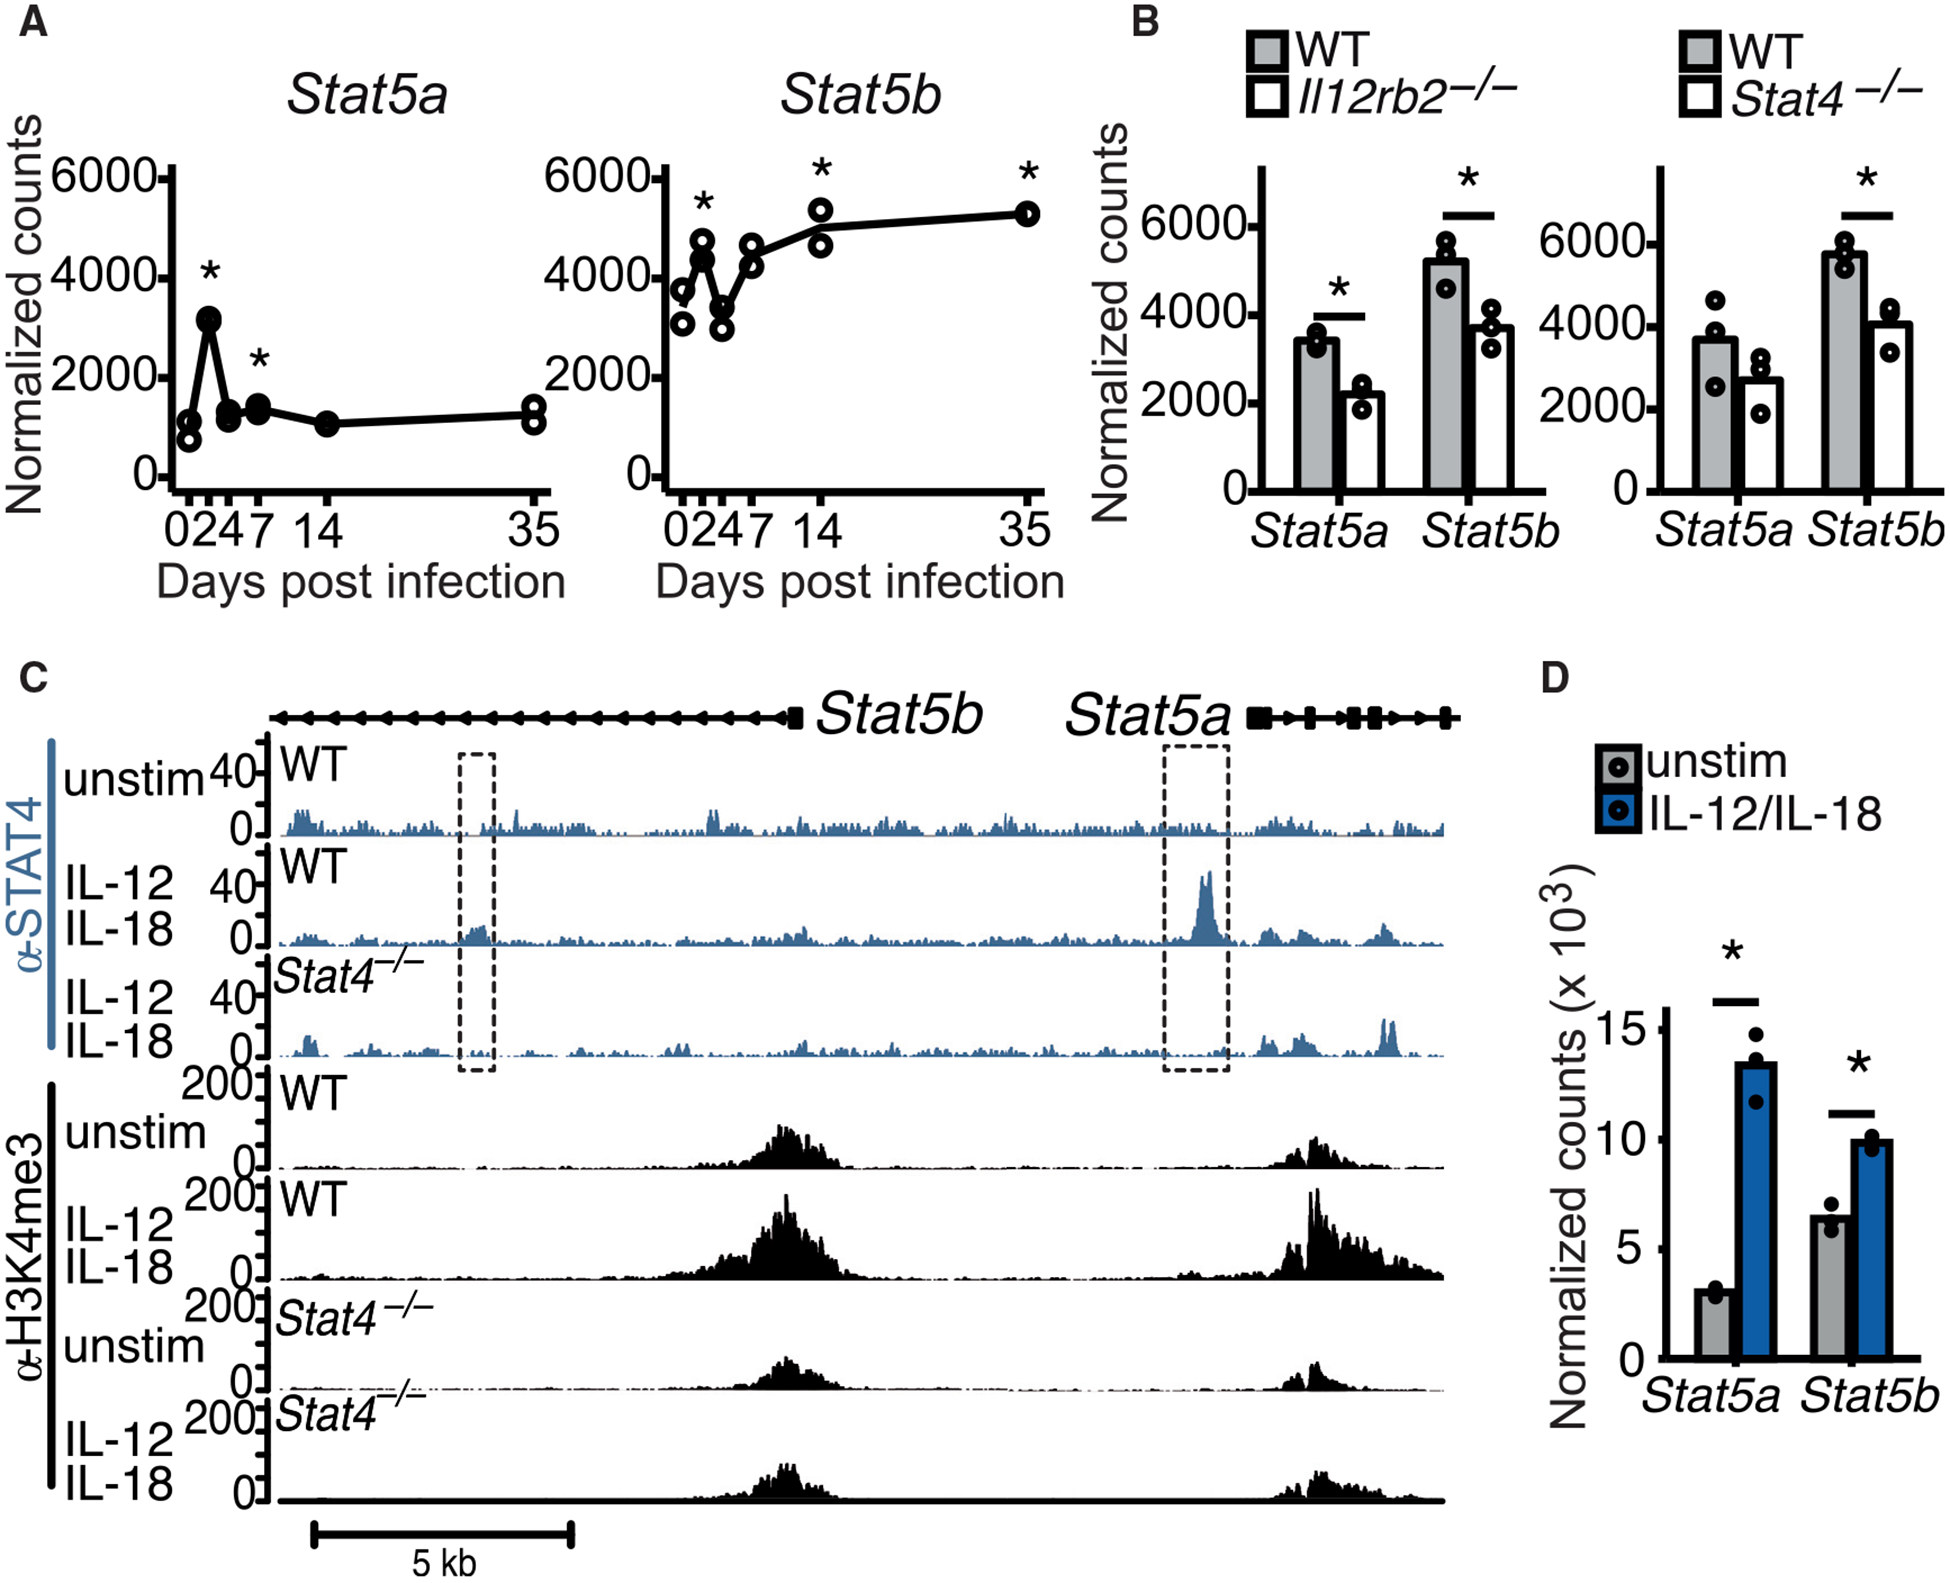
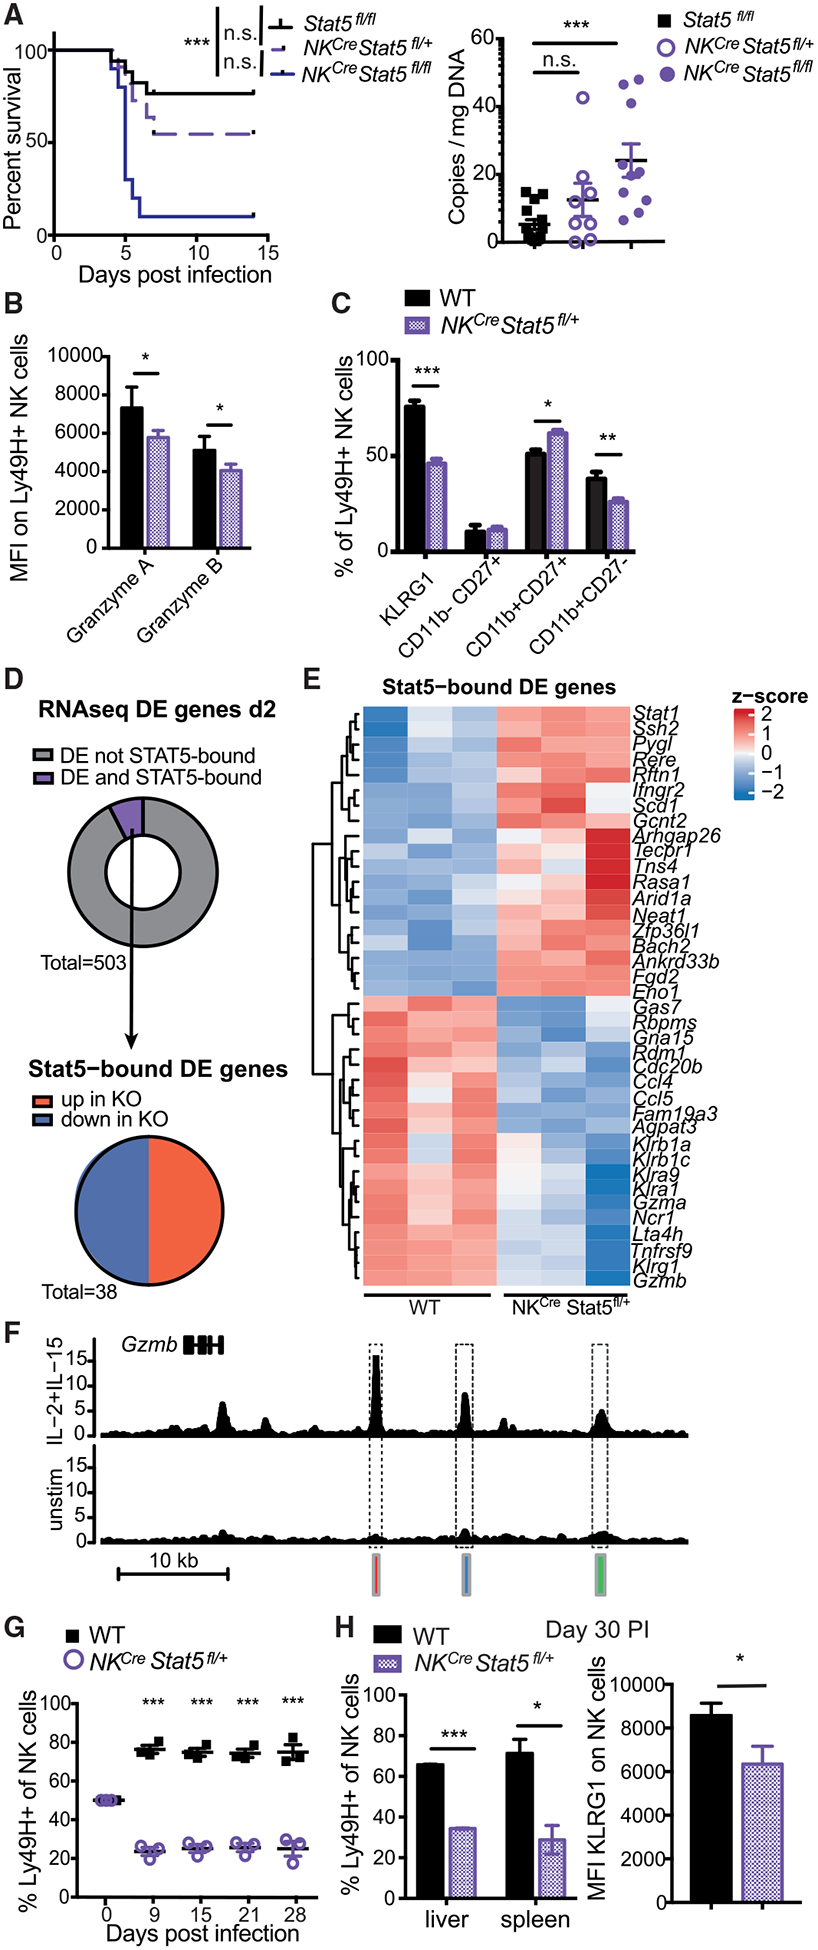
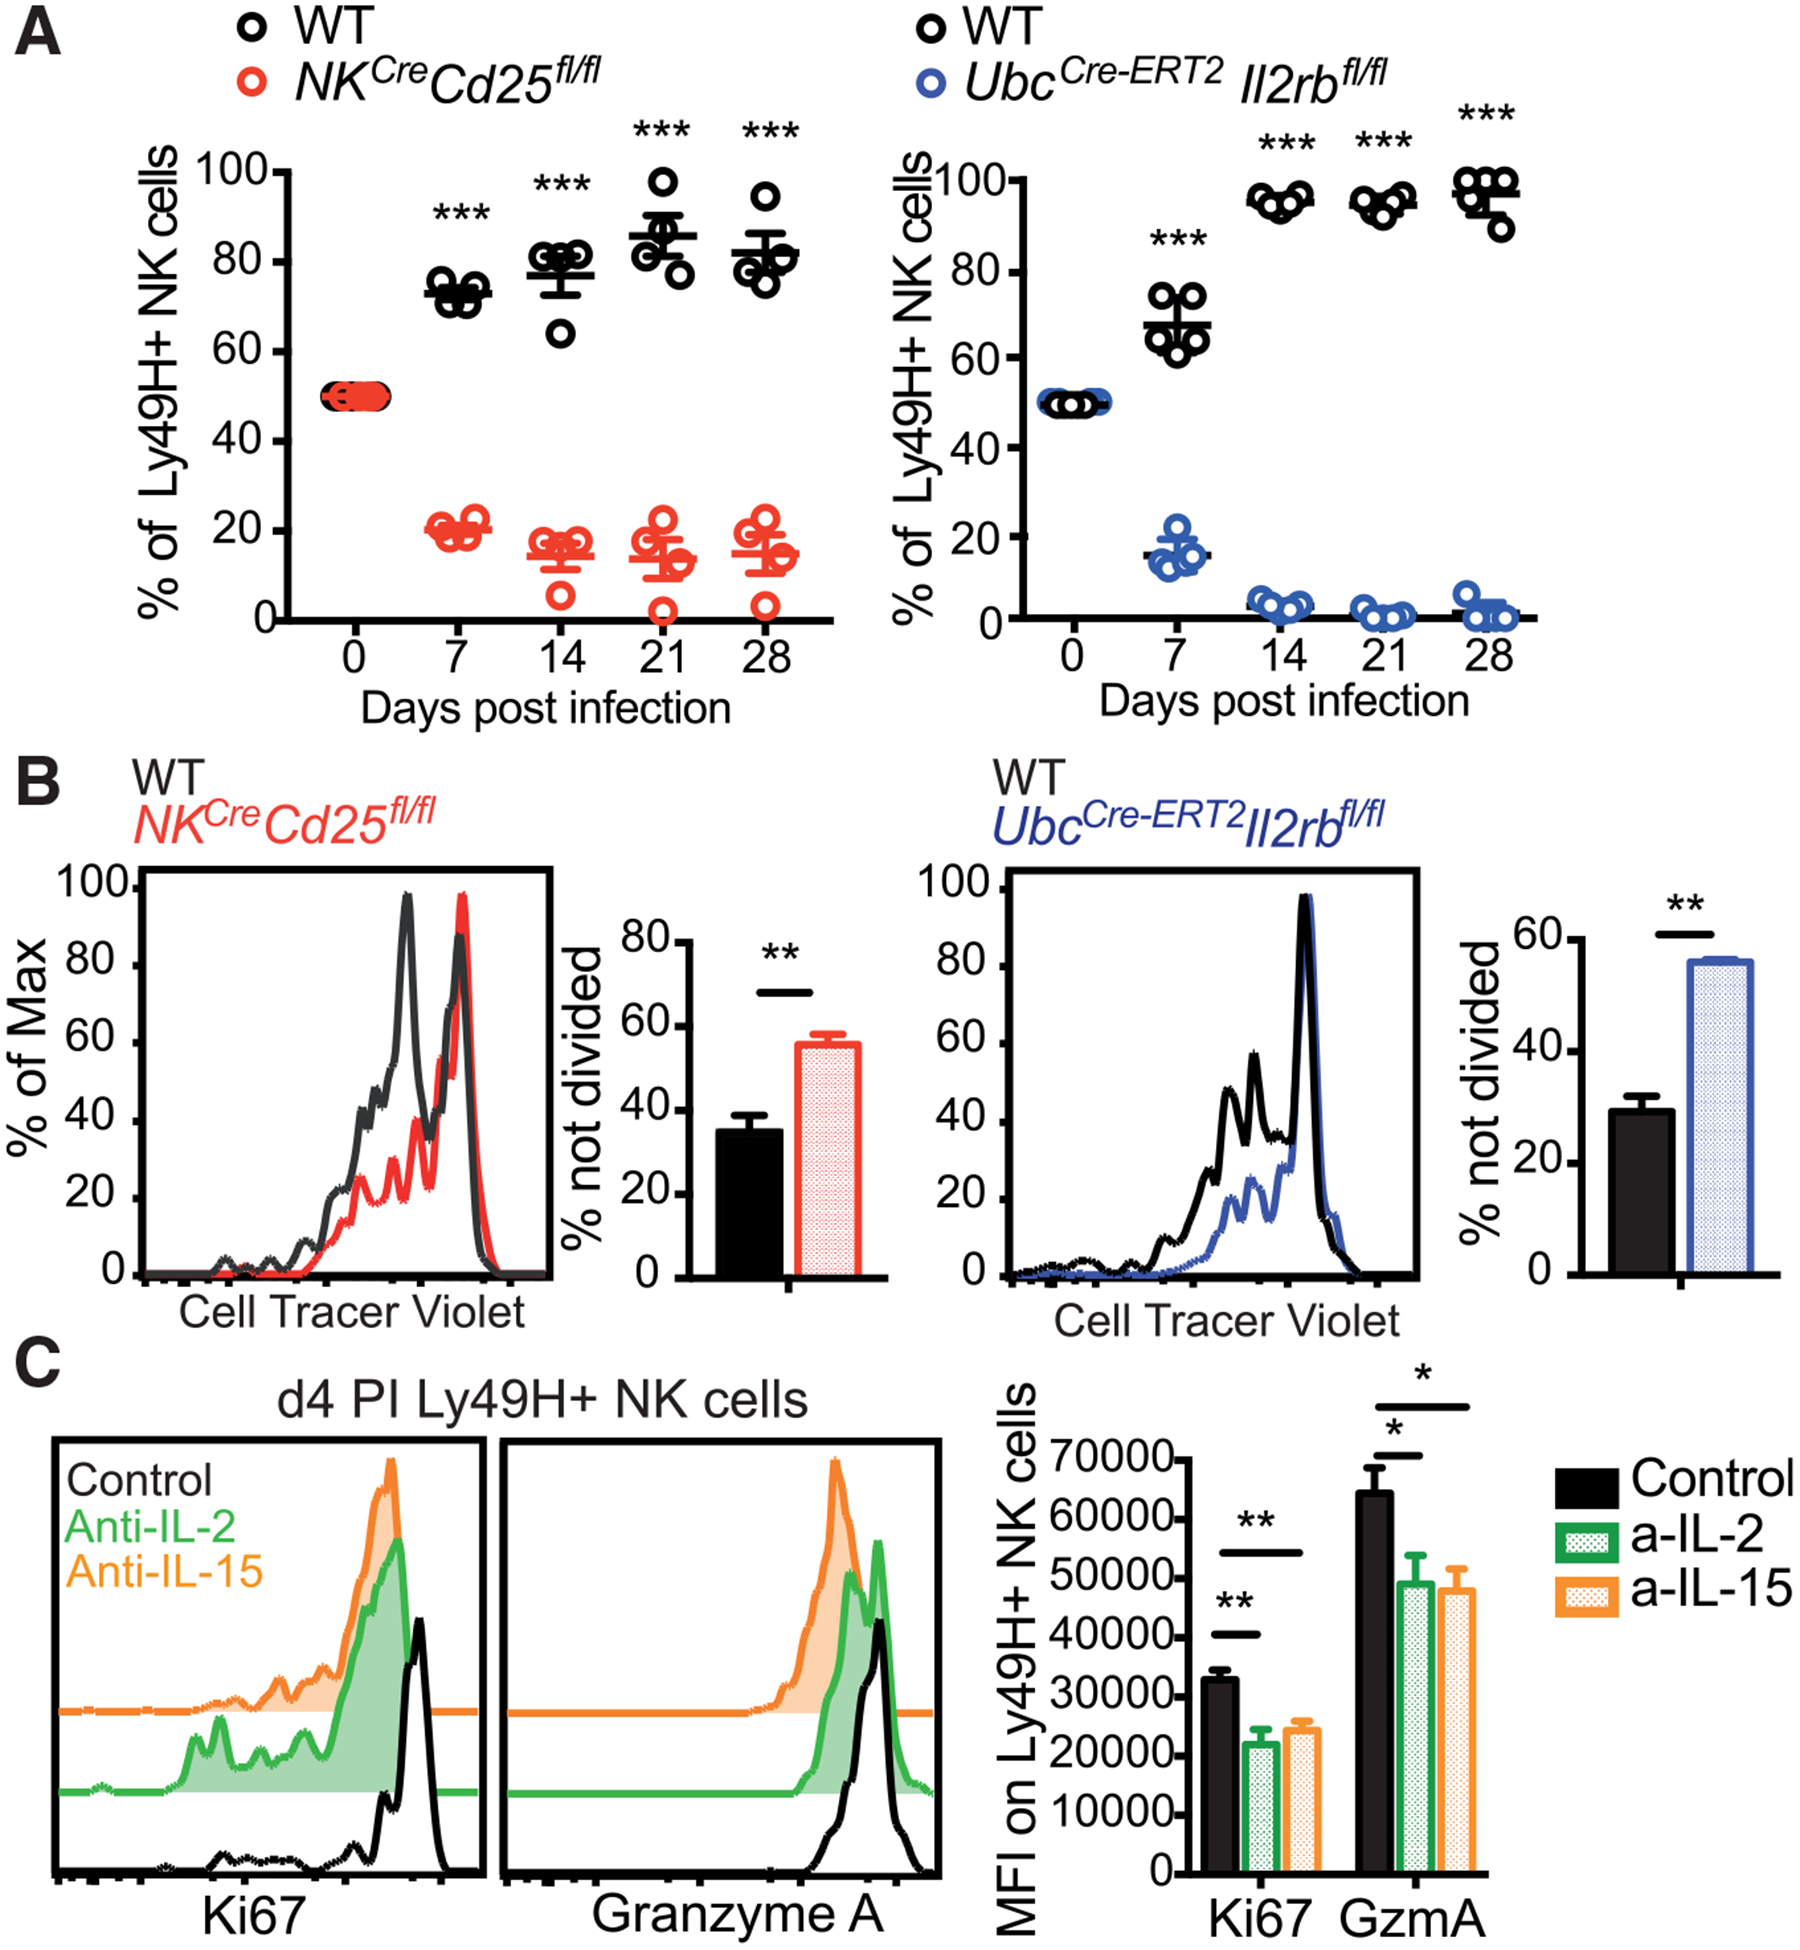
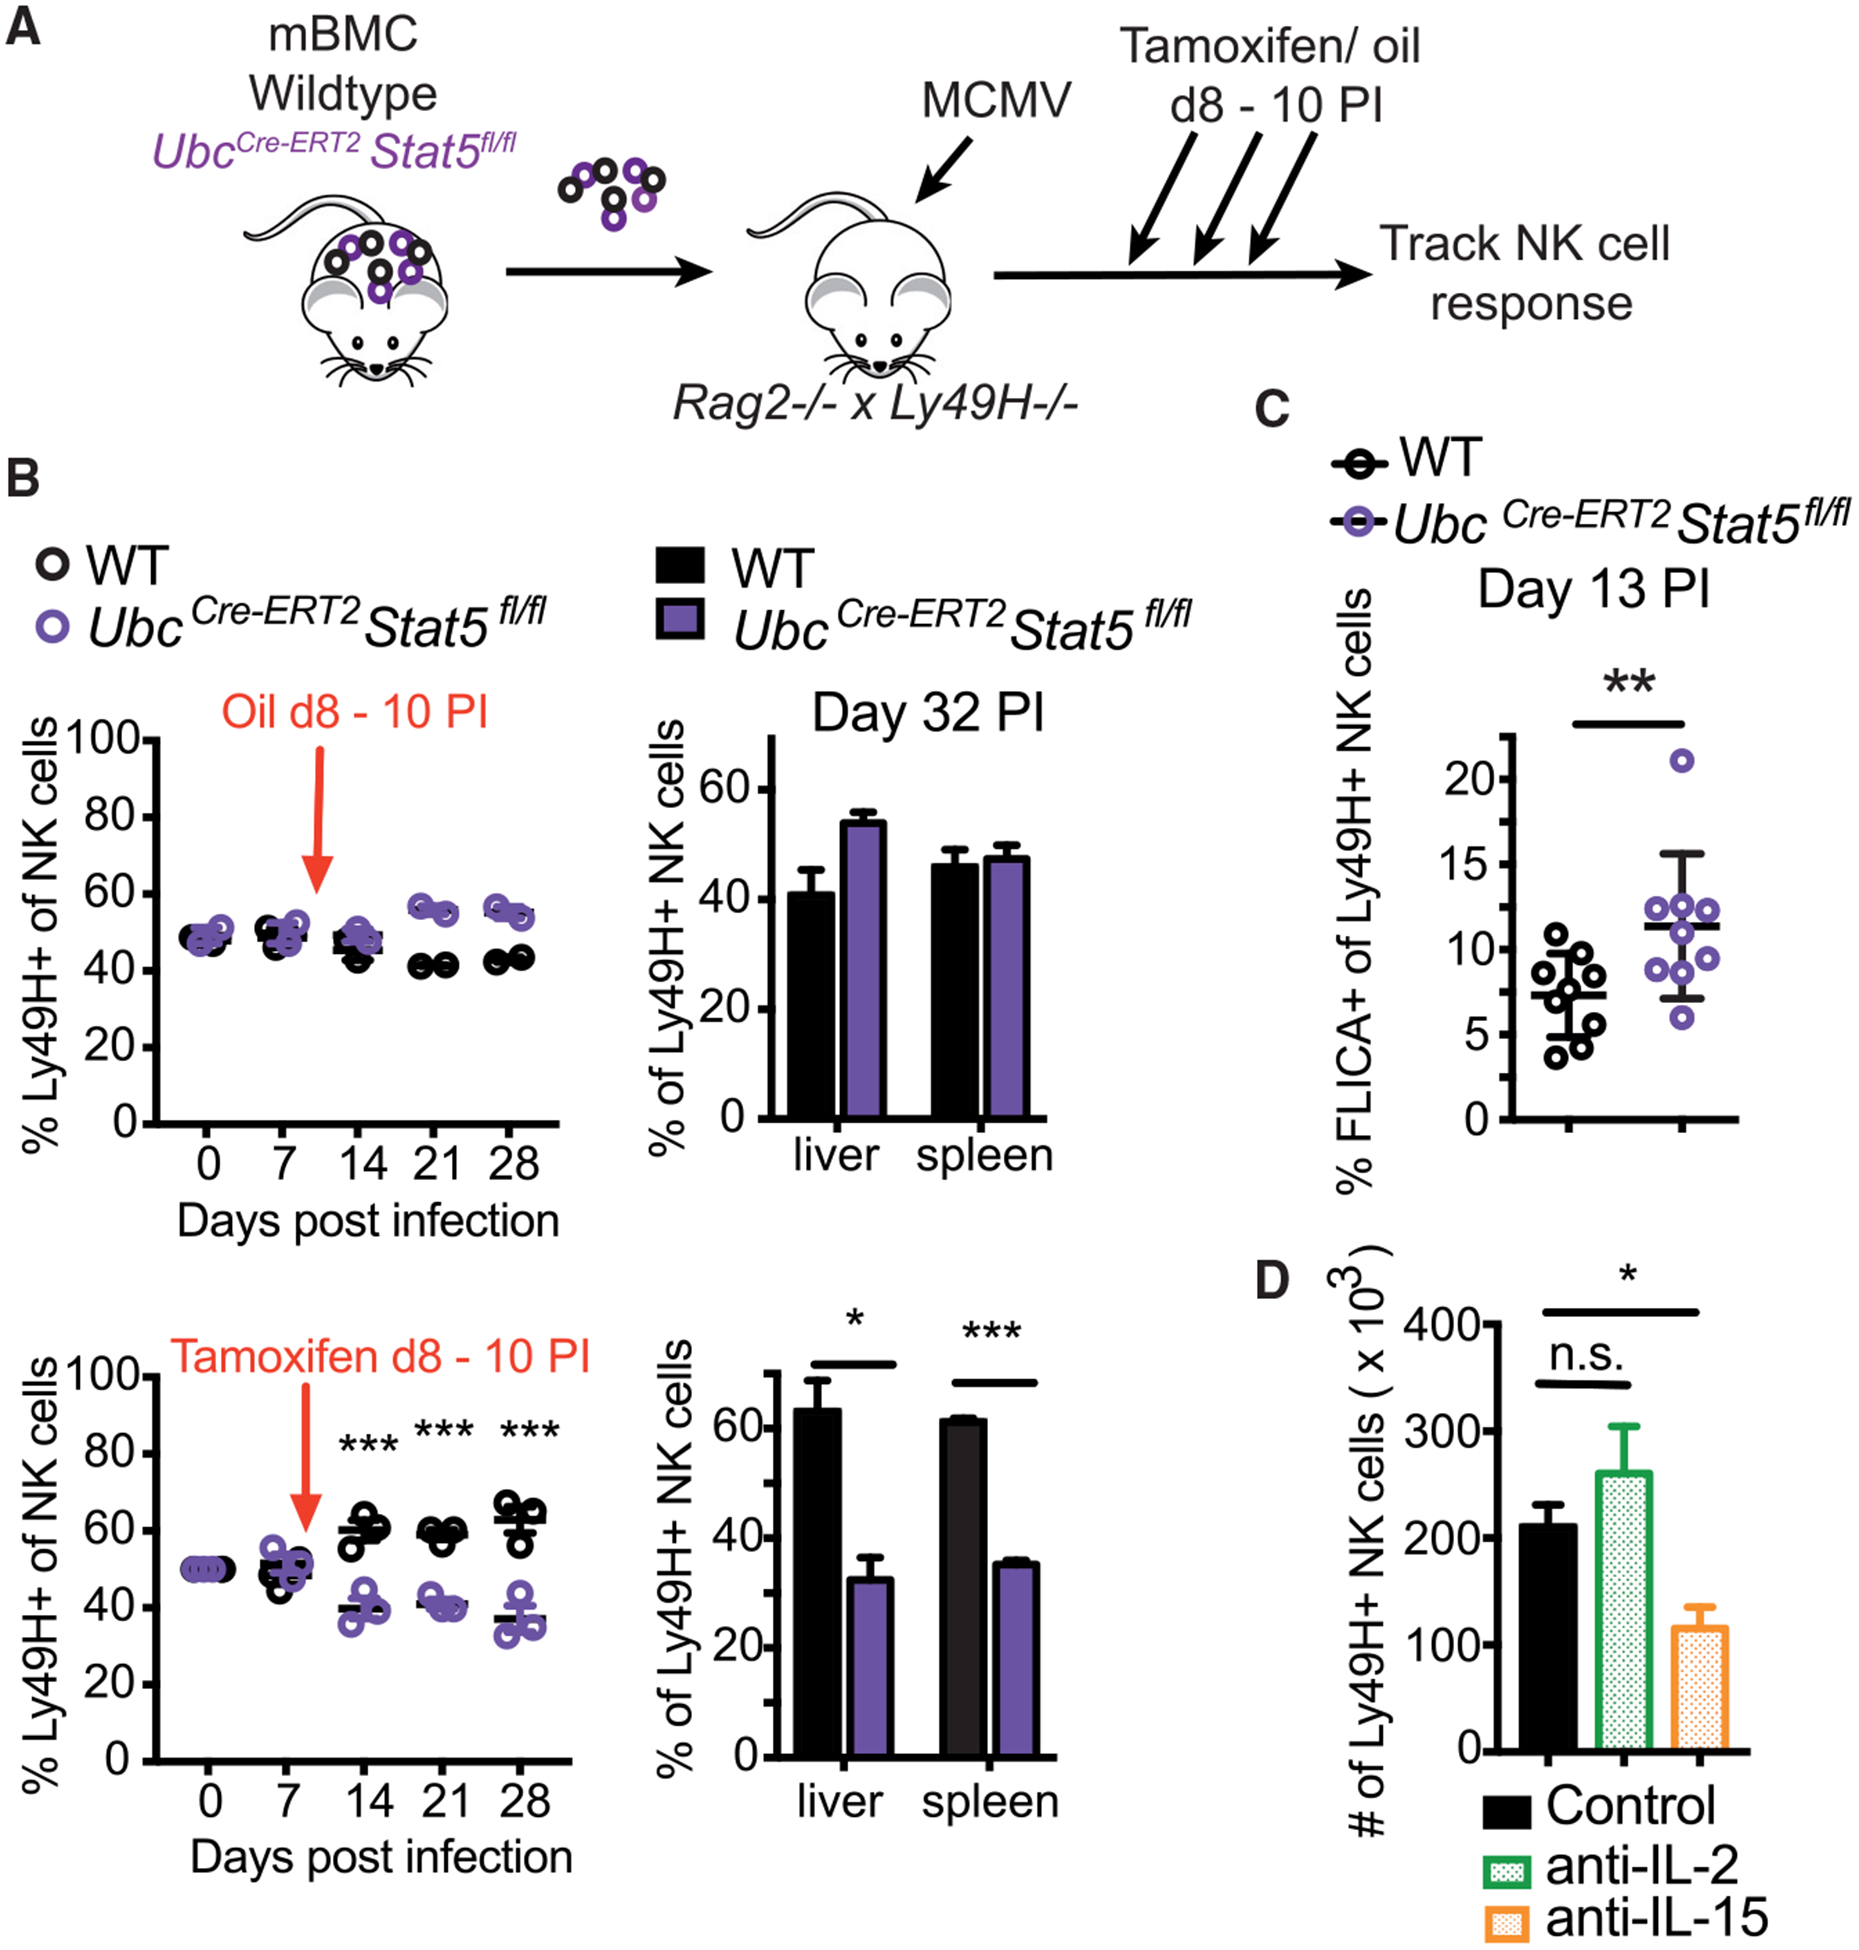
Natural killer (NK) cells are innate lymphocytes with the capacity to elicit adaptive features, including clonal expansion and immunological memory. Because signal transducer and activator of transcription 5 (STAT5) is essential for NK cell development, the roles of this transcription factor and its upstream cytokines interleukin-2 (IL-2) and IL-15 during infection have not been carefully investigated. In this study, we investigate how STAT5 regulates transcription during viral infection. We demonstrate that STAT5 is induced in NK cells by IL-12 and STAT4 early after infection and that partial STAT5 deficiency results in a defective capacity of NK cells to generate long-lived memory cells. Furthermore, we find a functional dichotomy of IL-2 and IL-15 signaling outputs during viral infection, whereby both cytokines drive clonal expansion, but only IL-15 is required for memory NK cell survival. We thus highlight a role for STAT5 signaling in promoting an optimal anti-viral NK cell response.

Keywords: IL-15; IL-2; MCMV; NK cell; STAT5; clonal expansion; memory.


Conflict of interest statement

Declaration of Interests The authors declare no competing interests.

Figures

Figure 1.
Figure 1.. IL-12- and STAT4-Dependent Induction of STAT5 in NK Cells during MCMV Infection
(A) RNA-seq was performed on Ly49H+ NK cells on days 0, 2, 4. 7, 14, and 35 of MCMV infection. Normalized counts of Stat5a and Stat5b are displayed. (B) RNA-seq on WT versus Il12rb2−/− or Stat4−/− from mixed BMC mice on day 2 PI. Normalized counts of Stat5a and Stat5b are displayed. (C) ChIP-seq was performed for STAT4 and H3K4me3 on WT and Stat4−/− NK cells cultured in media alone (unstim) or with IL-12 and IL-18. Representative gene tracks of mapped STAT4 ChIP (blue tracks) or H3K4me3 ChIP (black tracks) are displayed. (D) NK cells were cultured in media (unstim) or with IL-12 + IL-18, and RNA-seq was performed after 3 h of culture. Normalized counts of Stat5a and Stat5b are displayed. Error bars indicate SEM.
Figure 2.
Figure 2.. STAT5-Dependent Anti-viral NK Cell Response
(A) Stat5fl/fl, NKCre × Stat5fl/+, and NKCre × Stat5fl/fl mice were infected with high-dose MCMV. Viral titers in the serum were measured on day 4 PI. Data are representative of 2 independent experiments (n = 4–6). (B and C) Mixed WT:NKCre × Stat5fl/+ BMC mice were infected with MCMV. Ly49H+ WT or NKCre × Stat5fl/+ NK cells from spleen were analyzed on day 2 PI for granzyme A and B expression (B) or indicated activation/maturation markers (C). Data are representative of at least 2 independent experiments (n = 4). (D) RNA-seq was performed on Ly49H+ WT or NKCre × Stat5fl/+ NK cells at day 2 PI (n = 3). ChIP-seq was performed on NK cells stimulated with IL-2 and IL-15 for 3 h. Donut graph displays the proportion of DE genes (adjusted p value [padj] < 0.05) that are STAT5 bound (purple). Pie graph displays STAT5-bound DE genes (padj < 0.05) categorized by direction of gene expression. (E) Heatmap shows Z scores of all DE and STAT5-bound genes described in (D). (F) Representative gene tracks of mapped STAT5 ChIP. (G and H) Splenocytes from mixed WT:NKCre × Stat5fl/+ BMC mice were adoptively transferred into Rag2−/− × Ly49h−/− mice and infected with MCMV. (G) Graph shows the relative WT to NKCre × Stat5fl/+ NK cell percentages that were measured over the course of infection. (H) Bar graphs show percentage of memory Ly49H+ WT and NKCre × Stat5fl/+ NK cells in spleen and liver and KLRG1 surface expression (liver) on day 30 PI. Data are representative of 2 independent experiments (n = 3–4). All error bars indicate SEM.
Figure 3.
Figure 3.. Both IL-2 and IL-15 Drive NK Cell Expansion In Vivo
(A) Equal numbers of WT and UbcCre-ERT2 × Il2rbfl/fl or NKCre × CD25fl/fl NK cells were transferred into Ly49h−/− mice, followed by infection with MCMV. Donor UbcCre-ERT2 × Il2rbfl/fl mice were treated with tamoxifen on days −3, −2, and −1 prior to adoptive transfer. Following MCMV infection, relative percentages of Ly49H+ WT and KO NK cells are displayed (n = 4–5). (B) NK cells from WT mice, NKCre × CD25fl/fl mice, or UbcCre-ERT2 × Il2rbfl/fl mice treated with tamoxifen on days −3, −2, and −1 were labeled with CTV and transferred into Ly49h−/− mice, followed by infection with MCMV. Representative flow plots and graphs show amounts of undivided WT and KO NK cells from the liver at day 3 PI. (C) WT Ly49H+ NK cells were transferred into Ly49h−/− mice treated followed by infection with MCMV and treatment with PBS, anti-IL-2, or anti-IL-15 on days −1 to 4 PI. Flow plots and graph show amount of Ki67 and granzyme A on transferred Ly49H+ NK cells at day 4 PI. Data are pooled from 2 independent experiments (n = 4–5). All error bars indicate SEM.
Figure 4.
Figure 4.. IL-15 and STAT5 Are Required for the Survival of Memory NK Cells
(A–C) Splenic NK cells from WT:UbcCre-ERT2 × Stat5fl/fl mBMC mice were transferred into Rag2−/− × Ly49h−/− mice. Tamoxifen or oil (as a control) was administered on days 8 to 10 following MCMV infection. (B) Graphs show relative percentages of Ly49H+ WT and KO NK cells in the peripheral blood at indicated time points and in spleen and liver at day 32 PI. Data are representative of 2 independent experiments (n = 2–4). (C) Graph shows percentage of NK cells from spleen staining positive for FLICA on day 13 PI. Data are pooled from 2 independent experiments (n = 4–5). (D) WT Ly49H+ NK cells were transferred into Ly49h−/− mice infected with MCMV, and recipient mice were treated with PBS, anti-IL-2, or anti-IL-15 from days 8 to 18 PI. Graph shows the number of NK cells in the spleen on day 30 PI. Data are representative of 2 independent experiments (n = 4–5). All error bars indicate SEM.

References

    1. Adams NM, Geary CD, Santosa EK, Lumaquin D, Le Luduec J-B, Sot-tile R, van der Ploeg K, Hsu J, Whitlock BM, Jackson BT, et al. (2019). Cytomegalovirus Infection Drives Avidity Selection of Natural Killer Cells. Immunity 50, 1381–1390.e5. - PMC - PubMed
    1. Becker TC, Wherry EJ, Boone D, Murali-Krishna K, Antia R, Ma A, and Ahmed R (2002). Interleukin 15 is required for proliferative renewal of virus-specific memory CD8 T cells. J. Exp. Med 195, 1541–1548. - PMC - PubMed
    1. Bihl F, Pecheur J, Bréart B, Poupon G, Cazareth J, Julia V, Glaichenhaus N, and Braud VM (2010). Primed antigen-specific CD4+ T cells are required for NK cell activation in vivo upon Leishmania major infection. J. Immunol 185, 2174–2181. - PubMed
    1. Bolger AM, Lohse M, and Usadel B (2014). Trimmomatic: a flexible trimmer for Illumina sequence data. Bioinformatics 30, 2114–2120. - PMC - PubMed
    1. Chinen T, Kannan AK, Levine AG, Fan X, Klein U, Zheng Y, Gasteiger G, Feng Y, Fontenot JD, and Rudensky AY (2016). An essential role for the IL-2 receptor in Treg cell function. Nat. Immunol 17, 1322–1333. - PMC - PubMed

Publication types

Substances