. 2020 Dec 15;33(11):108491.
doi: 10.1016/j.celrep.2020.108491.

Endothelial Reprogramming by Disturbed Flow Revealed by Single-Cell RNA and Chromatin Accessibility Study

Affiliations

Endothelial Reprogramming by Disturbed Flow Revealed by Single-Cell RNA and Chromatin Accessibility Study

Aitor Andueza et al. Cell Rep. .

Abstract

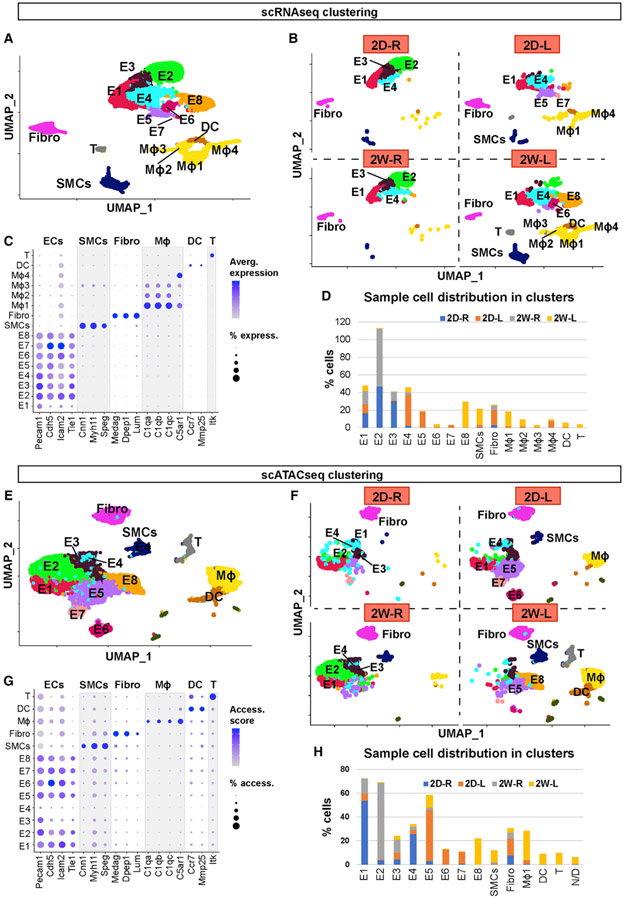
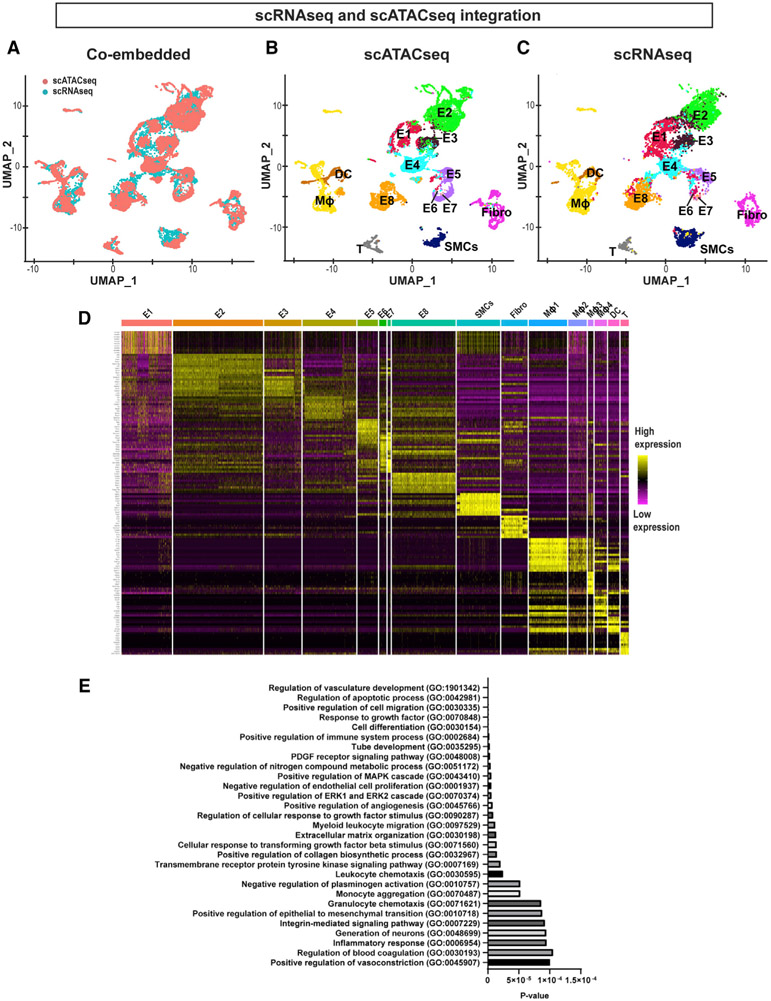
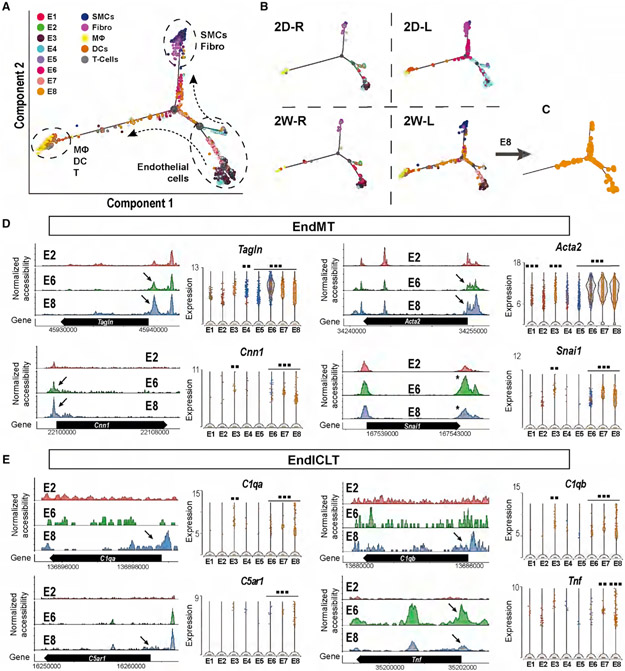
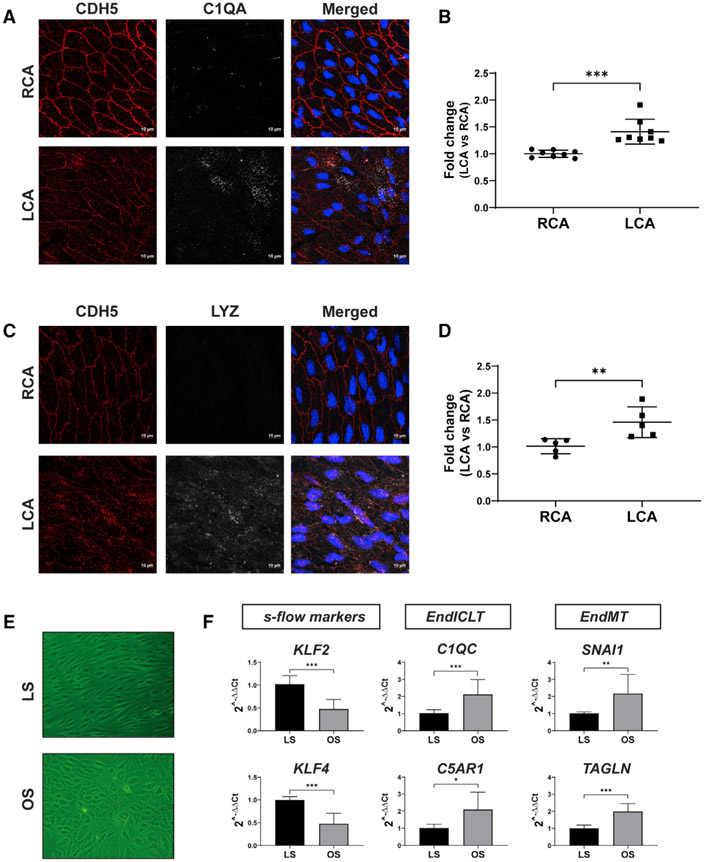
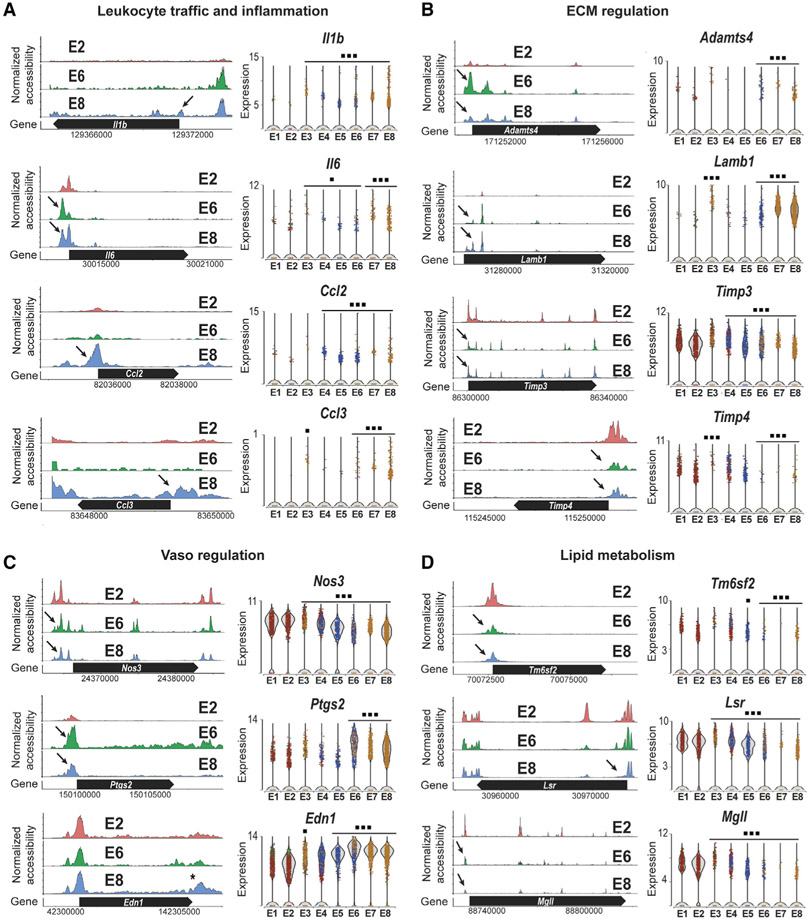
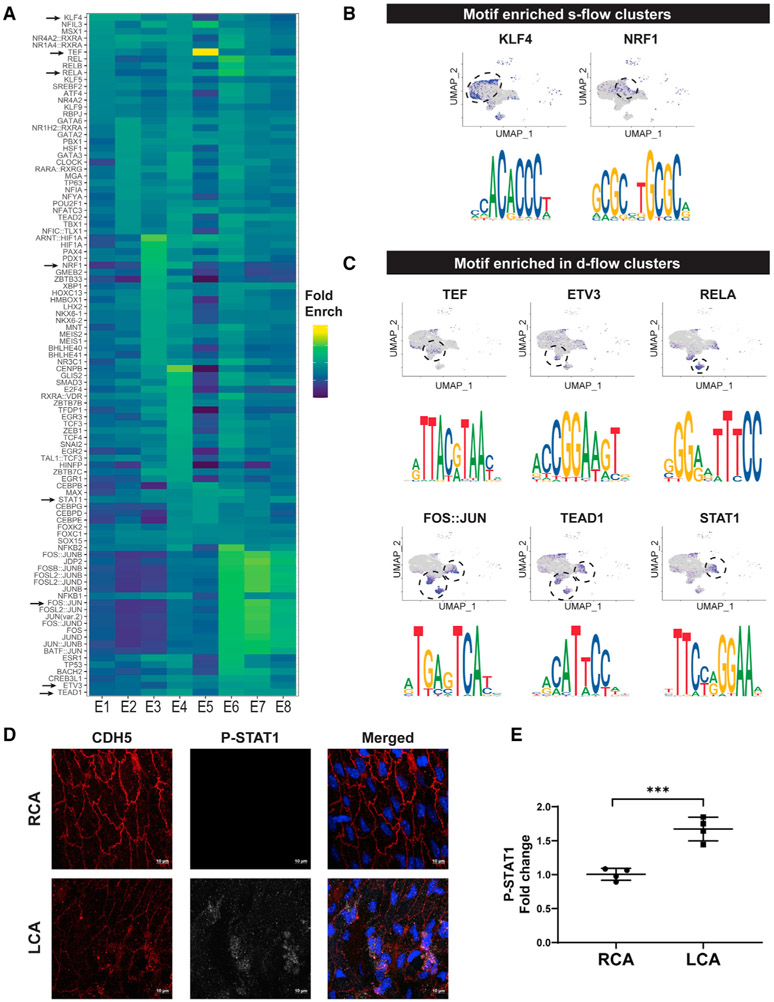
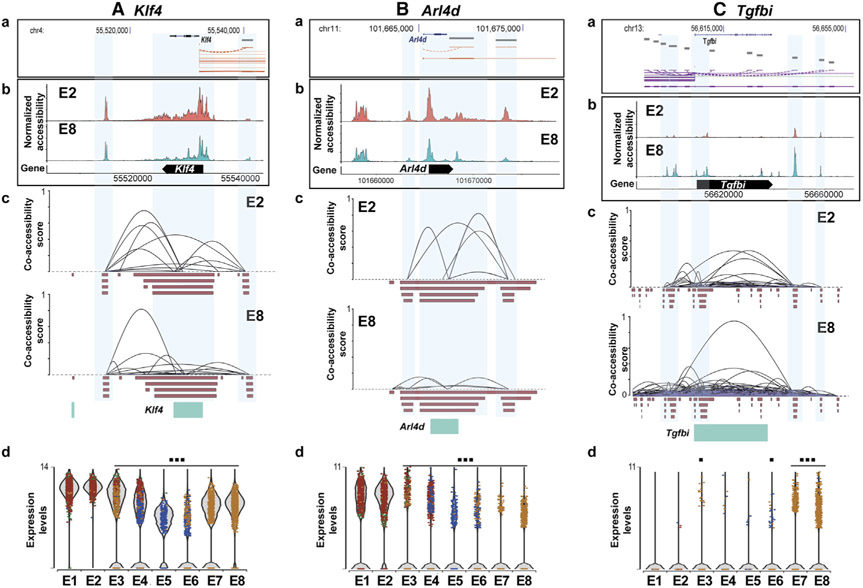
Disturbed flow (d-flow) induces atherosclerosis by regulating gene expression in endothelial cells (ECs). For further mechanistic understanding, we carried out a single-cell RNA sequencing (scRNA-seq) and scATAC-seq study using endothelial-enriched single cells from the left- and right carotid artery exposed to d-flow (LCA) and stable-flow (s-flow in RCA) using the mouse partial carotid ligation (PCL) model. We find eight EC clusters along with immune cells, fibroblasts, and smooth muscle cells. Analyses of marker genes, pathways, and pseudotime reveal that ECs are highly heterogeneous and plastic. D-flow induces a dramatic transition of ECs from atheroprotective phenotypes to pro-inflammatory cells, mesenchymal (EndMT) cells, hematopoietic stem cells, endothelial stem/progenitor cells, and an unexpected immune cell-like (EndICLT) phenotypes. While confirming KLF4/KLF2 as an s-flow-sensitive transcription factor binding site, we also find those sensitive to d-flow (RELA, AP1, STAT1, and TEAD1). D-flow reprograms ECs from atheroprotective to proatherogenic phenotypes, including EndMT and potentially EndICLT.

Keywords: atherosclerosis; blood flow; endothelial-to-immune cell-like transition; endothelial-to-mesenchymal transition; endothelium; flow-sensitive transcription factors; reprogramming; single-cell ATAC sequencing; single-cell RNA sequencing.


Conflict of interest statement

Declaration of Interests H.J. is the founder of FloKines Pharma.

Figures

Figure 1.
Figure 1.. scRNA-Seq and scATAC-Seq Clustering and Cell Identification
(A and B) scRNA-seq data plotted on a single UMAP representing 2D-R, 2D-L, 2W-R, and 2W-L. (A) UMAP represents all 4 samples, while (B) represents individual UMAP plots for each condition. Major cell populations include ECs (E1–8), SMCs, Fibro, macrophages, DCs, and T cells. (C) Dot plot shows the specific marker genes used to classify each cell cluster. The percentage of cells expressing respective transcripts correlate and their expression intensity are depicted by the dot size color intensity, respectively. (D) Graph shows the cell numbers in each cell cluster for 4 different experimental conditions. (E and F) scATAC-seq data plotted on a single UMAP representing 2D-R, 2D-L, 2W-R, and 2W-L to identify major cell populations. (E) Single UMAP identifies major cell populations, while (F) represents individual UMAP plots for each condition. (G) Dot plot shows the specific marker genes used to classify each cell cluster. The percentage of cells with open accessibility and the accessibility scores are depicted by the dot size and color intensity, respectively. (H) Graph shows the cell numbers in each cell cluster for 4 different experimental conditions.
Figure 2.
Figure 2.. Integration of scRNA-Seq and scATAC-Seq Datasets, and Differential Gene Expression and Pathway Analyses
(A) UMAP representation of the co-embedded scATAC-seq (red) and scRNA-seq (cyan) datasets. Cells from 2 assays were labeled with 2 colors as indicated in the plot. (B and C) Individual UMAP representation of the co-embedded scATAC-seq and scRNA-seq datasets. Annotations used for the scRNA-seq shown in Figure 1A were used and superimposed onto each cell cluster. (D) Heatmap represents the top 10 gene transcripts for each cell cluster identified from the scRNA-seq analysis. (E) Gene Ontology analysis was performed using the top 200 upregulated genes in E8 representing the d-flow phenotype in comparison to E2 representing the s-flow phenotype. The x axis shows the p value.
Figure 3.
Figure 3.. D-Flow Induced Endothelial-to-Mesenchymal Transition (EndMT) and Endothelial-to-Immune-like Cell Transition (EndICLT) as Shown by Pseudotime Trajectory and Accessibility Profile Analyses
(A and B) Pseudotime trajectory plot shows differentiated cell types (ECs, SMCs, Fibro, macrophages, DCs, and T cells) at the end of the branches. Dots along the trajectory lines represent the status of the cells transitioning toward differentiated cell types. (A) All cells pooled in 4 different conditions. (B) The cells split according to the time- and flow-dependent conditions. (C) Pseudotime Trajectory plot for E8. (D and E) The accessibility profiles of E1 and E2, representing ECs under s-flow and E8 representing ECs under d-flow from scATAC-seq data and violin plots showing the expression of corresponding genes from scRNA-seq data. Genes representing (D) and (E) EndICLT in the EC clusters are shown. Black arrows and * indicate accessibility changes in the promoter regions and 3’UTR, respectively. **p < 0.01 and ***p < 0.001.
Figure 4.
Figure 4.. D-Flow Induces Expression of Immune Cell Markers in ECs In Vivo and in Cultured ECs In Vitro
(A–D) Two weeks following PCL, the LCAs and RCAs were double-immunostained en face using antibodies for C1QA or LYZ along with the CDH5 antibody as the EC marker. Shown are confocal images for CDH5 (red), C1QA or LYZ (white), either individually or merged with nuclear DAPI (blue). The imaging intensity of each was quantified, and the data represent the mean ± SD (n = 8). **p < 0.01 and *** p < 0.001. Scale bars are shown in A and C. (E and F) HAECs exposed to chronic laminar shear (LS mimicking s-flow) or oscillatory shear (OS, mimicking d-flow) for 1 week were analyzed by qPCR to quantify expression of immune cell markers (C1QC, C5AR1), EndMT markers (SNAI1 and TAGLN), and the flow-sensitive gene markers (KLF2, KLF4). The data represent the mean ± SD (n = 3). *p < 0.05, **p < 0.01, and ***p < 0.001.
Figure 5.
Figure 5.. Chronic d-Flow Reprograms Endothelial Functions
The accessibility profiles of E1 and E2 (s-flow) and E8 (d-flow) from scATAC-seq data and violin plots showing the expression of corresponding genes from scRNA-seq data are shown. Genes representing (A) leukocyte traffic and inflammation and (B) ECM regulation, (C) vasoregulation, and (D) lipid metabolism in the EC clusters are shown. Black arrows indicate accessibility changes in the promoter region except for Edn1 (*). *p < 0.05 and ***p < 0.001.
Figure 6.
Figure 6.. D-Flow Alters Accessibility of Transcription Factors as Determined by Motif Enrichment Analysis and Induces STAT1 Phosphorylation in ECs In Vivo
(A and B) Heatmap shows the top overrepresented motifs enriched in each endothelial cluster. Fold enrichment of each motif is represented on a color scale, dark blue being the lowest score and yellow being the highest score. UMAP plot and the enriched motif sequences for overrepresented transcription factor binding motifs enriched in 2D-R and 2W-R (s-flow) (B), and 2D-L (acute d-flow) and 2W-L (chronic d-flow) conditions. (C) The blue dots on the UMAP plot represent the cells in which the motifs are overrepresented. (D and E) Two weeks following PCL, the LCAs and RCAs were double-immunostained en face using antibodies for CDH5 and phospho-STAT1. Shown are confocal images for CDH5 (red) and phospho-STAT1 (white), either individually or merged with nuclear DAPI (blue). Imaging intensity of each was quantified and the data (E) represents the mean ± SD (n = 4). ***p < 0.001. Scale bars are shown in D.
Figure 7.
Figure 7.. Chronic d-Flow Alters cis-Regulatory Interactions of Flow-Sensitive Genes
Bioinformatic analysis showing the regulatory elements of (A) Klf4, (B) Arl4d, and (C) Tgfbi genes. Gene structure and location of genes from ENCODE database (a) were mapped with normalized accessibility (b) and co-accessibility score plots (c) of E2 and E8 from our scATAC-seq dataset. Violin plots showing the expression of Klf4 and Arl4d in E1 to E8 from our scRNA-seq data (d). *p < 0.05 and ***p < 0.001.

References

    1. Ajami NE, Gupta S, Maurya MR, Nguyen P, Li JY, Shyy JY, Chen Z, Chien S, and Subramaniam S (2017). Systems biology analysis of longitudinal functional response of endothelial cells to shear stress. Proc. Natl. Acad. Sci. USA 114, 10990–10995. - PMC - PubMed
    1. Al-Soudi A, Kaaij MH, and Tas SW (2017). Endothelial cells: from innocent bystanders to active participants in immune responses. Autoimmun. Rev 16, 951–962. - PubMed
    1. Alberts-Grill N, Rezvan A, Son DJ, Qiu H, Kim CW, Kemp ML, Weyand CM, and Jo H (2012). Dynamic immune cell accumulation during flow-induced atherogenesis in mouse carotid artery: an expanded flow cytometry method. Arterioscler. Thromb. Vasc. Biol 32, 623–632. - PMC - PubMed
    1. Bondareva O, Tsaryk R, Bojovic V, Odenthal-Schnittler M, Siekmann AF, and Schnittler HJ (2019). Identification of atheroprone shear stress responsive regulatory elements in endothelial cells. Cardiovasc. Res 115, 1487–1499. - PubMed
    1. Brooks AR, Lelkes PI, and Rubanyi GM (2002). Gene expression profiling of human aortic endothelial cells exposed to disturbed flow and steady laminar flow. Physiol. Genomics 9, 27–41. - PubMed

Publication types

LinkOut - more resources