. 2021 Jan:146:103504.
doi: 10.1016/j.fgb.2020.103504. Epub 2020 Dec 14.

Asynchronous development of Zymoseptoria tritici infection in wheat

Affiliations

Asynchronous development of Zymoseptoria tritici infection in wheat

Elena Fantozzi et al. Fungal Genet Biol. 2021 Jan.

Abstract

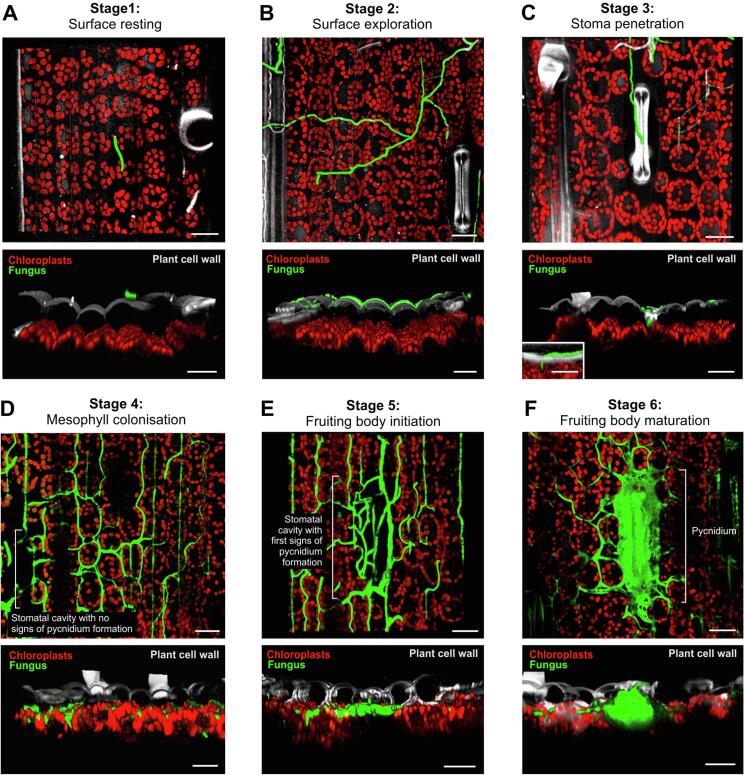
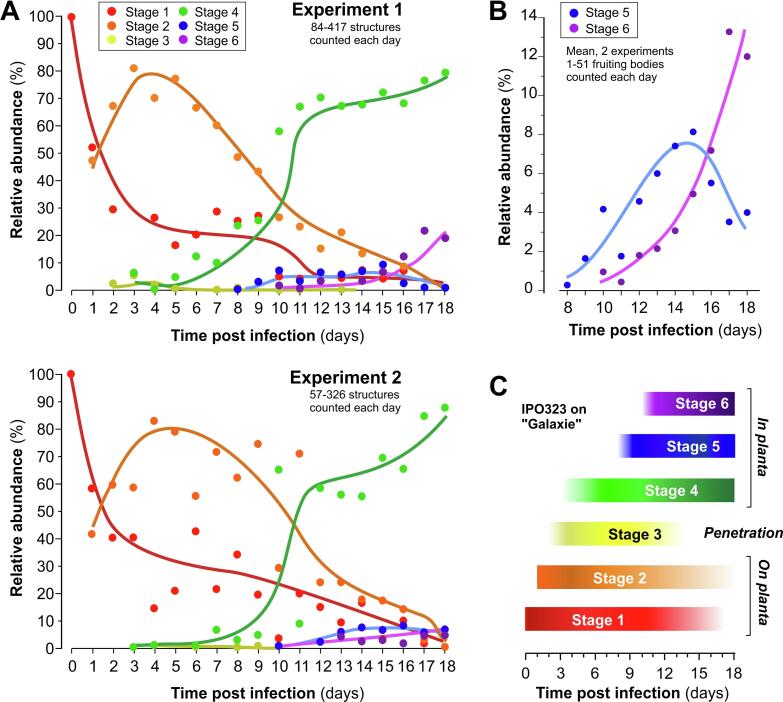
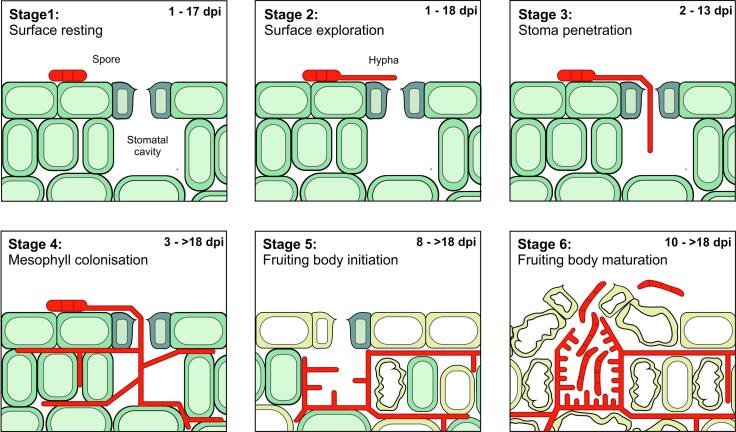
The fungus Zymoseptoria tritici causes Septoria tritici blotch of wheat. Pathogenicity begins with spore germination, followed by stomata invasion by hyphae, mesophyll colonization and fruiting body formation. It was previously found that entry into the plant via stomata occurs in a non-synchronized way over several days, while later developmental steps, such as early and late fruiting body formation, were reported to follow each other in time. This suggests synchronization of the pathogen population in planta prior to sporulation. Here, we image a fluorescent Z. tritici IPO323-derived strain during infection. We describe 6 morphologically distinct developmental stages, and determine their abundance in infected leaves, with time post inoculation. This demonstrates that 3-5 stages co-exist in infected tissues at any given time. Thus, later stages of pathogen development also occur asynchronously amongst the population of infecting cells. This merits consideration when interpreting transcriptomics or proteomics data gathered from infected plants.


Figures

Figure 1
Figure 1
Infection stages of Z. tritici in wheat. (A) Stage 1, “Surface resting”. A “yeast-like” spore lands on the leaf surface, where it can survive for several days. During this time, it can switch to stage 2 and invade the plant. Note that this stage can last for up to 12 days, during which hyphal growth can be initiated (Fones et al., 2017). Plant epidermis (grey) and chloroplasts (red) are detected by their auto-fluorescence. Fungal cells express cytoplasmic eGFP (green). Upper image shows top view and lower image shows side view of a confocal image stack. Scale bars represent 20 µm. See Video 1. (B) Stage 2, “Surface exploration”. Spores can switch and form an infectious hypha, which is thin and grows directed. These hyphae explore the surface and eventually enter the leaf via stoma (Stage 3). Plant epidermis (grey) and chloroplasts (red) are detected by their auto-fluorescence. Fungal cells express cytoplasmic eGFP (green). Upper image shows top view and lower image shows side view of a confocal image stack. Scale bars represent 20 µm. See Video 1. (C) Stage 3, “Stoma penetration”. Hyphae enter the host through stomatal apertures. Plant epidermis (grey) and chloroplasts (red) are detected by their auto-fluorescence. Fungal cells express cytoplasmic eGFP (green). Upper image shows top view and lower image shows side view of a confocal image stack. Scale bars represent 20 µm. See Video 1. (D) Stage 4, “Mesophyll colonization”. The fungus grows in the apoplastic space between the intact cells of the mesophyll. During this “biotrophic” phase, no obvious infection symptoms are visible. Plant epidermis (grey) and chloroplasts (red) are detected by their auto-fluorescence. Fungal cells express cytoplasmic eGFP (green). Upper image shows top view (no images covering the epidermis was included) and lower image shows side view of a confocal image stack. Scale bars represent 20 µm. See Video 1. (E) Stage 5, “Fruiting body initiation”. Hyphae grow into the cavity of virgin stomata and begin to fill this space with fungal material. This developmental step marks the onset of the nectrotrophic phase, recognized by first signs of leaf chlorosis. Plant epidermis (grey) and chloroplasts (red) are detected by their auto-fluorescence. Fungal cells express cytoplasmic eGFP (green). Upper image shows top view (no images covering the epidermis was included) and lower image shows side view of a confocal image stack. Scale bars represent 20 µm. See Video 1. (F) Stage 6, “Fruiting body maturation”. Hyphae have filled the substomatal cavity and the fruiting body (pycnidium) begins to produce spores. Their number of spores per pycnidium was estimated to be 300 (Fones & Gurr, 2015). Plant epidermis (grey) and chloroplasts (red) are detected by their auto-fluorescence. Fungal cells express cytoplasmic eGFP (green). Upper image shows top view (no images covering the epidermis was included) and lower image shows side view of a confocal image stack. Scale bars represent 20 µm. See Video 1.
Figure 2
Figure 2
Relative abundance of the 6 developmental stages of the Z. tritici strain IPO323_G on and in infected wheat leaves for up to 18 dpi. (A) Graph showing the relative abundance of fungal structures at different days after infection in two independent experiments. Bread wheat leaves were infected with the cytoplasmic eGFP-expressing strain IPO323_G and microscopic images were taken. The sum of all structures was set to 100%. Regression curves were added manually. See Supplementary Table 1 for primary data. (B) Graph showing the relative abundance of early and late fruiting bodies (Stage 5 and 6) at 8-18 dpi. Data taken from data sets in (A). Regression curves were added manually. (C) Simplified graphical representation of the quantitative data shown in Fig. 2A.
Figure 3
Figure 3
Overview of the timing of Z. tritici infection in wheat. The infection cycle can be described by a series of 6 stages. Individual hyphae go from one stage to the next, but as the population is not synchronized, up to 5 stages were found simultaneously in infected wheat leaves at a given time.

References

    1. Brennan C.J., Benbowa H.R., Mullinsband E., Doohan F.M. A review of the known unknowns in the early stages of septoria tritici blotch disease of wheat. Plant Pathol. 2019;68:1427–1438.
    1. Brunner P.C., Torriani S.F., Croll D., Stukenbrock E.H., McDonald B.A. Coevolution and life cycle specialization of plant cell wall degrading enzymes in a hemibiotrophic pathogen. Mol. Biol. Evol. 2013;30:1337–1347. - PMC - PubMed
    1. Chia M., van Werven F.J. Temporal expression of a master regulator drives synchronous sporulation in budding yeast. G3 (Bethesda) 2016;6:3553–3560. - PMC - PubMed
    1. Deller S., Hammond-Kosack K.E., Rudd J.J. The complex interactions between host immunity and non-biotrophic fungal pathogens of wheat leaves. J. Plant Phys. 2011;168:63–71. - PubMed
    1. Duncan K.E., Howard R.J. Cytological analysis of wheat infection by the leaf blotch pathogen Mycosphaerella graminicola. Mycol Res. 2000;104:1074–1082.

Publication types

MeSH terms

Supplementary concepts

LinkOut - more resources