. 2021 May;34(5):e4459.
doi: 10.1002/nbm.4459. Epub 2020 Dec 16.

Water and lipid suppression techniques for advanced 1 H MRS and MRSI of the human brain: Experts' consensus recommendations

Affiliations

Water and lipid suppression techniques for advanced 1 H MRS and MRSI of the human brain: Experts' consensus recommendations

Ivan Tkáč et al. NMR Biomed. 2021 May.

Abstract

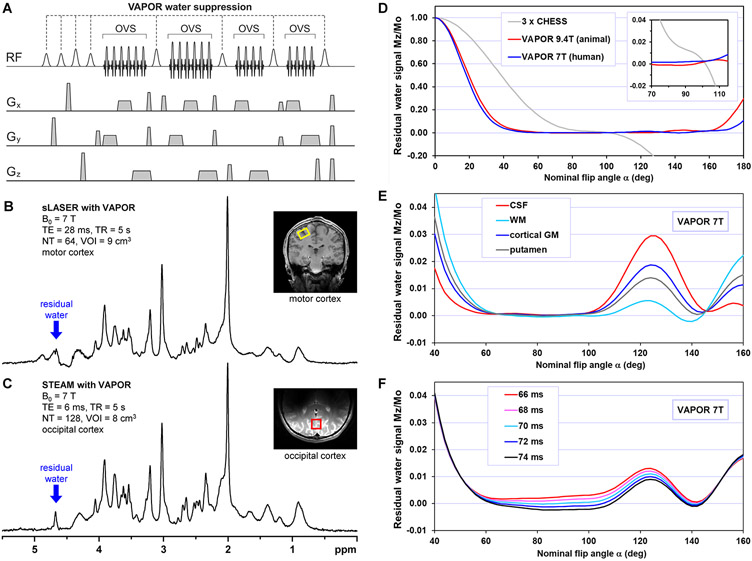
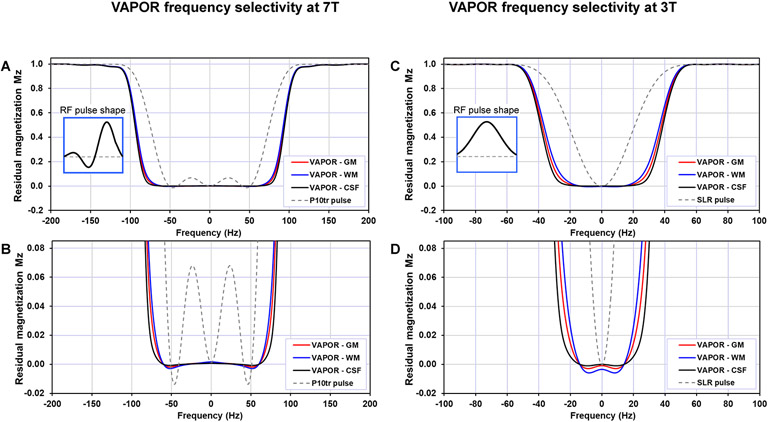
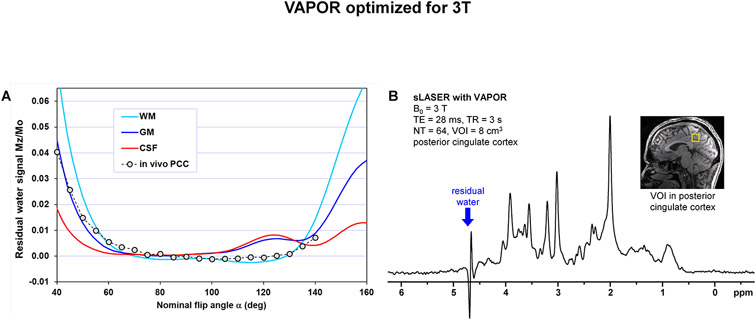
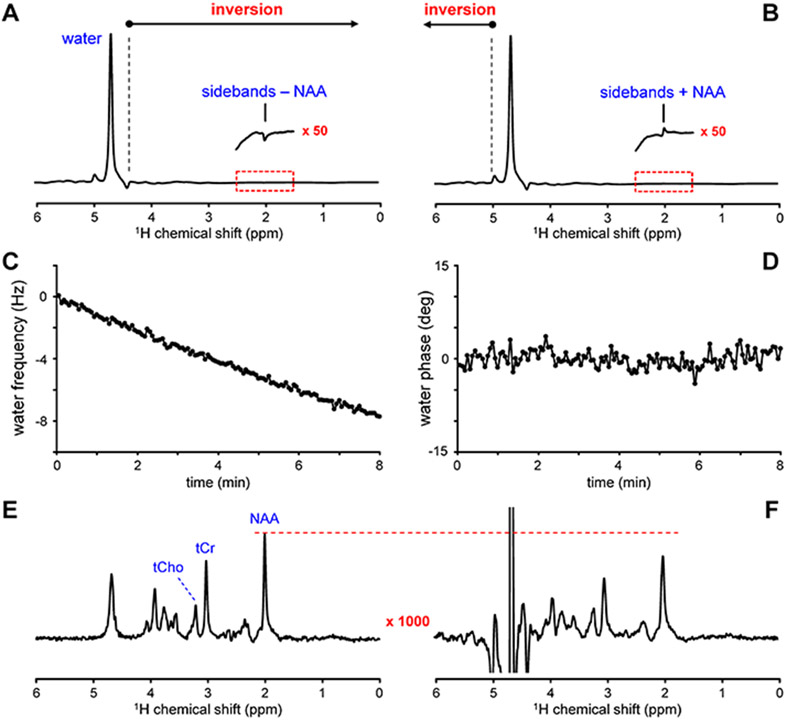
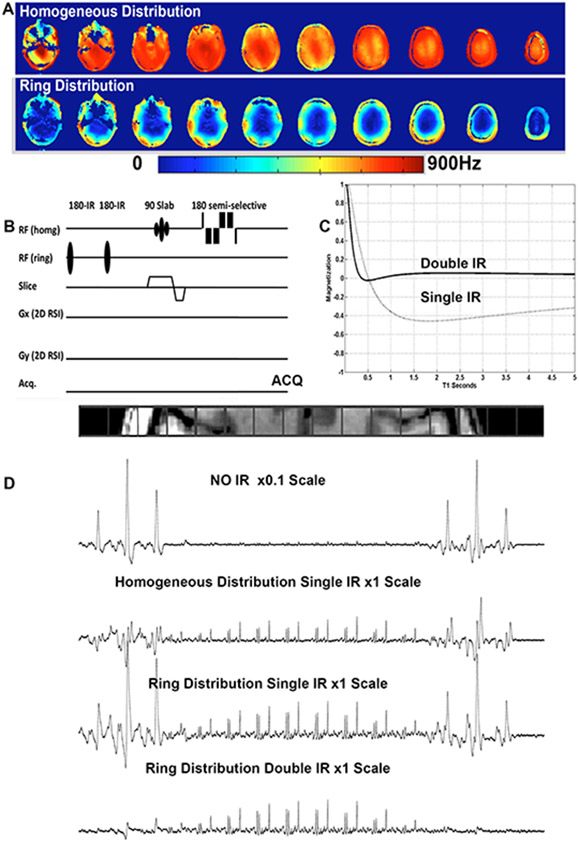
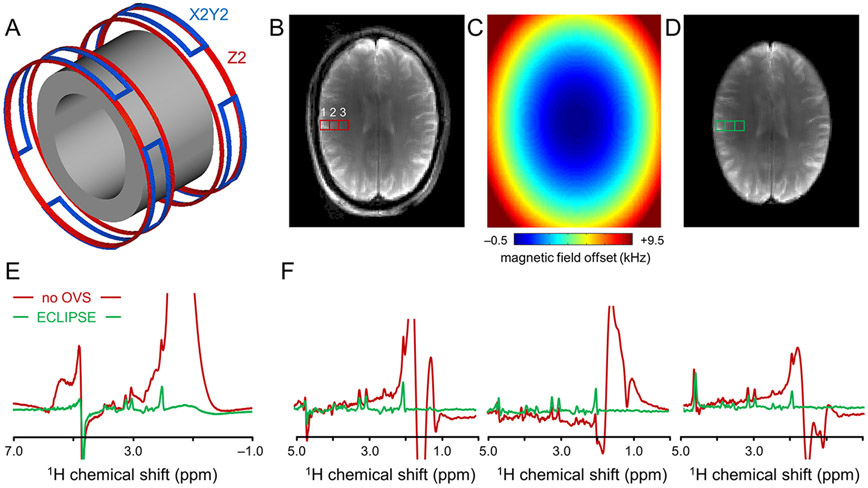
The neurochemical information provided by proton magnetic resonance spectroscopy (MRS) or MR spectroscopic imaging (MRSI) can be severely compromised if strong signals originating from brain water and extracranial lipids are not properly suppressed. The authors of this paper present an overview of advanced water/lipid-suppression techniques and describe their advantages and disadvantages. Moreover, they provide recommendations for choosing the most appropriate techniques for proper use. Methods of water signal handling are primarily focused on the VAPOR technique and on MRS without water suppression (metabolite cycling). The section on lipid-suppression methods in MRSI is divided into three parts. First, lipid-suppression techniques that can be implemented on most clinical MR scanners (volume preselection, outer-volume suppression, selective lipid suppression) are described. Second, lipid-suppression techniques utilizing the combination of k-space filtering, high spatial resolutions and lipid regularization are presented. Finally, three promising new lipid-suppression techniques, which require special hardware (a multi-channel transmit system for dynamic B1+ shimming, a dedicated second-order gradient system or an outer volume crusher coil) are introduced.

Keywords: ECLIPSE; L-regularization; VAPOR; crusher coils; dynamic B1 shimming; high spatial resolution; inversion recovery; metabolite cycling.


Figures

Figure 1.
Figure 1.
(A) VAPOR pulse sequence scheme with 4 interleaved OVS blocks. Relative flip angles of WS pulses: α – α – 1.78α – α – 1.59α – α – 1.78α – 1.78α, inter-pulse delays (in ms): 150 – 100 – 122 – 105 – 102 – 61 – 67 – 14 (delay between last VAPOR pulse and the first pulse of the localization sequence). (B,C) 1H MR spectra acquired by sLASER (TE = 28 ms, TR = 9 s, VOI = 9 mL, NA = 64) and STEAM (TE = 6 ms, TR = 5 s, NA = 128, VOI = 8 mL) localization methods combined with VAPOR water suppression using volume and half-volume RF coil, respectively. (D) Simulated dependence of the residual water signal on nominal flip angle α of VAPOR pulse train assuming T1 = 1500 ms. Data simulated for VAPOR WS method optimized for 9.4T animal MR scanner and for 7T human MR scanner,. In addition, the curve of the residual water simulated for 3 x CHESS pulse WS using inter-pulse delays (in ms) 50 – 50 – 20 was added for comparison. Inset: zoomed-in residual water signal dependence on nominal flip angle. (E) Simulated dependence of the residual water signal on nominal flip angle at 7T for tissues with different T1 relaxation times of water (CSF 4425 ms, WM 1220 ms, cortical GM 2132 ms, putamen 1700 ms). (F) Simulated dependence of the residual water signal on nominal flip angle for an average tissue T1 of 1500 ms at 7T for different inter-pulse delay between 7th and 8th WS pulse. Panel A modified with permission from Tkac et al. © 2010 Springer Nature 2005.
Figure 2.
Figure 2.
Frequency selectivity of VAPOR water suppression. (A) Frequency selectivity simulated for 7T version of VAPOR using truncated (3 lobe) P10 RF pulse (see the inset) of 25-ms duration. Nominal flip angle was set to 85 degrees. Residual Mz profile was calculated for GM (T1 = 1830 ms), WM (T1 = 1220 ms) and CSF (T1 = 4425 ms). In addition, the Mz profile of the truncated P10 pulse (90 deg) was included. (B) Zoomed-in Mz profile shown in panel A. (C) Frequency selectivity simulated for 3T version of VAPOR using a Shinnar – Le Roux (SLR) RF pulse of a 30-ms duration (see the inset). Nominal flip angle was set to 85 degrees. Residual Mz profile was calculated for GM (T1 = 1500 ms), WM (T1 = 840 ms) and CSF (T1 = 4000 ms) assessed from Rooney et al.. In addition, the Mz profile of the SLR 90 degree pulse was included. (D) Zoomed-in Mz profile shown in panel C.
Figure 3.
Figure 3.
(A) Dependence of the residual water magnetization on nominal flip angle for 3T version of VAPOR simulated for three brain compartments with different T1 relaxation times (WM T1 = 840 ms, GM T1 = 1500 ms, CSF T1 = 4000 ms). In addition, experimentally measured dependence of the residual water signal intensity on nominal flip angle was included (VAPOR-sLASER, TE = 28 ms, TR = 3 s, posterior cingulate cortex). Simulated and experimentally measured data are in good agreement. (B) Representative 1H MR spectrum acquired from the posterior cingulate cortex (VOI position shown in the inset) using VAPOR – sLASER sequence at 3 T (TE = 28 ms, TR = 3 s, NA = 64, 32-channel receive-only head array coil).
Figure 4.
Figure 4.
Principle of water suppression based on metabolite cycling (MC). (A, B) MC MRS is based on two scans during which the all signals in the spectrum range upfield (A) and downfield (B) from water are inverted without perturbing the water signal. In both non-water-suppressed scans, the gradient coil vibration-related sidebands associated with the water signal overwhelm the smaller metabolite signals (see inset with NAA signal). However, since the water signal and related sidebands are identical in both scans, they are suppressed in the difference spectrum (F) = (B) – (A). The water signal is incompletely suppressed and the metabolite signal are broadened due to significant magnetic field drift during the 8 min acquisition (NA = 128, TR = 4 s). The strong water signal present during every transient is ideally suited to determine the (C) frequency and (D) phase stability throughout the scan. (E) Post-acquisition frequency correction greatly improves the water suppression, while simultaneously increasing the spectral resolution. The sum of (A) and (B) provides the water signal, which can be used for a post-acquisition signal correction. Data were acquired from the human occipital cortex at 4 T using a macromolecule-nulled STEAM sequence (TE = 6 ms, TR = 4 s, TI = 200 ms, NA = 128, 16 mL).
Figure 5.
Figure 5.
Illustration of the benefit of using metabolite cycling instead of water suppression for the case of diffusion spectroscopy. sLASER spectra with two different diffusion weightings (top b = 40 s/mm2; bottom b = 4140 s/mm2) obtained from human occipital gray matter are plotted to demonstrate the effect of eddy current (i.e. time-varying phase) correction and amplitude (motion) compensation based on the co-acquired water signal. The spectra on the left include zero-order phasing of each acquisition (automatically performed by the scanner software), which is probably also somewhat more reliable for the non-water-suppressed signals than for water-suppressed acquisitions where water suppression efficiency may vary from scan to scan. As evident from comparison of the left-most and middle spectra, the effect of eddy-current correction is obviously larger for the high b-value spectrum, which is expected because larger gradient amplitudes lead to larger eddy currents – though this correction does not necessarily need a shot-by-shot correction. The right-most panel demonstrates the effect of an additional amplitude correction (motion-compensation, see text) based on the water signal where each single acquisition is scaled to the expected size (taken from the top quartile of all acquisitions) or discarded if quality criteria are not fulfilled. Again, it is evident that this correction is considerably larger for the high b-value, effectively mitigating motion-induced signal loss that is increasing with gradient amplitude and corresponding bias in the obtained apparent diffusion coefficient (ADC) values. Thus, a systematic overestimation of diffusion coefficients of metabolites can be avoided by using diffusion MRS with MC. Acquisition parameters: VOI = 28 cm3, healthy female (26 years), a pair of pulsed diffusion gradients placed before and after the last adiabatic slice selection gradient, diffusion gradient length = 11.5 ms, ramp time = 200 μs, diffusion time = 155 ms, diffusion gradient amplitudes of 3 mT/m (b = 40 s/mm2) and 30.7mT/m (b = 4140 s/mm2) on each axis, TE = 200 ms, TR = 3 s, 3T Prisma (Siemens), phased-array receive head coil, number of averages 16 for low and 64 for the high b-value scans). Figure courtesy of André Döring, University Bern, using data recorded in the context of reference.
Figure 6.
Figure 6.
Outer-volume suppression (OVS) pulses used for lipid suppression in whole-head 1H MRSI.
Figure 7.
Figure 7.
Whole-head 1H MRSI at 3 T using inversion recovery for lipid suppression in combination with a spectral-spatial spiral acquisition. (A) pulse sequence diagram, (B) metabolite maps, and (C) a representative spectrum. Parameters: TR = 2 s, TI = 180 ms, TE = 144 ms, nominal voxel size = 1.2 cm3, total acquisition time = 3.6 min.
Figure 8.
Figure 8.
(A) 1H-FID-MRSI spectra from larger voxel size (red voxels, 11 x 11 x 8 mm3) and smaller voxel size (yellow voxels, 3.4 x 3.4 x 8 mm3) acquired from one volunteer (Vol 2 in B) showing lipid contamination (grey band). Shown are data where no lipid handling was applied, lipid regularization was applied, Hamming filter was applied and both lipid regularization and Hamming filter was applied. Note: Spectra from white voxels are not plotted. The data sets with 11×11 mm2 resolutions were obtained by down-sampling the MRSI data and applying an elliptical filter in k-space in post-processing to simulate accurately how such data would be measured. First order phase error is caused by the acquisition delay of the FID-sequence. (B) tNAA maps of two volunteers for different resolutions, filters, and lipid regularizations (top two rows), together with the corresponding theoretical point spread functions (PSF) in logarithmic scale (lower row). The PSFs are plotted relative to the peak height at the center in dB, for an FOV of 220x220 mm2. Since the main tNAA peak is close to the lipids, the tNAA maps are good indicators for lipid contamination. If no spatial filter is applied, the PSF shows strong signal spread over the whole FOV, which is reflected in a substantial lipid contamination (A, no lipid handling). Quantification of tNAA may be affected by the huge lipid peaks, which is often manifested as “hotspots” in metabolic maps or areas that were not quantified (I and III). Lipid regularization may not always completely eliminate the lipid signals, especially at lower resolution (A, Lip.Reg.; B-I and B-III). Hamming filtering reduces the strong signal spread, thus improving the spectra in the centre of the brain, however the periphery, also due to larger nominal voxel size still suffers from lipid contamination (A, Hamm. filter) and inaccurate tNAA quantification (lower tNAA at the border of the brain in B-II). Using high resolutions recovers big parts of the tNAA maps at the brain edge (B-IV). In case of strong lipid contamination (i.e. - if lipid signals originate from other sources than the theoretical PSF), additional lipid regularization can help to reduce these artifacts, which often appear as random hotspots in the tNAA map (A, Hamm. & Lip.Reg.; B-IV, vol 2).
Figure 9.
Figure 9.
(A) B1+ for the homogeneous and ring distributions using a double row transceiver array. (B) MRSI sequence using the two B1+ distributions and a double inversion recovery preparation for suppression of extracerebral signals. (C) Plot of the equilibrium magnetization following a single (dashed line TIR/TR 350/3000ms) and double (solid line, TIR1/TIR2/TR 600/180/1500ms) inversion recovery preparation as a function of T1. (D) in vivo results showing 1H MR spectra spanning the head (left to right) acquired after 2D phase encoding: without any outer volume suppression, with a non-spatially selective IR, with a single or double spatially selective (ring distribution) IR. Panel C and D modified with permission from Hetherington et al. © 2010 Wiley.
Figure 10.
Figure 10.
Principle of ECLIPSE lipid suppression. (A) A human head-sized RF coil (gray former) is closely fitted with copper coils that generate Z2 (red), X2Y2 (blue) and possibly other magnetic field distributions. (B) MR image obtained without ECLIPSE. (C) Magnetic field distribution that closely fits the human brain for magnetic field offsets between −0.5 and +2.7 kHz. (D) MR image with ECLIPSE showing the elimination of all extracranial signal with a magnetic field offset greater than +2.66 kHz. (E) Water-suppressed 1H MR spectra acquired from the entire slice in the absence (red) and presence (green) of ECLIPSE. (F) Water-suppressed 1H MR spectra extracted from a 21 x 21 MRSI dataset (1 cm3 nominal resolution) at the positions indicated in (B, D).

References

    1. Oz G, Alger JR, Barker PB, et al. Clinical proton MR spectroscopy in central nervous system disorders. Radiology. 2014;270(3):658–679. - PMC - PubMed
    1. Wilson M, Andronesi O, Barker PB, et al. Methodological consensus on clinical proton MRS of the brain: Review and recommendations. Magn Reson Med. 2019;82(2):527–550. - PMC - PubMed
    1. Cudalbu C Contribution of macromolecules to brain 1H MR spectra: Experts' consensus recommendations. NMR Biomed. 2021;34(5):e4393. - PMC - PubMed
    1. McIntyre DJ, Charlton RA, Markus HS, Howe FA. Long and short echo time proton magnetic resonance spectroscopic imaging of the healthy aging brain. J Magn Reson Imaging. 2007;26(6):1596–1606. - PubMed
    1. Delikatny EJ, Chawla S, Leung DJ, Poptani H. MR-visible lipids and the tumor microenvironment. NMR Biomed. 2011;24(6):592–611. - PMC - PubMed

Publication types