Review
. 2020 Dec 14;21(24):9502.
doi: 10.3390/ijms21249502.

Albanol B from Mulberries Exerts Anti-Cancer Effect through Mitochondria ROS Production in Lung Cancer Cells and Suppresses In Vivo Tumor Growth

Affiliations
Review

Albanol B from Mulberries Exerts Anti-Cancer Effect through Mitochondria ROS Production in Lung Cancer Cells and Suppresses In Vivo Tumor Growth

Thanh Nam Phan et al. Int J Mol Sci. .

Abstract

Albanol B (ABN-B), an arylbenzofuran derivative isolated from mulberries, has been shown to have anti-Alzheimer's disease, anti-bacterial and antioxidant activities. The aim of this study was to investigate the anti-cancer effect of this compound against lung cancer cells. The results show that ABN-B inhibited the proliferation of four human lung cancer cell lines (A549, BZR, H1975, and H226) and induced apoptosis, based on the cleavage of caspase-7 and PARP (poly (ADP-ribose) polymerase), as well as the downregulation of Bcl-2. ABN-B also induced cell cycle arrest at G2/M by down-regulating the expression of CKD1 (cyclin-dependent kinase 1) and cyclin B1, but up-regulating p21 (cyclin-dependent kinase inhibitor 1) expression. Notably, ABN-B increased the production of mitochondrial reactive oxygen species (ROS); however, treatment with mito-TEMPO (a specific mitochondrial antioxidant) blocked ABN-B-induced cell cycle arrest at G2/M and apoptosis, as well as the up-regulation of p21 and down-regulation of CDK1 and cyclin B1 induced by ABN-B. At the molecular level, ABN-B-induced mitochondrial ROS production increased the phosphorylation levels of AKT (protein kinase B) and ERK1/2 (extracellular signal-regulated kinase 1/2), while the inhibition of these kinases blocked the ABN-B-induced up-regulation of p21 and down-regulation of CDK1 and cyclin B1. Moreover, ABN-B significantly suppressed tumor growth in Ex-3LL (Lewis lung carcinoma) tumor-bearing mice. Taken together, these results suggest that ABN-B can exert an anti-cancer effect by inducing apoptosis and cell cycle arrest at G2/M through mitochondrial ROS production in lung cancer cells.

Keywords: Albanol B; apoptosis; cell cycle arrest; lung cancer; mitochondrial reactive oxygen species.


Conflict of interest statement

The authors declare no conflict of interest.

Figures

Figure 1
Figure 1
ABN-B inhibited the proliferation of human lung cancer cell lines. (A,B) A549, BZR, H1975 and H226 cells were treated with the indicated concentrations of ABN-B for 24 h (A) or 48 h (B). Cells viability was assessed by MTT assay. Data are presented as the mean ± SEM (* p < 0.05 and * p < 0.01 compared with vehicle-treated control; n = 3). (C) A549 and NCI-H1975 cells were treated with the indicated concentrations of ABN-B for 24 h and BrdU incorporation was determined. Data are the mean ± SEM (* p < 0.05 and ** p < 0.01 compared with vehicle-treated control; n = 3). (D) Colony formation assay of A549 and NCI-H1299 cells was performed in the presence of the indicated concentrations of ABN-B for 6 days. The number of colonies was determined. Data are the mean ± SEM (* p < 0.05 and ** p < 0.01 compared with vehicle-treated control; n = 3).
Figure 2
Figure 2
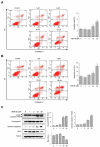
ABN-B induced cell cycle arrest at G2/M in A549 and H1975 cells. (A,B) A549 (A) and H1975 (B) cells were treated with the indicated concentrations of ABN-B for 48 h, and subsequently stained with PI, followed by analysis using a flow cytometry. Data are expressed as the mean ± SEM of three independent experiments (* p < 0.01 compared with vehicle-treated control). (C) A549 cells were treated with the indicated concentrations of ABN-B for 48 h. Subsequently, whole cell lysates were prepared, and performed Western blot analysis with the indicated antibodies. Graphs representing densitometry analyses (* p < 0.01 compared with vehicle treated control, n = 3). (D) A549 cells were treated with ABN-B (30 µM) for the indicated periods of time. Subsequently, whole cell lysates were prepared, and performed Western blot analysis with the indicated antibodies. Graphs represent densitometry analyses (* p < 0.01 compared with vehicle treated control, n = 3).
Figure 3
Figure 3
ABN-B induced apoptosis in A549 cells. (A,B) A549 cells were treated with the indicated concentrations of ABN-B for 24 h (A) or 48 h (B), subsequently stained with annexin V-FITC and PI, followed by analysis using a flow cytometry. Data represent the percentage of both early and late apoptotic cells and are expressed as the mean ± SEM of three independent experiments (* p < 0.01 compared with vehicle-treated control). (C) A549 cells were treated with indicated concentrations of ABN-B for 48 h. Subsequently, whole cell lysates were prepared, and we performed Western blot analysis with the indicated antibodies. Graphs represent densitometry analyses (* p < 0.01 compared with vehicle treated control, n = 3).
Figure 4
Figure 4
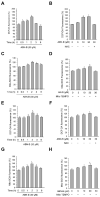
ABN-B induced ROS production in A549 and H1975 cells. (A,E) A549 (A) and NCI-H1975 (E) cells were treated with ABN-B (30 μM) for the indicated periods of time. DCF-DA was used to assess intracellular ROS generation and DCF-DA fluorescence was measured by flow cytometry. Data are mean ± SEM (* p < 0.01 compared with vehicle treated control, n = 3). (B,F) A549 (B) and NCI-H1975 (E) cells were treated with the indicated concentrations of ABN-B for 2 h with or without NAC (100 μM). DCF-DA fluorescence was measured by flow cytometry. Data are mean ± SEM (* p < 0.01 compared with vehicle treated control, n = 3). (C,G) A549 (C) and NCI-H1975 (G) cells were treated with ABN-B (30 μM) for the indicated periods of time. Mito-SOX was used to assess mitochondrial ROS generation and Mito-SOX fluorescence was measured by flow cytometry. Data are mean ± SEM (* p < 0.01 compared with vehicle treated control, n = 3). (D,H) A549 (D) and NCI-H1975 (H) cells were treated with the indicated concentrations of ABN-B for 2 h with or without Mito-TEMPO (50 μM). Mito-SOX fluorescence was measured by flow cytometry. Data are mean ± SEM (* p < 0.01 compared with vehicle treated control, n = 3).
Figure 5
Figure 5
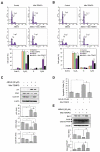
Mito-TEMPO attenuated cell cycle arrest at G2/M and apoptosis induced by ABN-B (A,B) A549 (A) and NCI-H1975 (B) cells were treated with of ABN-B (30 µM) with or without mito-TEMPO (50 µM) for 48 h, subsequently stained with PI, followed by analysis using a flow cytometry. Data are expressed as the mean ± SE of three independent experiments (* p < 0.01 compared with ABN-B-only treated group). (C) A549 cells were treated with of ABN-B (30 µM) with or without mito-TEMPO (50 µM) for 48 h. Subsequently, whole cell lysates were prepared, and performed Western blot analysis with the indicated antibodies. Graphs represent densitometry analyses (* p < 0.01 compared with vehicle-treated control; # p < 0.01 compared with ABN-B-only treated group). (D) A549 cells were treated with of ABN-B (30 µM) with or without mito-TEMPO (50 µM) for 48 h, subsequently stained with annexin V-FITC and PI, followed by analysis using a flow cytometry. Data are expressed as the mean of three independent experiments (* p < 0.01 compared with vehicle-treated control; # p < 0.01 compared with ABN-B-only treated group). (E) A549 cells were treated with of ABN-B (30 µM) with or without mito-TEMPO (50 µM) for 48 h. Subsequently, whole cell lysates were prepared, and performed Western blot analysis with the indicated antibodies. Graphs represent densitometry analyses (* p < 0.01 compared with vehicle-treated control; # p < 0.01 compared with ABN-B-only treated group).
Figure 6
Figure 6
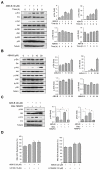
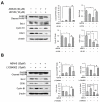
Mito-TEMPO attenuated ABN-B-induced phosphorylation of Akt and Erk1/2 in A549 cells. (A,B) A549 cells were with ABN-B (30 µM) for the indicated periods of time (A) or the indicated concentrations of ABN-B for 9 h (B). Subsequently, whole cell lysates were prepared, and we performed Western blot analysis with the indicated antibodies. Graphs represent densitometry analyses (* p < 0.01 compared with vehicle treated control, n = 3). (C) A549 cells were treated with of ABN-B (30 µM) with or without mito-TEMPO (50 µM) for 9 h. Subsequently, whole cell lysates were prepared, and we performed Western blot analysis with the indicated antibodies. Graphs represent densitometry analyses (* p < 0.01 compared with vehicle-treated control; # p < 0.01 compared with ABN-B-only treated group). (D) A549 cells were treated with ABN-B (30 μM) in the presence of U0126 or LY294002 for 2 h. Mito-SOX was used to assess mitochondrial ROS generation and Mito-SOX fluorescence was measured by flow cytometry. Data are mean ± SEM (* p < 0.01 compared with vehicle treated control, n = 3).
Figure 7
Figure 7
Inhibition of Erk1/2 and Akt attenuated apoptosis and cell cycle arrest at G2/M induced by ABN-B in A549 cells. (A,B) A549 cells were with ABN-B (30 µM) in the presence of U0126 (A) or LY294002 (B) for 48 h (B). Subsequently, whole cell lysates were prepared, and performed Western blot analysis with the indicated antibodies. Graphs represent densitometry analyses (* p < 0.01 compared with vehicle-treated control; # p < 0.01 compared with ABN-B-only treated group).
Figure 8
Figure 8
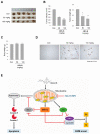
ABN-B suppressed tumor growth in Ex-3LL tumor-bearing mice. Ex-3LL tumor-bearing mouse were randomly divided into three groups: vehicle treatment group (Con), ABN-B 50 mg/kg treatment group, and ABN-B 100 mg/kg treatment group. The mice were sacrificed 21 days after treatment and tumors were removed. (A) Photographs of all tumors harvested. (B,C) Tumor volume (B) and tumor weight (C) of each treatment group (* p < 0.05 and ** p < 0.01 compared with vehicle treated control). (D) In situ apoptosis was detected TUNEL staining of tumor tissues sections from each treatment group (original magnification 400×). (E) A schematic diagram of action mechanism of ABN-B.

References

    1. Bray F., Ferlay J., Soerjomataram I., Siegel R.L., Torre L.A., Jemal A. Global cancer statistics 2018: GLOBOCAN estimates of incidence and mortality worldwide for 36 cancers in 185 countries. CA Cancer J. Clin. 2018;68:394–424. doi: 10.3322/caac.21492. - DOI - PubMed
    1. Chen Z., Fillmore C.M., Hammerman P.S., Kim C.F., Wong K.-K. Non-small-cell lung cancers: A heterogeneous set of diseases. Nat. Rev. Cancer. 2014;14:535–546. doi: 10.1038/nrc3775. - DOI - PMC - PubMed
    1. Denisenko T.V., Budkevich I.N., Zhivotovsky B. Cell death-based treatment of lung adenocarcinoma. Cell Death Dis. 2018;9:1–14. doi: 10.1038/s41419-017-0063-y. - DOI - PMC - PubMed
    1. Dubey S., Schiller J.H. Three Emerging New Drugs for NSCLC: Pemetrexed, Bortezomib, and Cetuximab. Oncologist. 2005;10:282–291. doi: 10.1634/theoncologist.10-4-282. - DOI - PubMed
    1. Schieber M., Chandel N.S. ROS Function in Redox Signaling and Oxidative Stress. Curr. Biol. 2014;24:R453–R462. doi: 10.1016/j.cub.2014.03.034. - DOI - PMC - PubMed

MeSH terms

LinkOut - more resources