. 2021 May;11(5):1192-1211.
doi: 10.1158/2159-8290.CD-20-1243. Epub 2020 Dec 16.

CRISPR Screening of CAR T Cells and Cancer Stem Cells Reveals Critical Dependencies for Cell-Based Therapies

Affiliations

CRISPR Screening of CAR T Cells and Cancer Stem Cells Reveals Critical Dependencies for Cell-Based Therapies

Dongrui Wang et al. Cancer Discov. 2021 May.

Abstract

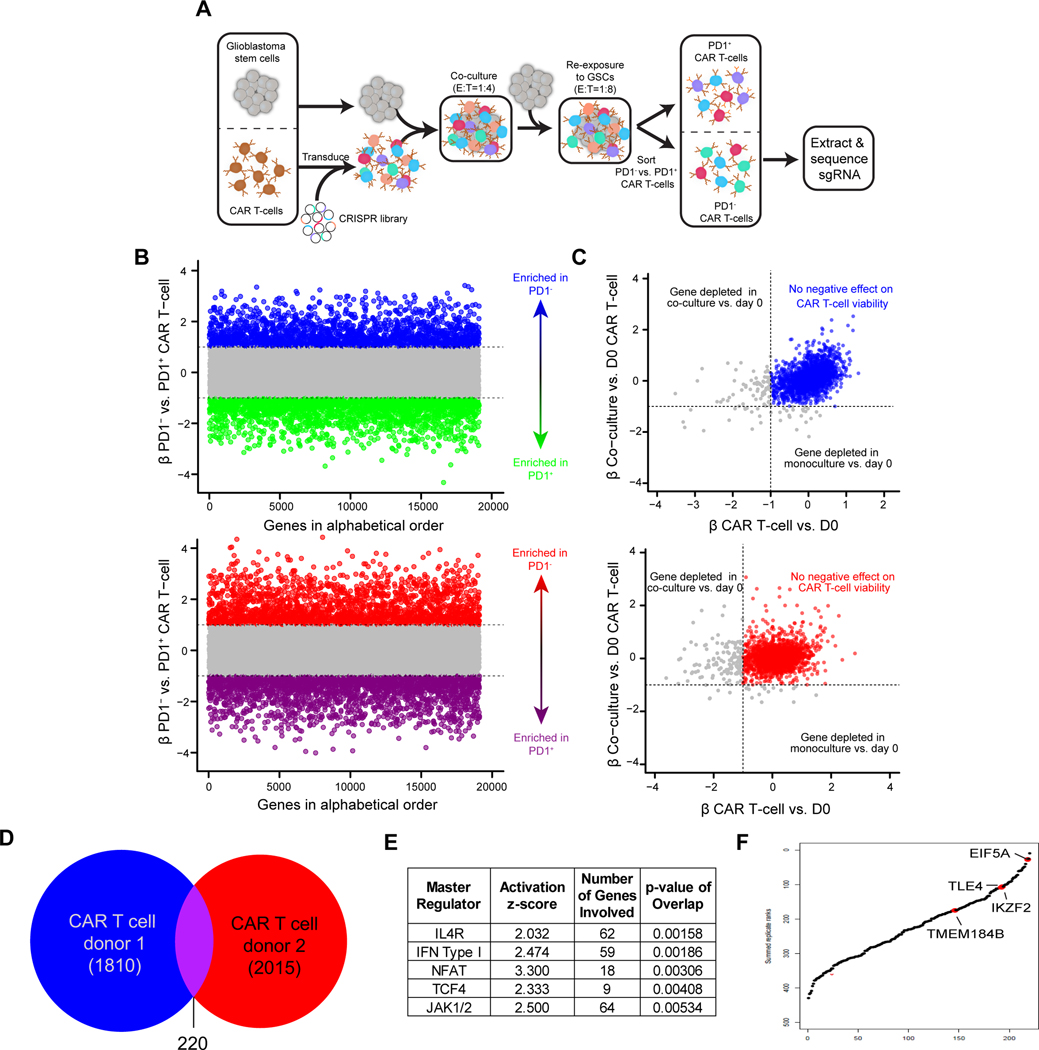
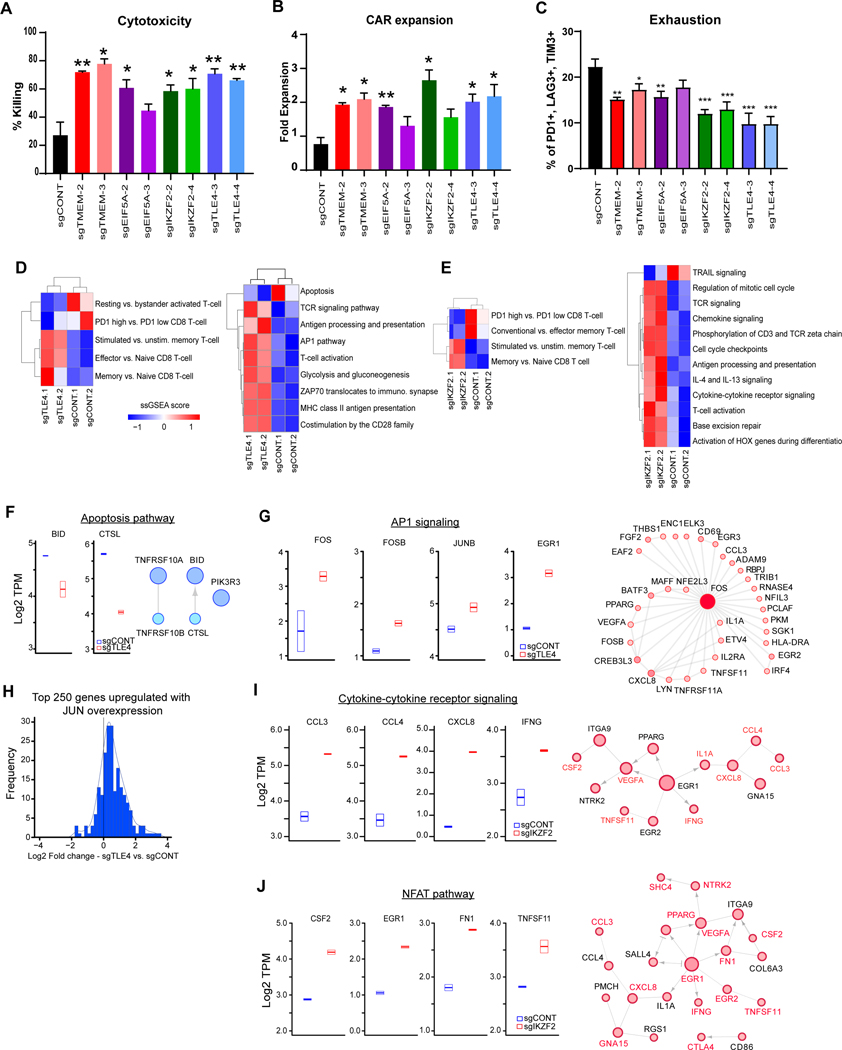
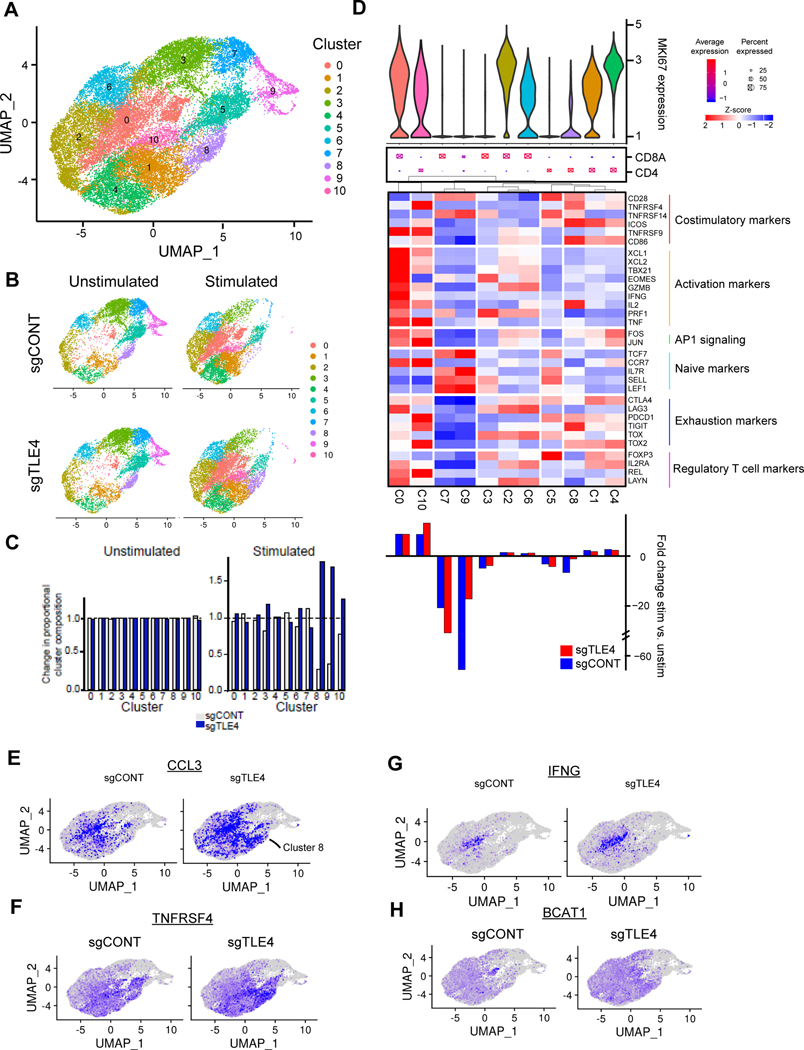
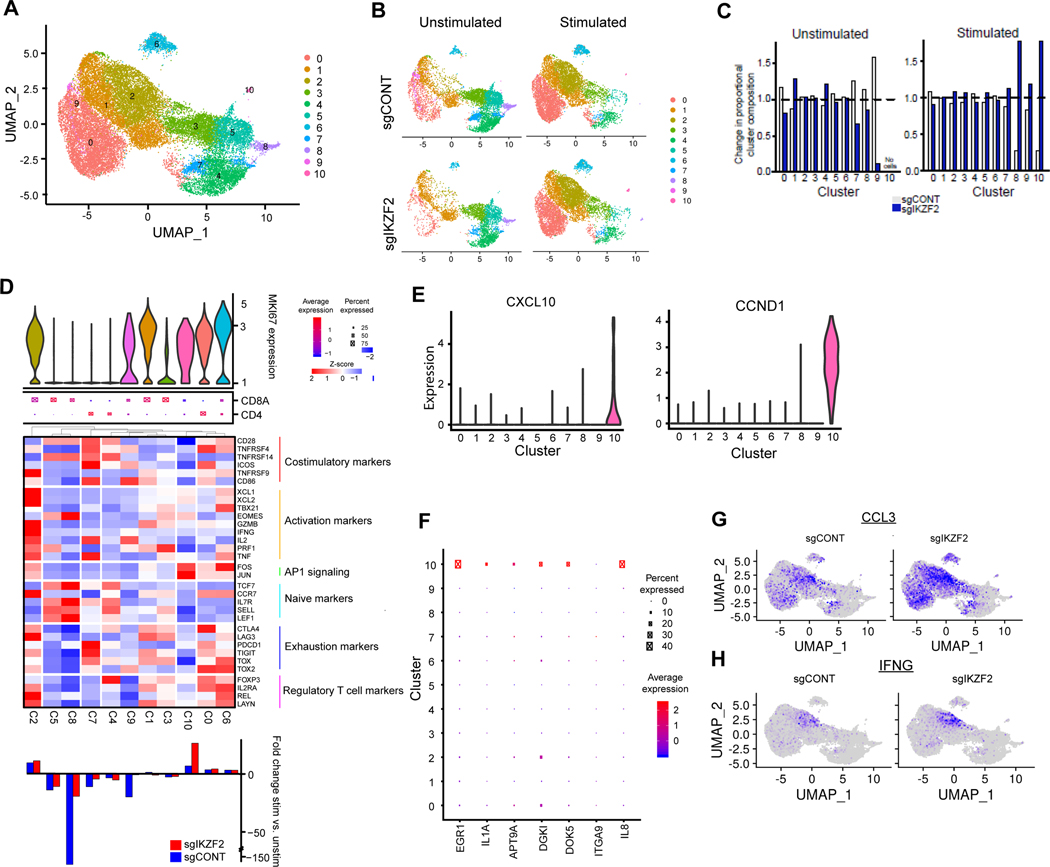
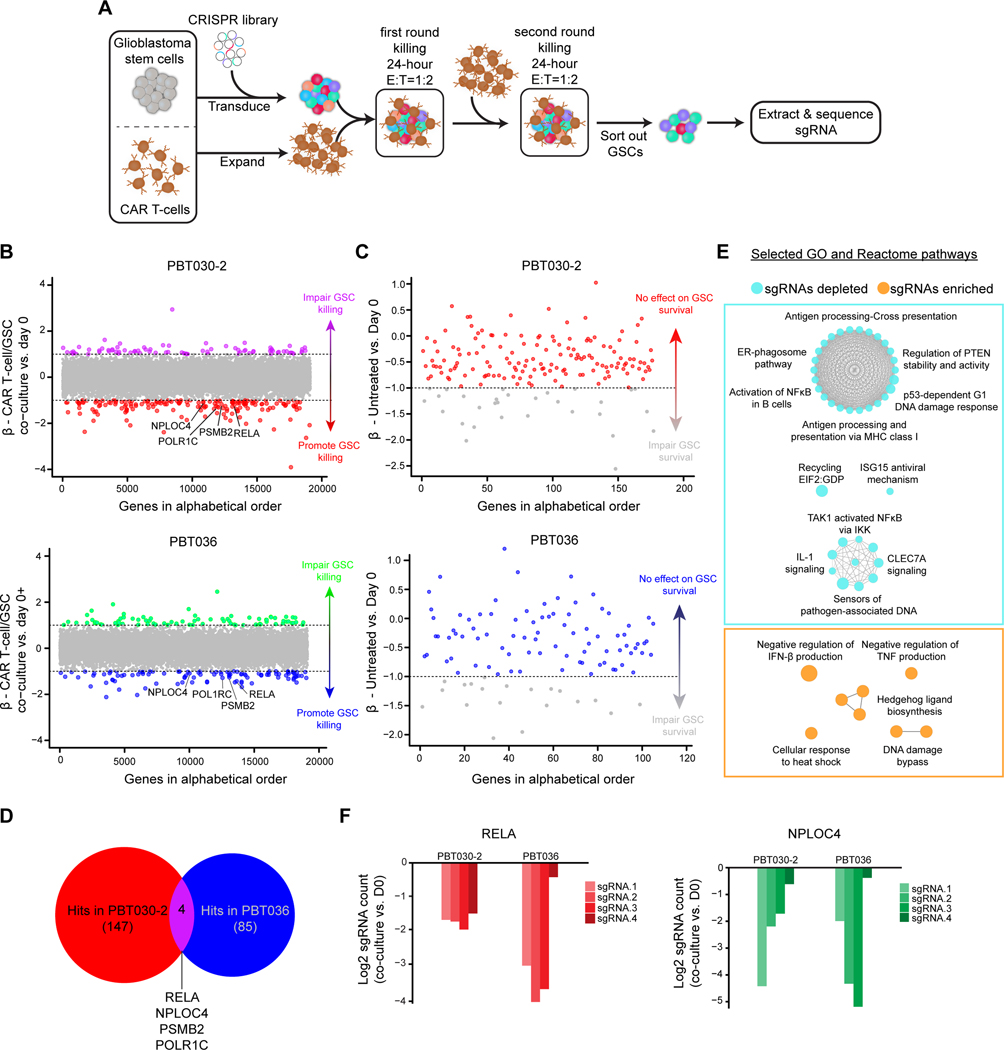
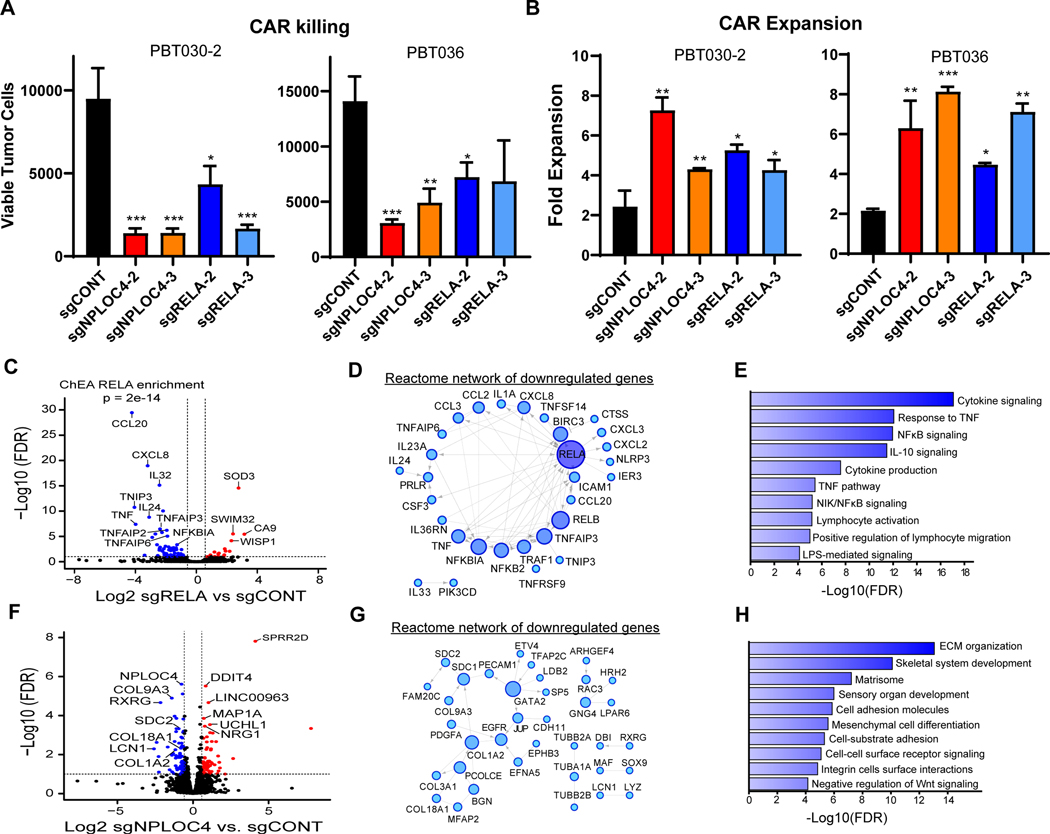
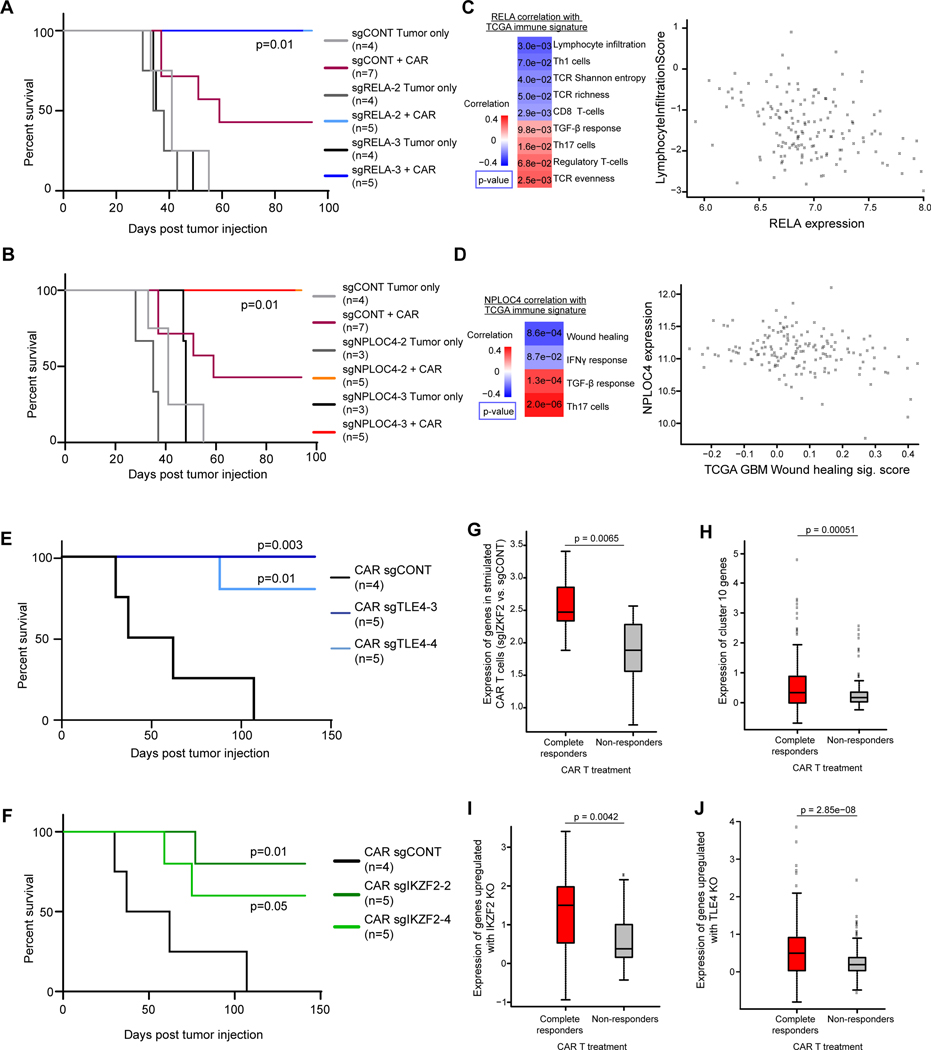
Glioblastoma (GBM) contains self-renewing GBM stem cells (GSC) potentially amenable to immunologic targeting, but chimeric antigen receptor (CAR) T-cell therapy has demonstrated limited clinical responses in GBM. Here, we interrogated molecular determinants of CAR-mediated GBM killing through whole-genome CRISPR screens in both CAR T cells and patient-derived GSCs. Screening of CAR T cells identified dependencies for effector functions, including TLE4 and IKZF2. Targeted knockout of these genes enhanced CAR antitumor efficacy. Bulk and single-cell RNA sequencing of edited CAR T cells revealed transcriptional profiles of superior effector function and inhibited exhaustion responses. Reciprocal screening of GSCs identified genes essential for susceptibility to CAR-mediated killing, including RELA and NPLOC4, the knockout of which altered tumor-immune signaling and increased responsiveness of CAR therapy. Overall, CRISPR screening of CAR T cells and GSCs discovered avenues for enhancing CAR therapeutic efficacy against GBM, with the potential to be extended to other solid tumors. SIGNIFICANCE: Reciprocal CRISPR screening identified genes in both CAR T cells and tumor cells regulating the potency of CAR T-cell cytotoxicity, informing molecular targeting strategies to potentiate CAR T-cell antitumor efficacy and elucidate genetic modifications of tumor cells in combination with CAR T cells to advance immuno-oncotherapy.This article is highlighted in the In This Issue feature, p. 995.


Figures

Figure 1.
Figure 1.. CRISPR-Cas9 screen in CAR T cells co-cultured with GSCs.
A, Overview of screen design. CAR T-cells were transduced with a whole-genome CRISPR-Cas9 library and co-cultured with GSCs, followed by a GSC rechallenge after 48 hours. At the conclusion of the screen (24 hours after the rechallenge), CAR T-cells were sorted for PD1 positivity and PD1+ or PD1 CAR T-cells were sequenced separately to identify enriched and depleted guides. B, Screen results in two replicates of independent donors with genes ordered alphabetically on the x-axis. The MAGECK β-value for each gene comparing PD1 vs. PD1+ is plotted on the y-axis. Genes enriched in PD1 cells at a β-value >1 are in blue or red and genes with a β-value of <−1 (enriched in PD1+ cells) are in green or purple. C, Plot of hits from (b) to exclude genes that are depleted following co-culture of CAR T-cells with GSCs (β-value <−1 on the y-axis) or in monoculture (β-value <−1 on the x-axis). Genes in blue or red are not depleted in either condition. D, Venn diagram illustrating common hits for depleted genes in two distinct T cell donors. E, Ingenuity Pathway Analysis of master regulators (top 5 based on p-values) of 220 overlapping genes in two T cell donors. F, Common hits ranked by β-value in a combined model for PD1 vs. PD1+ CAR T-cells. Labeled hits were selected for validation.
Figure 2.
Figure 2.. Targets on CAR T cells improves effector potency and alter transcriptional profiles.
A, Killing of CAR T cells with TLE4-, IKZF2-, TMEM184B- or EIF5A-KO against co-cultured GSCs (E:T=1:40, 48 hours). B, Expansion of CAR T cells with different knockouts in co-culture with GSCs (E:T=1:40, 48 hours). C, CAR T cells with targeted KOs of specific genes were co-cultured with PBT030–2 cells (E:T=1:4) for 48 hours, and re-challenged with tumor cells against (E:T=1:8) for 24 hours, and then analyzed for the expression of exhaustion markers. (A,B,C) *p<0.05, **p<0.01, ***p<0.001 compared to CAR T cells transduced with non-targeting sgRNA (black) using unpaired Student’s t tests. D and E, Unsupervised clustering of ssGSEA scores comparing TLE4-KO (C) or IKZF2-KO (D) vs. sgCONT CAR T cells for the signatures of selected T cell populations (left) or immune and functional pathways (right). F, Left: Boxplot of genes involved in apoptotic signaling from RNA-sequencing data in sgCONT (blue) vs. sgTLE4 (red). Right: Reactome network of genes downregulated following TLE4 knockout that are involved in apoptotic signaling. G, Left: Boxplot of genes involved in AP1 signaling from RNA-sequencing data in control (blue) vs. TLE4KO (red) cells. Right: Reactome network of genes upregulated with TLE4 knockout that are linked to FOS. Increasing node size and fill hue are proportional to node degree. H, Histogram of log2 fold change of gene expression (comparing TLE4KO vs. control) for 250 genes previously shown to be upregulated with JUN overexpression. I, Left: Boxplot of genes involved in cytokine receptor signaling from RNA-sequencing data in control (blue) vs. IKZF2KO (red) cells. Right: Reactome network of genes upregulated with IKZF2-KO that are linked to a gene in the cytokine receptor signaling pathway (labeled in red). Increasing node size and fill hue are proportional to node degree. J, Left: Boxplot of genes in the NFAT pathways from RNA-sequencing data in control (blue) vs. IKZF2KO (red) cells. Right: Reactome network of genes upregulated with IKZF2-KO that are linked to upregulated genes in the NFAT pathway (labeled in red).
Figure 3.
Figure 3.. The effect of TLE4KO on CAR T cell subpopulations.
A, UMAP projection of single cell RNA sequencing of control and TLE4KO CAR T cells both before and after stimulation with GSCs. Cluster assignments for the overall population are shown. B, Cluster composition of unstimulated vs. unstimulated control or TLE4KO cell populations. C, Population distribution of control and TLE4KO CAR T cells before and after stimulation. D, Characterization of clusters based upon cell proliferation. Top: Violin plot of MKI67 expression. Middle: Dot plot of CD4 vs. CD8A expression wherein larger dots indicate a higher proportion of cells with expression and red vs. blue fill indicates higher expression. Heatmap: Scaled expression of T cell markers including costimulatory, activation, naive, exhaustion and regulatory T cell markers as well as AP1 signaling. Bottom: Proportion of cells in each cluster under stimulated vs. unstimulated conditions in control (blue) or TLE4KO (red) populations. Positive values indicate increase in cluster occupancy following stimulation. E-H, Expression of CCL3 (E), TNFRSF4 (F), IFNG (G) and BCAT1 (H) in control or TLE4KO CAR T-cells superimposed on the UMAP projection.
Figure 4.
Figure 4.. IKZF2 regulates CAR T cell subpopulations.
A, UMAP projection of single cell RNA sequencing of control and IKZF2KO CAR T-cells both before and after stimulation with GSCs. Top: Cluster assignments for the overall population. B, Cluster composition of unstimulated vs. unstimulated control or IKZF2KO cell populations. C, Population distribution of control and IKZF2KO CAR T cells before and after stimulation. D, Characterization of clusters based upon cell proliferation. Top: Violin plot of MKI67 expression. Middle: Dot plot of CD4 vs. CD8A expression wherein larger dots indicate a higher proportion of cells with expression and red vs. blue fill indicates higher expression. Heatmap: Scaled expression of T cell markers including costimulatory, activation, naive, exhaustion and regulatory T cell markers as well as AP1 signaling. Bottom: Proportion of cells in each cluster under stimulated vs. unstimulated conditions in sgCONT (blue) or sgIKZF2 (red) populations. Positive values indicate increase in cluster occupancy following stimulation. E, Expression of CXCL10 and CCND1 across clusters (violin plot). F, Expression of top upregulated genes in bulk RNA-seq for sgIKZF2 vs. sgCONT across single cell clusters. G and H, Expression of IFNG(G) and CCL3(H) in sgCONT or sgIKZF2 CAR T-cells superimposed on the UMAP projection.
Figure 5.
Figure 5.. CRISPR-Cas9 screen in GSCs co-cultured with CAR T-cells.
A, Overview of screen design. GSCs were transduced with a whole-genome CRISPR-Cas9 library and subjected to two rounds of CAR T cell killing (total E:T=1:1). GSCs were then extracted, libraries were prepared, and sequenced to identify enriched and depleted guides. B, Results of the screen in each GSC model. Genes are ordered alphabetically on the x-axis and by MAGECK β score on the y-axis comparing co-culture vs. untreated GSCs. Genes in purple or green are enriched at β > 1 (sgRNAs targeting genes that impair GSC killing by CAR T-cells) and those in red or blue are depleted at β < −1 (sgRNAs targeting gene that promote GSC killing by CAR T-cells). C, Plot of depleted genes for each model ordered alphabetically on the x-axis by MAGECK β score on the y-axis comparing untreated day ** vs. day 0. Points in grey are depleted at β < −1 (sgRNAs targeting the gene impair GSC survival). The remaining points in red or blue indicate genes for which knockout do not effect GSC survival. D, Venn diagram illustrating common hits for depleted genes in two models. E, ClueGO plot of GO and Reactome pathways enriched in the union of hits for both models. F, Log2 fold change of normalized counts for each sgRNA targeting common CRISPR screen hits comparing co-culture to day 0. GSC: glioblastoma stem cell.
Figure 6.
Figure 6.. RELA or NPLOC4 disruption improves CAR T cell killing of GSCs.
A, CAR T cell killing of GSCs (E:T=1:40, 48 hours) with CRISPR-mediated knockout of RELA or NPLOC4. B, CAR T cell expansion in co-culture with GSCs (E:T=1:40, 48 hours) with CRISPR-mediated knockout of RELA or NPLOC4. (a, b) *p<0.05, **p<0.01, ***p<0.001 compared to GSCs transduced with non-targeting sgRNA (black) using unpaired Student’s t tests. C, RNA-sequencing of GSCs following RELA knockout plotted as –log10 FDR (y-axis) vs. log2 fold change of RELA knockout vs. control (x-axis). Blue or red points are genes with <−1.5- or >1.5-fold change, respectively at an FDR of <0.05. D, Reactome network of genes downregulated following RELA knockout. Only genes linked in the Reactome database to at least one other gene are shown. Node size and color saturation are proportional to node degree. Activating interactions are indicated by arrowheads, while dotted lines indicate predicted interactions. E, Pathway enrichment of genes in the Reactome network of downregulated genes in (c). F, RNA-sequencing of GSCs following NPLOC4 knockout plotted as –log10 FDR (y-axis) vs. log2 fold change of NPLOC4 knockout vs. control (x-axis). Blue or red points are genes with <−1.5- or >1.5-fold change, respectively at an FDR of <0.05. G, Reactome network of genes downregulated following NPLOC4 knockout. H, Pathway enrichment of genes in the Reactome network of downregulated genes in (F).
Figure 7.
Figure 7.. Functional and clinical relevance of targets on GSCs and CAR T cells.
A and B, Kaplan-Meier survival curves comparing mouse survival for RELA (A) or NPLOC4 (B) knockout with non-targeting controls. Tumors were established by orthotopically implanting 2×10⁵ PBT030–2 GSCs, and treated after 8 days with 5×10⁴ CAR T cells. P-values were shown comparing each group with “sgCONT+CAR” group using Log-rank test. C, Left: Correlation of RELA expression with immune and T cell signatures in TCGA GBM RNA-seq data. Right: Scatter plot of lymphocyte infiltration signature score vs. RELA expression by tumor from TCGA GBM RNA-seq data. D, Left: Correlation of NPLOC4 expression with immune and T cell signatures in TCGA GBM RNA-seq data. Right: Scatter plot of NPLOC4 expression vs. wound healing signature score by tumor from TCGA GBM RNA-seq data. (C, D) p-values were calculated as Pearson’s correlation coefficients. E and F, Kaplan Meier curves demonstrating prolonged survival in an intracranial xenograft model of GBM treated with TLE4KO (C) or IKZF2KO (D) CAR T-cells (blue) compared to non-targeting control (black). Tumors were established by orthotopically implanting 2×10⁵ PBT030–2 GSCs, and treated after 8 days with 2×10⁴ CAR T cells. P-values were shown comparing each group with the “CAR sgCONT” group using Log-rank test. FDR: False discovery rate. G, Fold change after stimulation of genes significantly upregulated (FDR < 0.05, Log2 fold change > 1) following IKZF2 knockout after tumor stimulation, in an independent dataset of clinical CAR T cells products from patients with CLL. H, Fold change after stimulation of genes enriched in cluster 10 as shown in Fig. 5. I and J, Fold change after stimulation of genes significantly upregulated (FDR < 0.05, Log2 fold change > 1) following IKZF2 (I) or TLE4 (J) knockout. (G-J) CAR T cells were stratified by response of the patient from which they were derived - complete responders or non-responders - to CAR therapy and the log2 fold change of stimulated vs. mock-stimulated gene expression was plotted, p-values were calculated by unpaired Student’s t tests.

References

    1. Lim M, Xia Y, Bettegowda C, Weller M. Current state of immunotherapy for glioblastoma. Nat Rev Clin Oncol 2018;15(7):422–42 doi 10.1038/s41571-018-0003-5. - DOI - PubMed
    1. Maude SL, Laetsch TW, Buechner J, Rives S, Boyer M, Bittencourt H, et al.Tisagenlecleucel in Children and Young Adults with B-Cell Lymphoblastic Leukemia. N Engl J Med 2018;378(5):439–48 doi 10.1056/NEJMoa1709866. - DOI - PMC - PubMed
    1. Neelapu SS, Locke FL, Bartlett NL, Lekakis LJ, Miklos DB, Jacobson CA, et al.Axicabtagene Ciloleucel CAR T-Cell Therapy in Refractory Large B-Cell Lymphoma. N Engl J Med 2017;377(26):2531–44 doi 10.1056/NEJMoa1707447. - DOI - PMC - PubMed
    1. Brown CE, Starr R, Aguilar B, Shami AF, Martinez C, D’Apuzzo M, et al.Stem-like tumor-initiating cells isolated from IL13Ralpha2 expressing gliomas are targeted and killed by IL13-zetakine-redirected T Cells. Clin Cancer Res 2012;18(8):2199–209 doi 10.1158/1078-0432.CCR-11-1669. - DOI - PMC - PubMed
    1. Ahmed N, Salsman VS, Kew Y, Shaffer D, Powell S, Zhang YJ, et al.HER2-specific T cells target primary glioblastoma stem cells and induce regression of autologous experimental tumors. Clin Cancer Res 2010;16(2):474–85 doi 10.1158/1078-0432.CCR-09-1322. - DOI - PMC - PubMed

MeSH terms

Substances