. 2020 Dec 16;4(2):e202000882.
doi: 10.26508/lsa.202000882. Print 2021 Feb.

FIREWORKS: a bottom-up approach to integrative coessentiality network analysis

Affiliations

FIREWORKS: a bottom-up approach to integrative coessentiality network analysis

David R Amici et al. Life Sci Alliance. .

Abstract

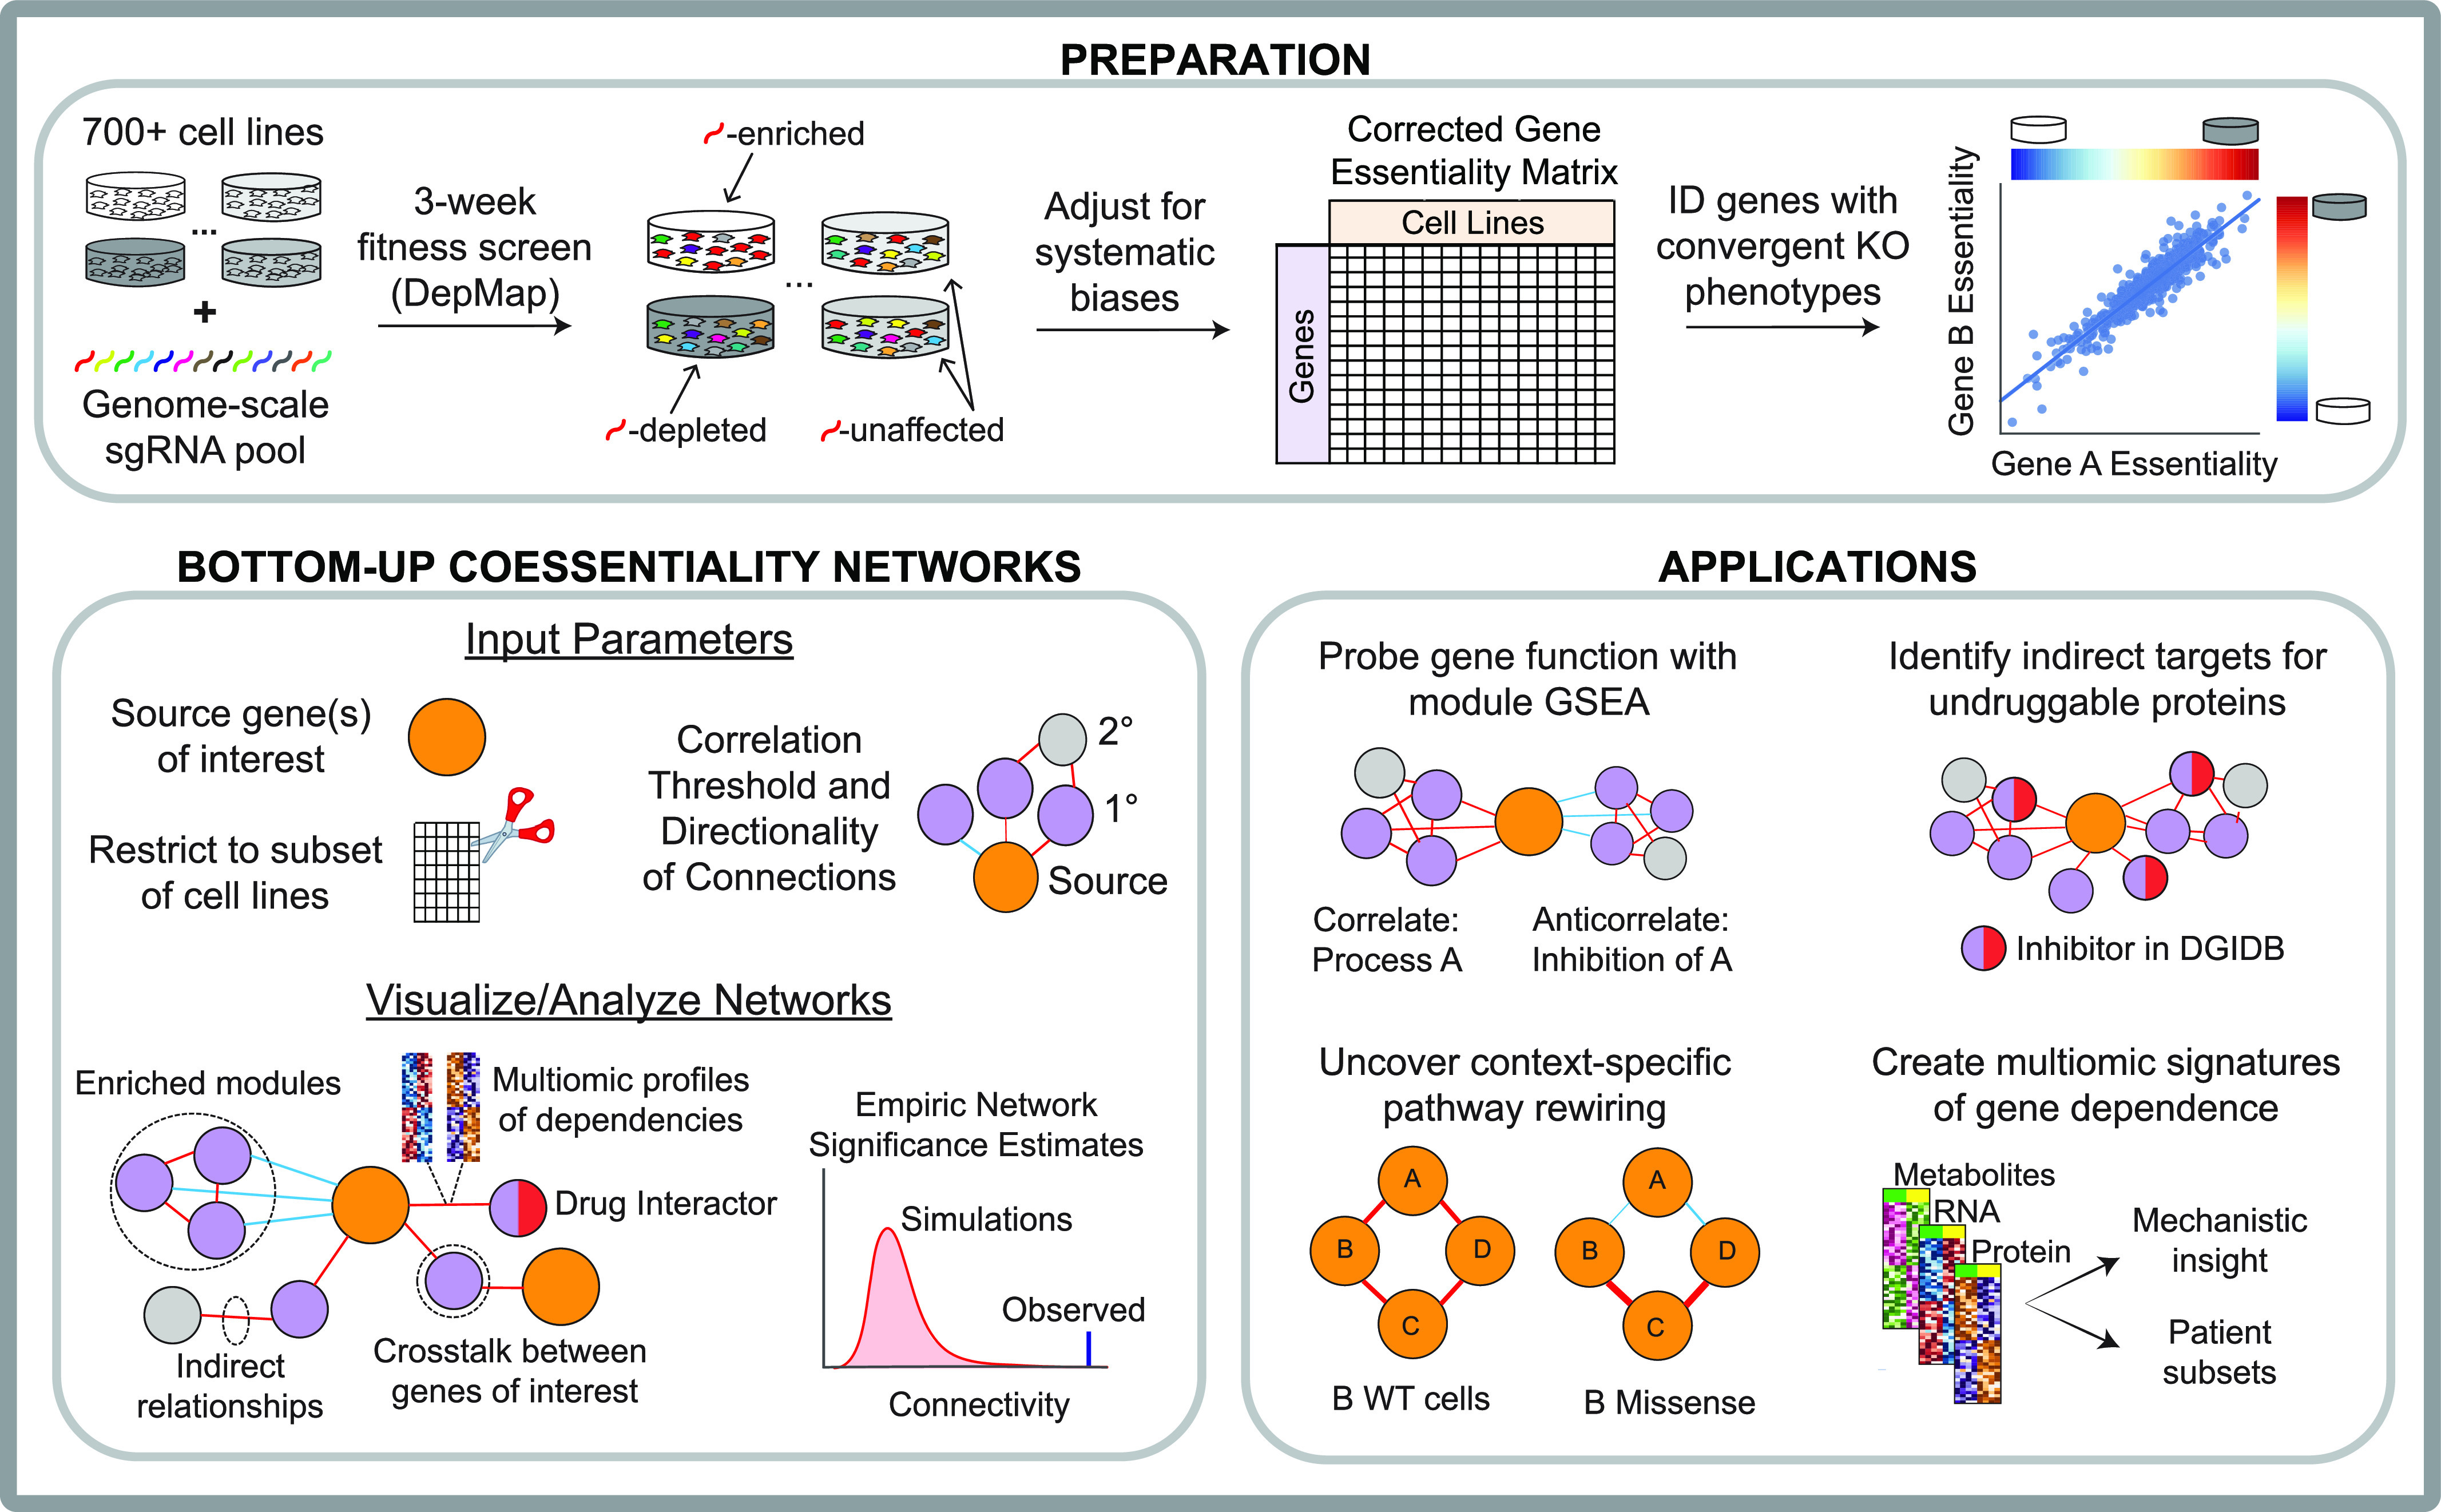
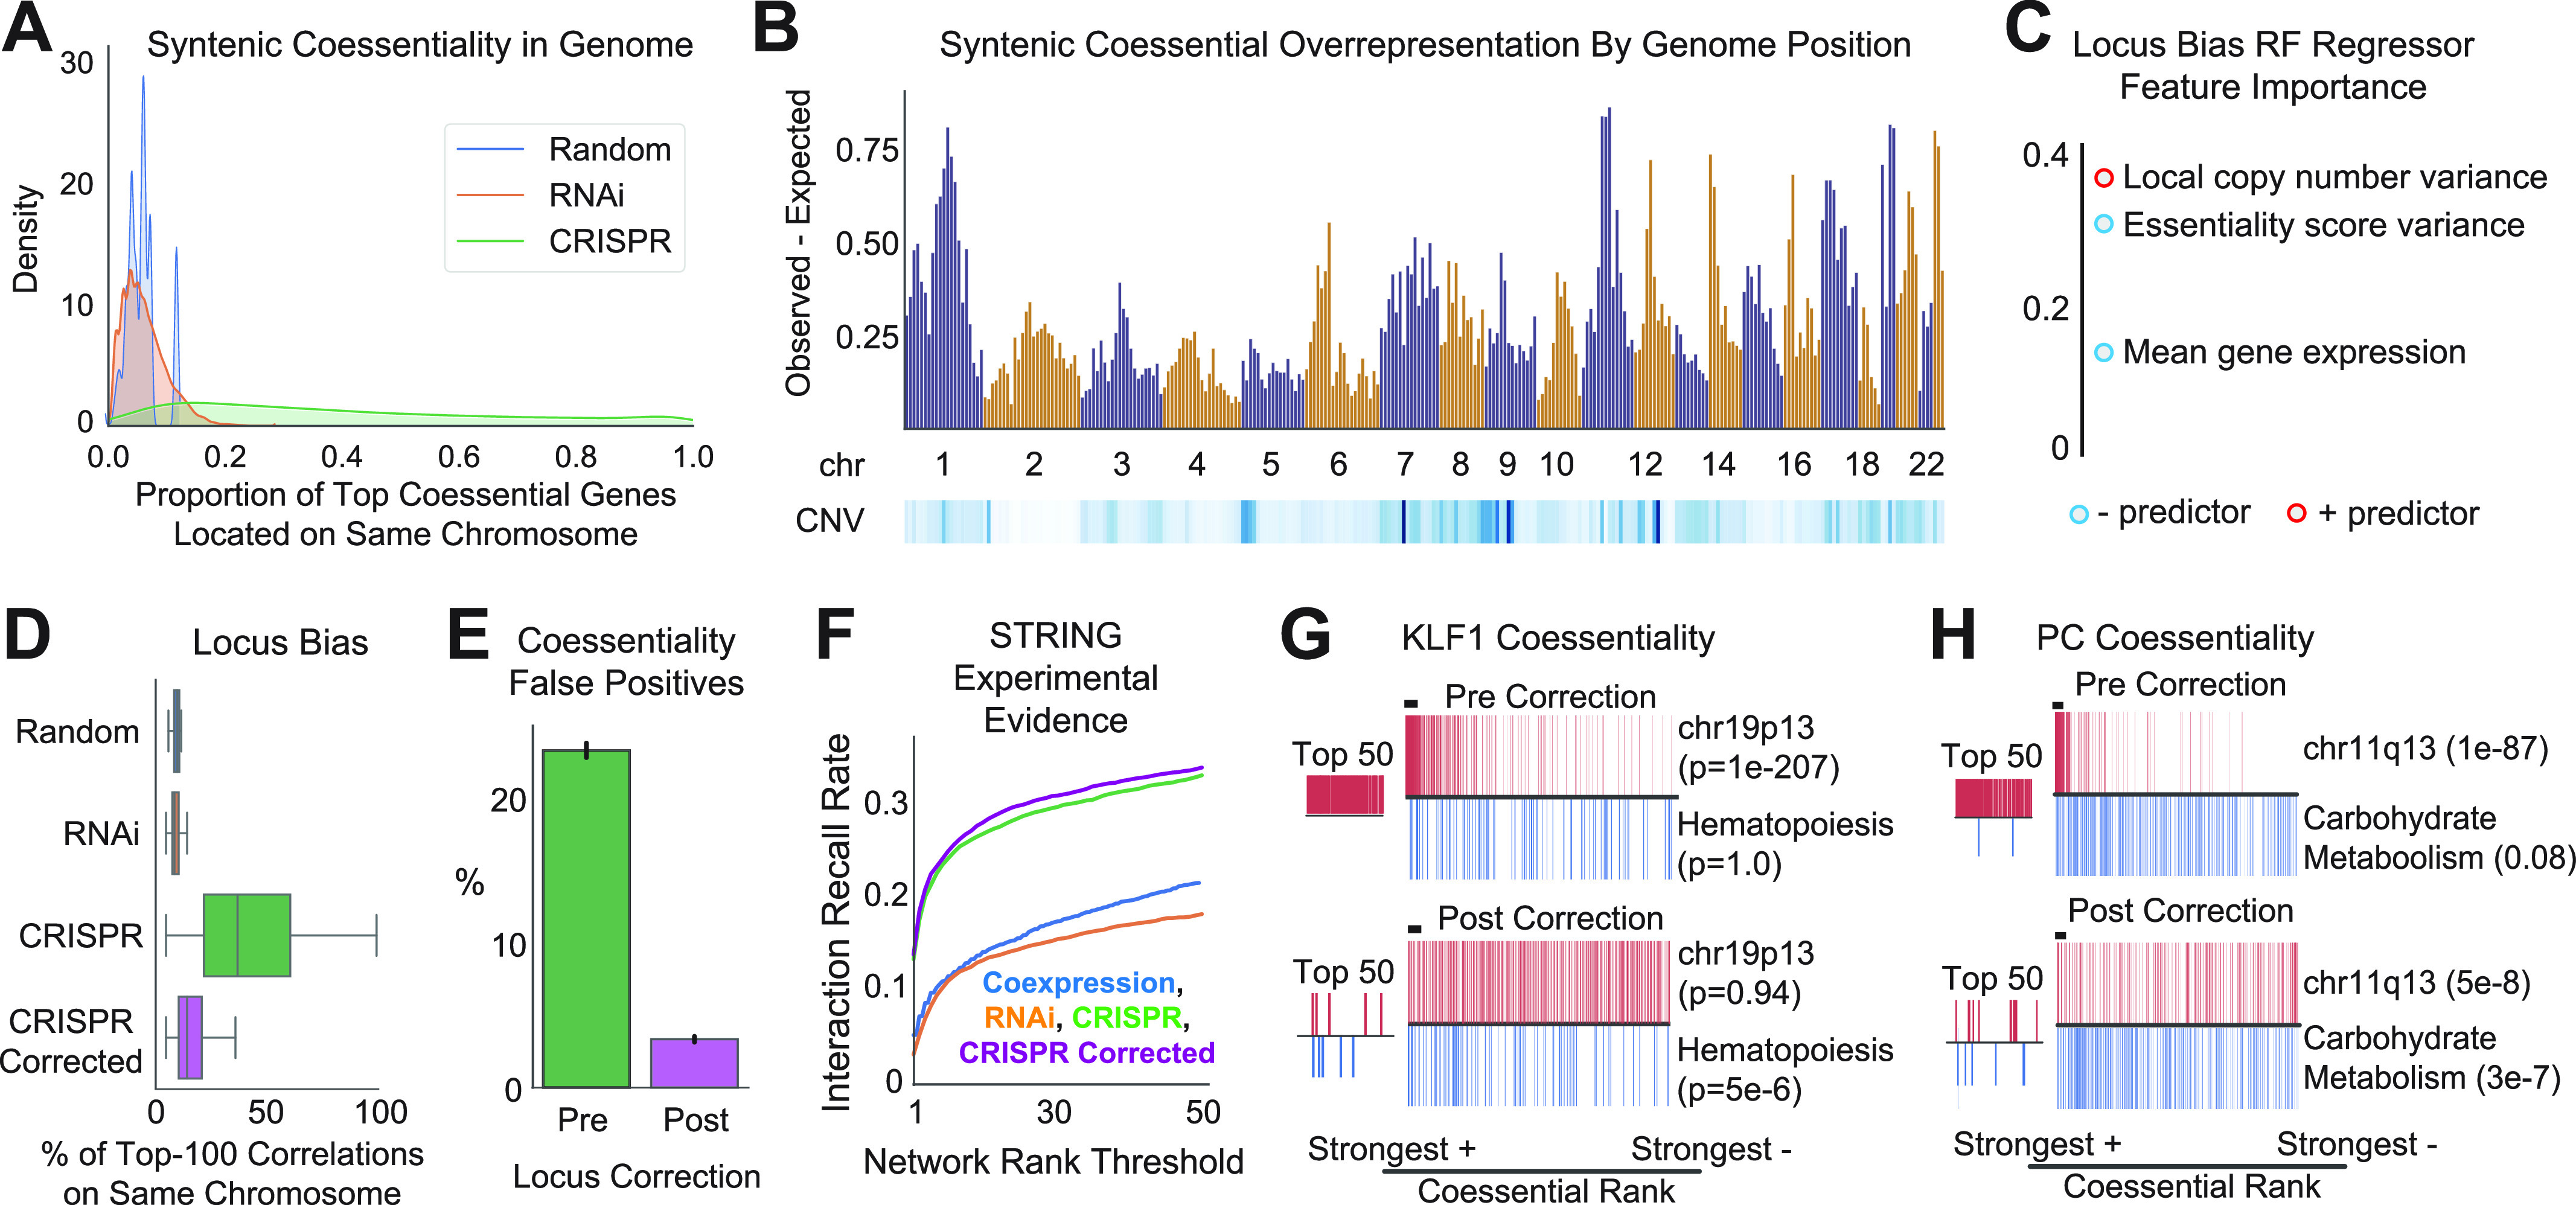
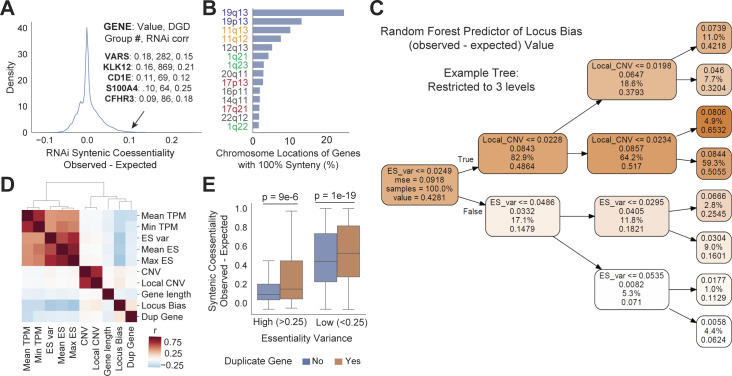
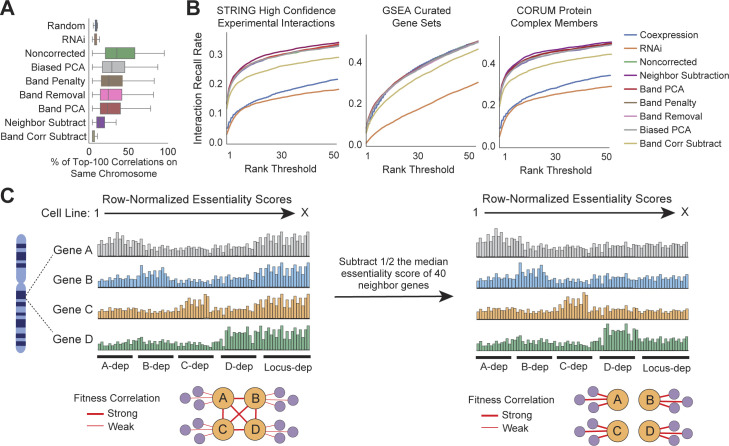
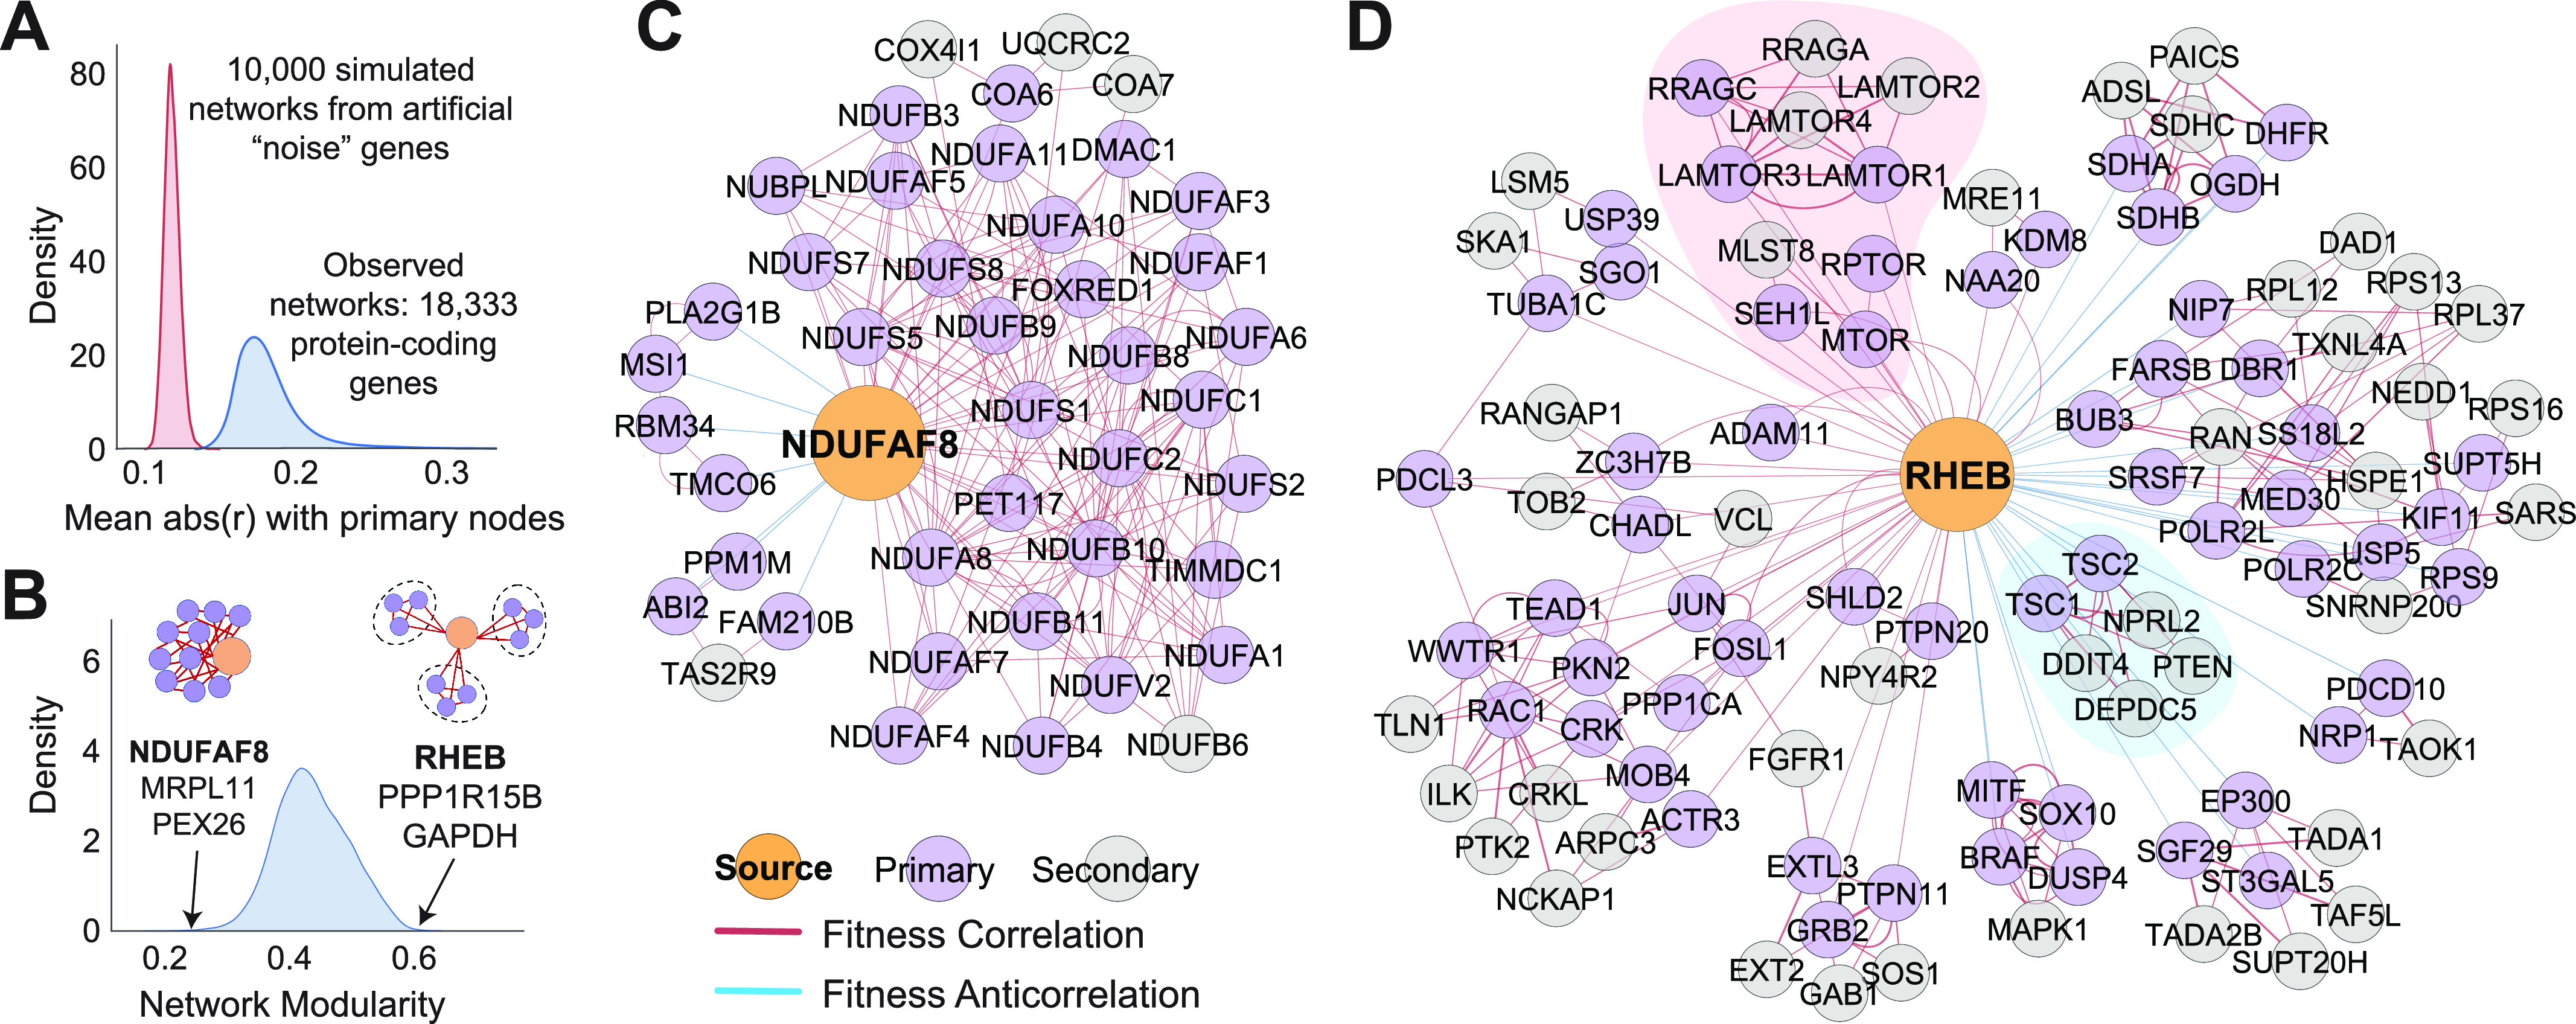
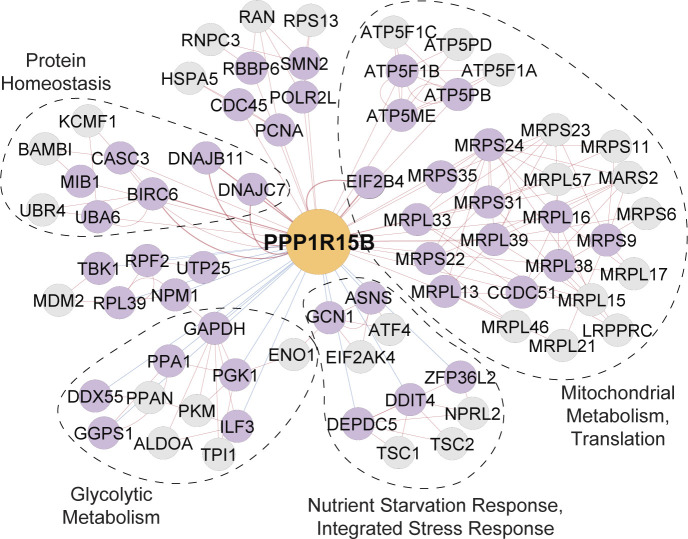
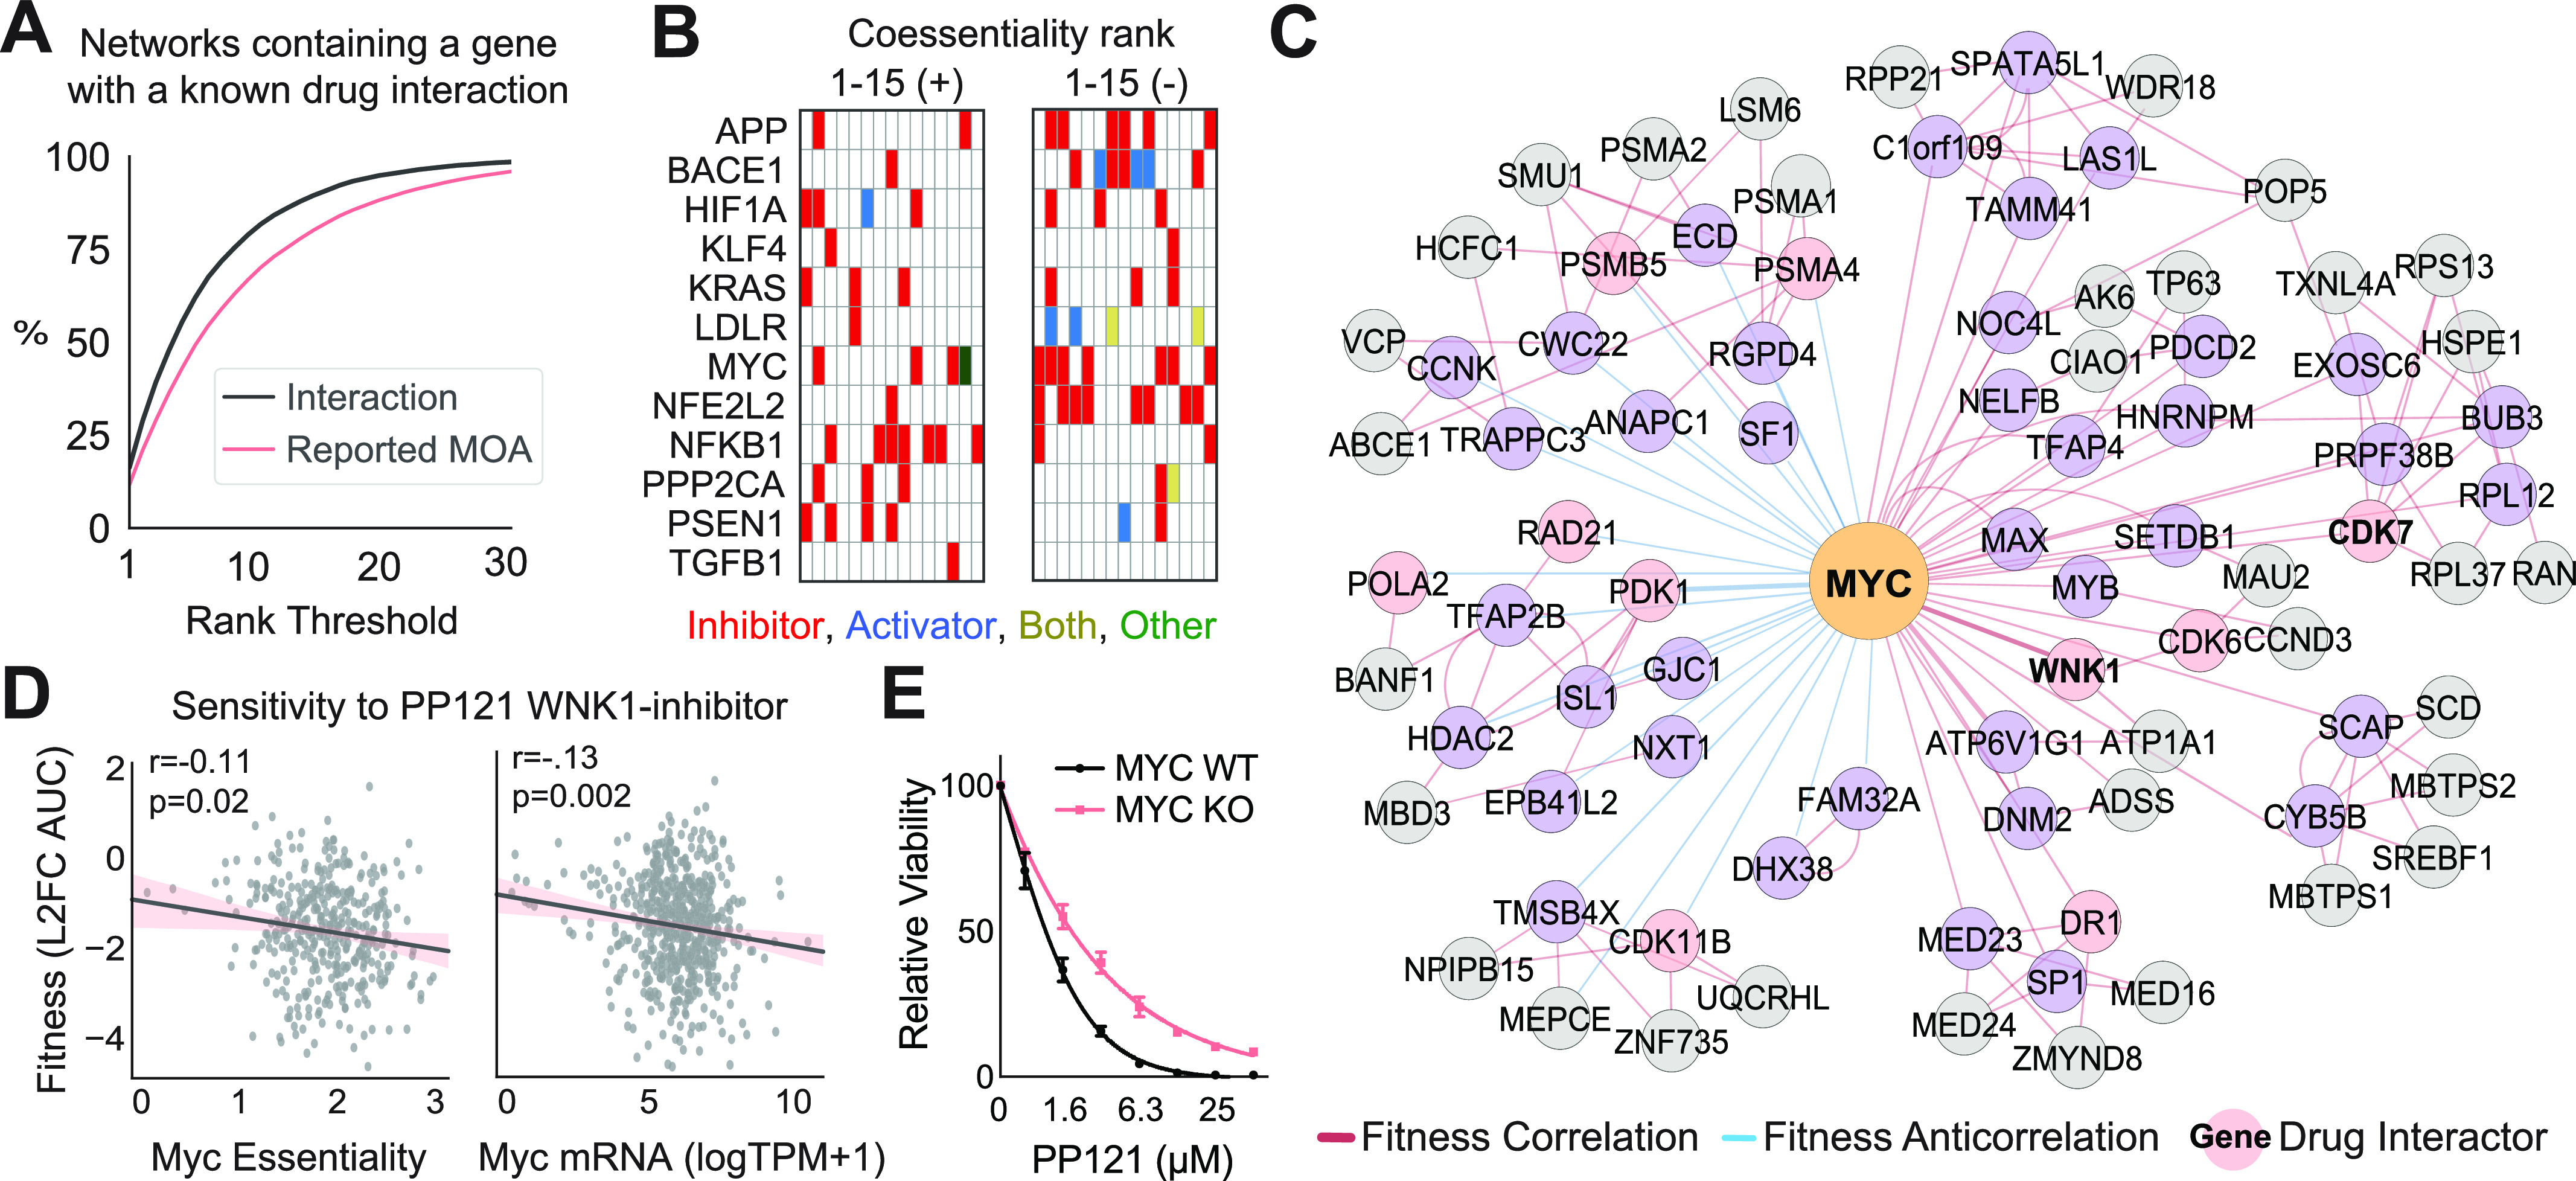
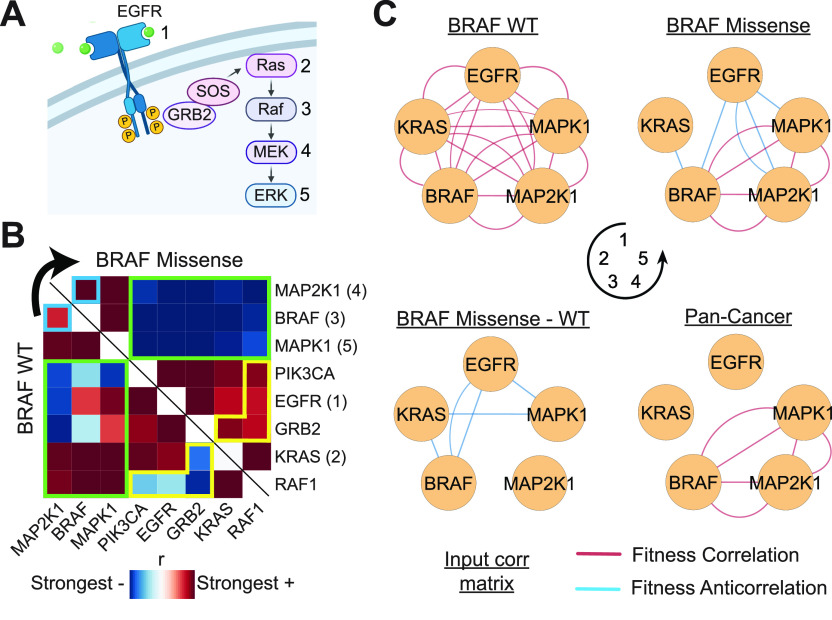
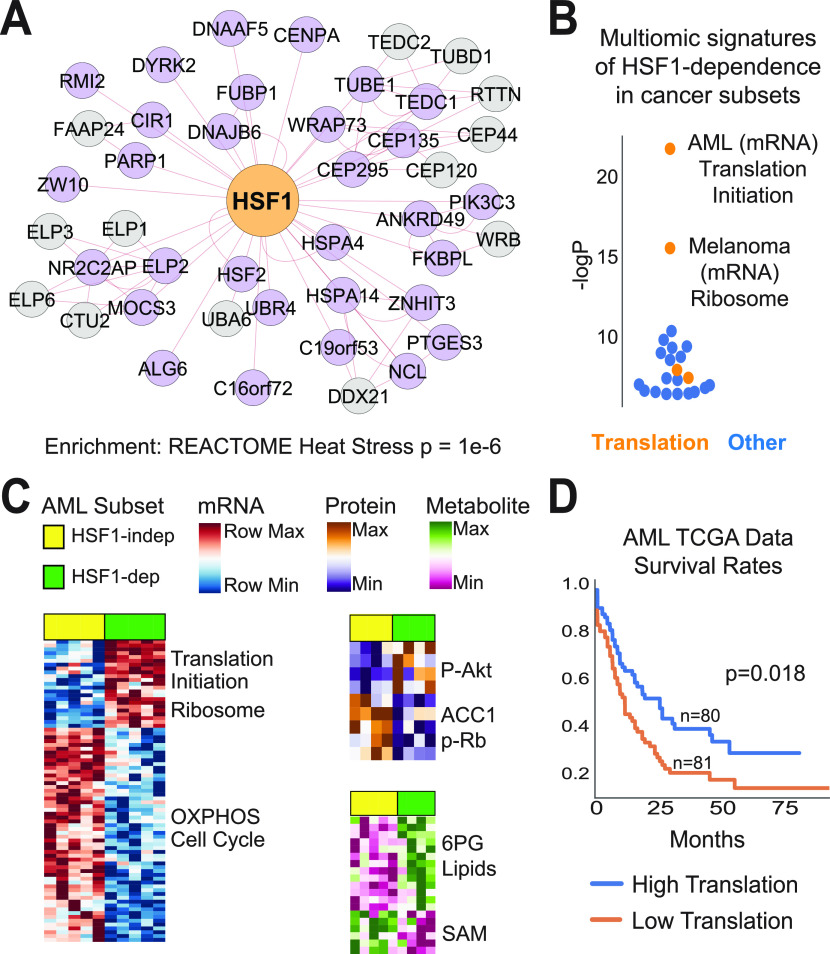
Genetic coessentiality analysis, a computational approach which identifies genes sharing a common effect on cell fitness across large-scale screening datasets, has emerged as a powerful tool to identify functional relationships between human genes. However, widespread implementation of coessentiality to study individual genes and pathways is limited by systematic biases in existing coessentiality approaches and accessibility barriers for investigators without computational expertise. We created FIREWORKS, a method and interactive tool for the construction and statistical analysis of coessentiality networks centered around gene(s) provided by the user. FIREWORKS incorporates a novel bias reduction approach to reduce false discoveries, enables restriction of coessentiality analyses to custom subsets of cell lines, and integrates multiomic and drug-gene interaction datasets to investigate and target contextual gene essentiality. We demonstrate the broad utility of FIREWORKS through case vignettes investigating gene function and specialization, indirect therapeutic targeting of "undruggable" proteins, and context-specific rewiring of genetic networks.


Conflict of interest statement

The authors declare that they have no conflict of interest.

Figures

Figure 1.
Figure 1.. Schematic representation of bottom-up, integrative coessentiality network mapping with FIREWORKS.
Figure 2.
Figure 2.. Correction of genomic locus bias reduces false positives and increases predictive power in CRISPR coessentiality analysis.
(A) Genome-scale distribution of the fraction of each gene’s top 100 ranked fitness correlations which are co-localized in the same chromosomal band. Random indicates frequency based on chromosome gene content, whereas RNAi indicates coessentiality computed using shRNA screen data. CRISPR data and RNAi data stem from 739 and 712 cell lines, respectively. (B) Median locus bias (syntenic coessentiality rate observed minus maximum expected from RNAi coessentiality or random chance) and copy number variability (CNV; blue is higher variability) for chromosomal band neighborhoods across the genome. (C) Gini importance, a measure of the power of a feature to reduce model uncertainty, of gene-level features in a Random Forest regression model trained to predict locus bias. (D) The neighbor subtraction preprocessing approach for locus correction (see the Materials and Methods section and Fig S2) reduces the burden of locus-biased false positives in CRISPR coessentiality analysis. (E) Presumed false positives (syntenic correlations beyond threefold expected by either chance or RNAi coessentiality) comprise 23% and 3% of the average gene’s top 50 ranked correlations before and after correction, respectively. (F) Locus-corrected CRISPR coessentiality data identifies more true positive experimental interactions than non-corrected CRISPR coessentiality, RNAi coessentiality, and transcript co-expression datasets. (G, H) The coessentiality profile of highly locus-biased genes before and after locus correction reveals increased prioritization of known relationships and a reduction in locus-associated false positives. P-value from hypergeometric test.
Figure S1.
Figure S1.. Identifying the factors predictive of locus bias in CRISPR coessentiality data.
(A) Many genes which are members of duplicated gene families have higher fitness correlations in RNAi data than would be expected by random chance. RNAi corr indicates the strongest correlation observed in the duplicate gene family in RNAi coessentiality data; each correlation shown is significant at P < 1 × 10⁻⁴. Only duplicate families with less than 10 genes are considered in this analysis. (B) Chromosomal band localization of the 1,019 genes which contain only syntenic genes in their top-ranked CRISPR fitness correlations. Bands on the same chromosome are color-matched. (C) An example decision tree from a Random Forest regressor model trained to predict locus bias. This tree, capped at three decision levels for visibility, only uses each gene’s essentiality score variance (ES_var) and local copy number variance (Local_CNV) to estimate locus bias. Darker orange indicates a higher locus bias value. (D) Correlation of gene-level features considered for machine learning analysis indicates that factors related to the biological validity of the cancer cell knockout phenotype (gene expression, magnitude of fitness effect observed with knockout, etc.) cluster together. Similarly, gene-level CNV and band-level (local) CNV cluster together. Duplicate gene status has a similar correlation profile to Locus Bias itself. (E) Membership in an intra-chromosomal duplicated gene family is associated with higher correlation with neighbor genes, even when stratifying by the degree of essentiality score variance. Mann Whitney U test. DGD, Duplicated Gene Database.
Figure S2.
Figure S2.. Benchmarking of different locus-correction approaches.
(A) All bias reduction approaches applied to the Project Achilles CRISPR-Cas9 fitness screening dataset reduce false positives (i.e., the syntenic coessentiality rate beyond expected) to different degrees. (B) The neighbor subtraction bias adjustment preprocessing approach confers the greatest performance increase for prediction of experimental interactions and protein complex membership and does not worsen the ability to recall genes in the same gene set enrichment analysis gene set. (C) A schematic illustration of the neighbor subtraction approach to reduce locus bias in CRISPR coessentiality data, where each bar represents a cell line, and the height of the bar represents dependence on the indicated gene.
Figure 3.
Figure 3.. Construction of a bottom-up coessentiality network for every gene in the genome.
(A) A standard bottom-up coessentiality network, as described in text, was created for every gene in the genome as well as 10,000 simulated fitness profiles created from random sampling of gene essentiality data. The average absolute magnitude of the Pearson correlation for the primary connections observed from actual genes was all stronger than at least 99.5% of simulated networks. (B) Modularity of each gene’s bottom-up coessentiality network after application of Louvain’s algorithm for community detection. Examples of low-modularity and high-modularity networks are highlighted. (C) NDUFAF8, a component of complex I in the electron transport chain, is an example of a low-modularity network dominated by genes related to oxidative phosphorylation. (D) RHEB, a small GTPase involved in mTORC1 regulation, is an example of a high modularity network containing many clusters of densely interconnected genes. The red module represents genes involved in mTORC1 activation downstream of RHEB and the blue module represents the TSC1-TSC2 complex which negatively regulates RHEB to inactivate mTORC1 signaling. Note that double looping (two connections between a given gene pair) indicates that the correlation relationship is among the top-ranked for both genes at the specified rank thresholds (here, 30 for primary nodes and 5 for secondary nodes).
Figure S3.
Figure S3.. PPP1R15B centers a high-modularity network.
Functional modules (gene set enrichment analysis hypergeometric P < 1 × 10⁻³) within the bottom-up coessentiality network of the phosphatase responsible for Integrated Stress Response termination.
Figure 4.
Figure 4.. Integration of drug–gene interaction data to identify surrogate therapeutic targets for challenging proteins.
(A) Proportion of bottom-up coessentiality networks in the genome which contain at least one protein with a known gene-drug interaction in the Drug-Gene Interaction Database at the specified rank threshold. For (A), only positive primary nodes are considered. Reported mechanism of action refers to drug–gene interactions characterized with mechanisms such as “inhibitor” or “activator.” (B) Presence of drug–gene interactions with reported mechanism of action for the top 15 ranked correlations and anticorrelations for a panel of attractive therapeutic target proteins. (C) An example bottom-up network for a challenging therapeutic target, MYC, which has a coessential knockout phenotype with several genes targeted by existing drugs (red nodes). (D) Cancer cell dependence on and expression of MYC are associated with greater sensitivity to the WNK inhibitor PP121. P-value from Pearson correlation. (E) Viability of MYC KO (HO15.19) or parental MYC WT (TGR-1) rat fibroblasts treated with PP121 at the indicated concentrations. Three biological replicates per dose.
Figure 5.
Figure 5.. Context-specific and differential coessentiality network analysis identifies MAPK pathway rewiring by BRAF mutations.
(A) Schematic illustration of several key proteins in the MAPK signaling pathway. Genes in the pathway have multiple paralogs; highlighted paralogs in subsequent graphs for Ras, Raf, MEK, and ERK are KRAS, BRAF, MAP2K1, and MAPK1. (B) Ranked Pearson correlations of critical MAPK pathway genes in cell lines without a BRAF mutation (BRAF-WT; n = 643) or with a BRAF missense mutation (n = 96). Ranks are used to make Pearson correlations directly comparable with different sample sizes. Modules featuring differential correlations are highlighted. (C) Bottom-up coessentiality networks for select MAPK pathway genes reveals tight interconnections between all pathway members in BRAF-WT cells but a discordant relationship between genes upstream of BRAF in BRAF-mutant lines. Differential network analysis highlights relationships lost in BRAF-mutant cells, such as that between EGFR and BRAF, explaining the obscured signal in pan-cancer coessentiality analysis for these genes.
Figure 6.
Figure 6.. Integration of multiomic data reveals increased HSF1 dependence in a biosynthetically active subset of acute myeloid leukemia (AML).
(A) The HSF1 coessentiality network, comprising positive connections to rank 30 and 5 potential secondary nodes per gene, is enriched for genes involved in the heat shock cytosolic proteostasis response. P-value from hypergeometric test. (B) Creation of mRNA, protein, and metabolite signatures of HSF1-dependence (lines with >75th percentile essentiality versus <25th percentile essentiality) across cancer subsets containing at least 10 cell lines. Enrichment P-values (hypergeometric overlap test) for the most enriched signatures in each subset are shown. (C) Integration of cancer cell line encyclopedia multiomic data to characterize AML cell l`ines stratified by HSF1 dependence (upper versus lower quartile) reveals that HSF1 is most essential in a biosynthetically active subset of AML cell lines. (D) The mRNA signature of translation and HSF1-dependence in AML stratifies AML patients into distinct prognostic groups. P-value from Cox proportional hazards test.
Figure S4.
Figure S4.. Consistent correlation between HSF1 essentiality and protein folding gene essentiality across major cell lineages and cancer subsets.
The heat shock/protein folding module signature queried were those genes enriched from the HSF1 pan-cancer coessentiality network in Fig 6A (i.e., HSPA14, HSPA4, HSF2, DNAJB6, ANKRD49, FKBPL, and PTGES3). Spearman correlation.
Figure S5.
Figure S5.. Performance of correlation matrices derived from subsets of cell lines within a lineage.
Cell lines from the bone lineage (n = 29) were randomly sampled 50 times at each threshold, from three cell lines to 28 cell lines. (A) Proportion of genes whose top 50 coessentiality network members, as defined by the whole-lineage coessentiality analysis, were still highly coessential (average correlation rank, top decile) in the subsampled dataset at different sampling thresholds. (B) The mean absolute difference (error) in rank position for genes in full-sample network as compared with the subsampled dataset.

References

    1. Alasady MJ, Mendillo ML (2020) The multifaceted role of HSF1 in tumorigenesis. Adv Exp Med Biol 1243: 69–85. 10.1007/978-3-030-40204-4_5 - DOI - PMC - PubMed
    1. Bandyopadhyay S, Mehta M, Kuo D, Sung MK, Chuang R, Jaehnig EJ, Bodenmiller B, Licon K, Copeland W, Shales M, et al. (2010) Rewiring of genetic networks in response to DNA damage. Science 330: 1385–1389. 10.1126/science.1195618 - DOI - PMC - PubMed
    1. Bayraktar EC, La K, Karpman K, Unlu G, Ozerdem C, Ritter DJ, Alwaseem H, Molina H, Hoffmann H-H, Millner A, et al. (2020) Metabolic coessentiality mapping identifies C12orf49 as a regulator of SREBP processing and cholesterol metabolism. Nat Metab 2: 487–498. 10.1038/s42255-020-0206-9 - DOI - PMC - PubMed
    1. Blondel VD, Guillaume JL, Lambiotte R, Lefebvre E (2008) Fast unfolding of communities in large networks. J Stat Mech Theor Exp 2008: P10008 10.1088/1742-5468/2008/10/p10008:P100008 - DOI
    1. Boone C, Bussey H, Andrews BJ (2007) Exploring genetic interactions and networks with yeast. Nat Rev Genet 8: 437–449. 10.1038/nrg2085 - DOI - PubMed

Publication types

LinkOut - more resources