. 2020 Dec 29;117(52):33639-33648.
doi: 10.1073/pnas.2013663117. Epub 2020 Dec 16.

Synaptic plasticity rules with physiological calcium levels

Affiliations

Synaptic plasticity rules with physiological calcium levels

Yanis Inglebert et al. Proc Natl Acad Sci U S A. .

Abstract

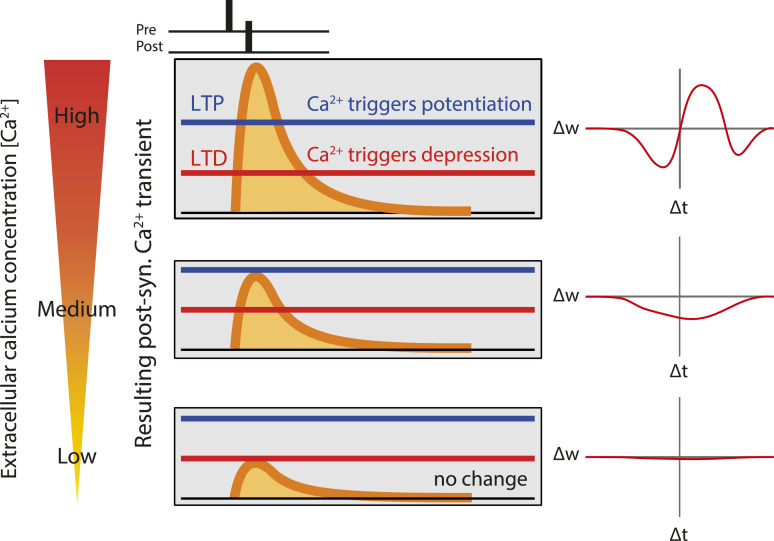
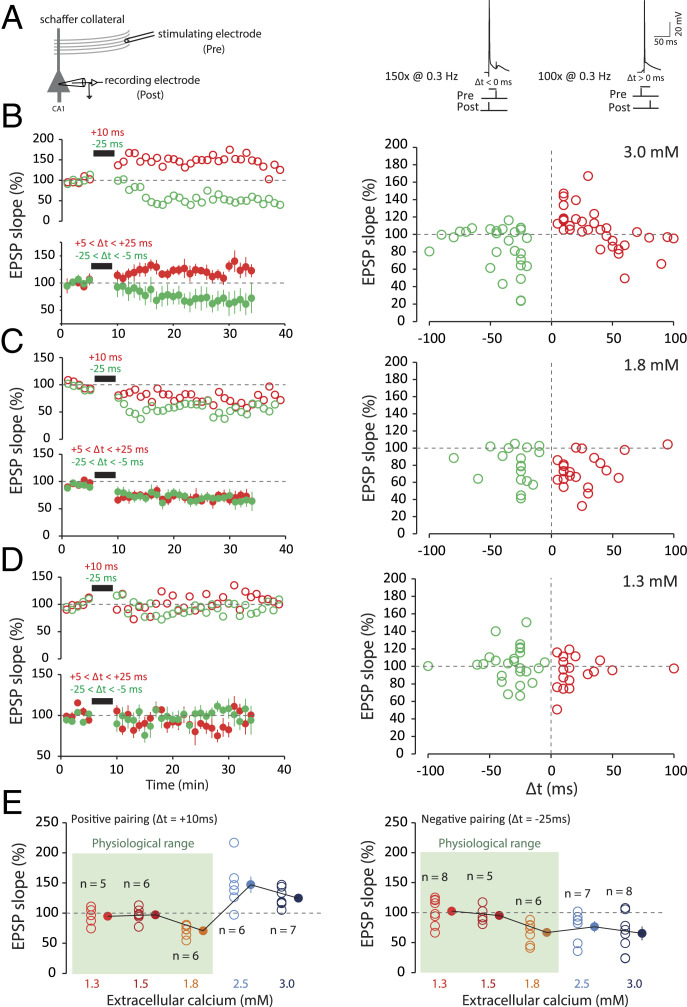
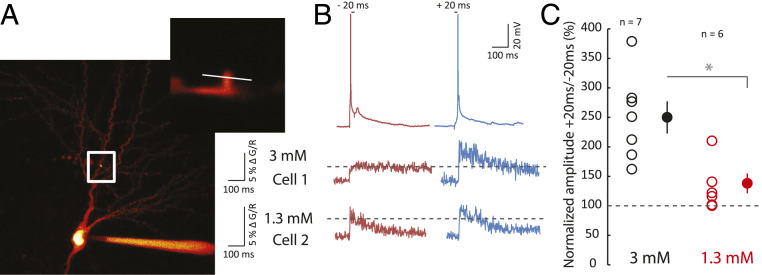
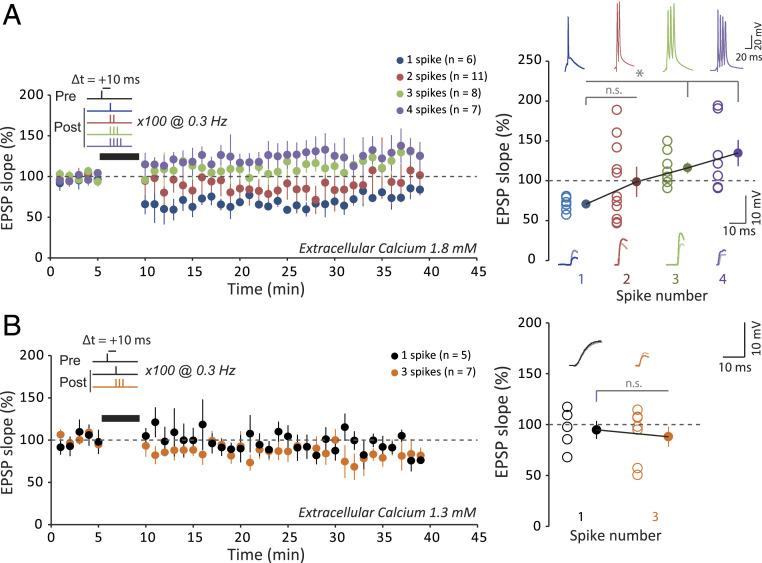
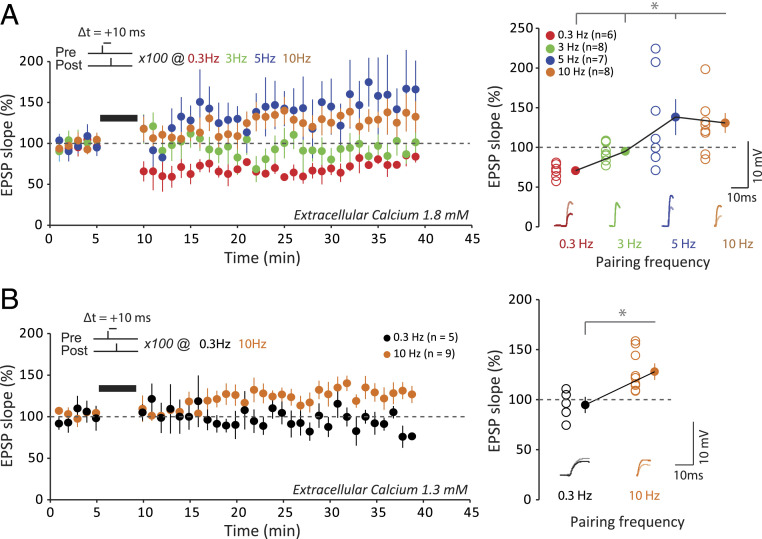
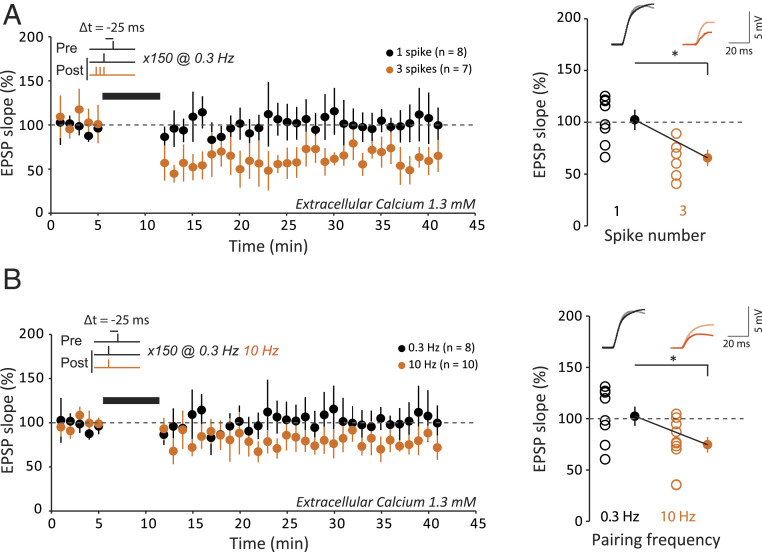
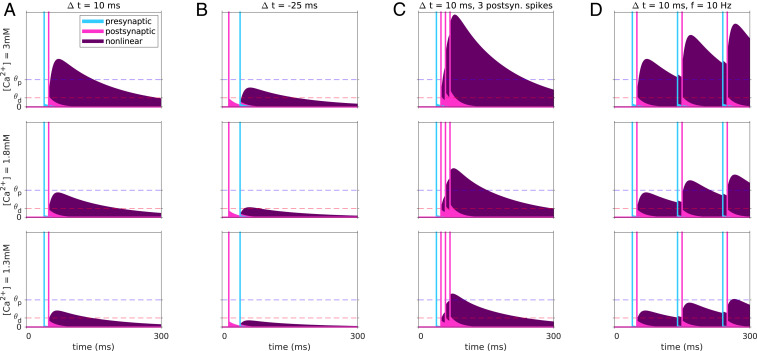
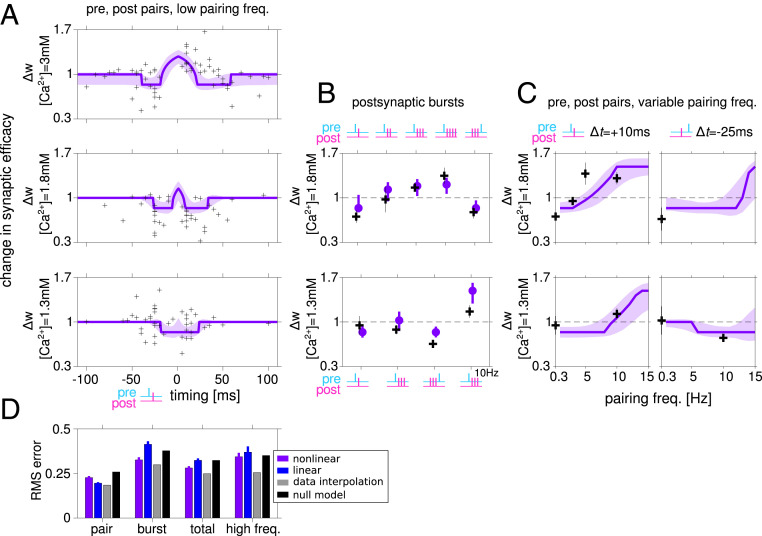
Spike-timing-dependent plasticity (STDP) is considered as a primary mechanism underlying formation of new memories during learning. Despite the growing interest in activity-dependent plasticity, it is still unclear whether synaptic plasticity rules inferred from in vitro experiments are correct in physiological conditions. The abnormally high calcium concentration used in in vitro studies of STDP suggests that in vivo plasticity rules may differ significantly from in vitro experiments, especially since STDP depends strongly on calcium for induction. We therefore studied here the influence of extracellular calcium on synaptic plasticity. Using a combination of experimental (patch-clamp recording and Ca2+ imaging at CA3-CA1 synapses) and theoretical approaches, we show here that the classic STDP rule in which pairs of single pre- and postsynaptic action potentials induce synaptic modifications is not valid in the physiological Ca2+ range. Rather, we found that these pairs of single stimuli are unable to induce any synaptic modification in 1.3 and 1.5 mM calcium and lead to depression in 1.8 mM. Plasticity can only be recovered when bursts of postsynaptic spikes are used, or when neurons fire at sufficiently high frequency. In conclusion, the STDP rule is profoundly altered in physiological Ca2+, but specific activity regimes restore a classical STDP profile.

Keywords: STDP; computational model; hippocampus; plasticity.


Conflict of interest statement

The authors declare no competing interest.

Figures

Fig. 1.
Fig. 1.
Prediction of a calcium-based model of spike-timing–dependent plasticity. Cartoon showing qualitatively calcium transients induced by pairing a presynaptic spike with a postsynaptic spike with a delay ∆t, for three extracellular calcium concentrations (high on top, low on the bottom). Synaptic changes depend on two plasticity thresholds, one for LTP (blue) and one for LTD (red). The resulting 'STDP curves' (change in synaptic stength ∆w as a function of ∆t) are shown on the right. At high extracellular calcium, the calcium transient exceeds LTP threshold in a range of positive ∆ts, and the STDP curves has a LTP window surrounded by two LTD windows. Decreasing extracellular calcium leads to a decrease in the amplitude of the calcium transient, which no longer cross the LTP threshold, resulting in a STDP curve with only LTD. Finally, a further reduction in extracellular calcium leads to no threshold crossing, and consequently no synaptic changes.
Fig. 2.
Fig. 2.
STDP under various external calcium concentrations. (A) t-LTP and t-LTD are induced at low frequency (0.3 Hz). The pre-post protocol is repeated 100 times, while the post-pre protocol is repeated 150 times. The action potential is induced by the injection of a depolarizing current into a CA1 neuron recorded in a whole-cell configuration. The EPSP is evoked by a stimulation electrode placed in the Schaffer collaterals. The delay (Δt) is varied according to the experiments. (B) In 3 mM extracellular calcium, a pre-post protocol (positive delays; +5 < Δt < +25 ms; red) leads to t-LTP and a post-pre (negative delays; −25 < Δt < −5 ms; green) protocol leads to t-LTD. Note the presence of a second t-LTD window at around +40/+60 ms. To facilitate comparison between the data, the duration of the negative pairing has been set to that of the positive pairing. (C) In 1.8 mM extracellular calcium, both pre-post protocols (+5 < Δt < +25 ms; red) and post-pre protocols (−25 < Δt < −5 ms; green) lead to t-LTD. The t-LTP window is absent under these conditions. (D) In 1.3 mM extracellular calcium, on average, no plasticity is induced regardless of the delay. The t-LTP and t-LTD window are missing under these conditions. (E, Left) Synaptic changes for a pre-post protocol at +10 ms. No plasticity is induced for calcium concentrations of 1.3 and 1.5 mM. For 1.8 mM calcium, t-LTD is induced, while for 2.5, and 3 mM calcium, t-LTP is induced. (E, Right) Synaptic changes for a post-pre protocol at −25 ms. No plasticity is induced in 1.3 and 1.5 mM calcium. For 1.8, 2.5, and 3 mM calcium, t-LTD is induced. Note the difference between the results in the range of physiological calcium concentration (green squares) and the results in nonphysiological calcium concentration.
Fig. 3.
Fig. 3.
Calcium imaging. (A) Comparison of calcium spine entry during negative and positive pairing in 3 and 1.3 mM extracellular calcium. Calcium was measured in the spine of a CA1 pyramidal cell loaded with 50 µM Fluo-4. White square, location of enlarged area. The white line indicates the line scan on the dendritic spine. (B) Each neuron was alternatively tested for negative (Δt = −20 ms) and positive pairing (Δt = +20 ms). Cell 1 recorded in 3 mM calcium displays a much larger influx of calcium in response to positive pairing than negative pairing. Cell 2 recorded in 1.3 mM calcium displays an almost equal calcium rise. (C) Pooled data of the normalized ratio of calcium evoked by positive pairing over negative pairing (*P < 0.01, Mann–Whitney U test).
Fig. 4.
Fig. 4.
Recovery of t-LTP with increasing spike number. (A) Role of postsynaptic spike number for inducing synaptic changes by a pre-post protocol at +10 ms in 1.8 mM extracellular calcium. With only one action potential (blue), t-LTD is induced. With two action potentials (red), on average, no plasticity is induced. Note the large variability in the plasticity. With three (green) or four (purple) action potentials, t-LTP is induced. The increase in the number of postsynaptic action potential allows t-LTP to be restored. (B) Role of postsynaptic spike number for inducing synaptic changes by a pre-post protocol at +10 ms in 1.3 mM extracellular calcium. With only one action potential (black), no plasticity is induced. With three action potentials (orange), t-LTP does not recover. *P < 0.01; n.s., not significant.
Fig. 5.
Fig. 5.
Recovery of t-LTP with increasing pairing frequency. (A) Effects of the stimulation frequency on synaptic changes induced by a pre-post protocol at +10 ms with a single postsynaptic action potential in 1.8 mM extracellular calcium. For 0.3 Hz, t-LTD is induced. For 3 Hz, no synaptic changes are induced. For 5 or 10 Hz, t-LTP is induced. Increasing the pairing frequency restores t-LTP. To facilitate the comparison between the data, the first time point after pairing at 3, 5, and 10 Hz has been set to that at 0.3 Hz. *P < 0.02. (B) Effects of the stimulation frequency on synaptic changes induced by a pre-post protocol at +10 ms with a single postsynaptic action potential in 1.3 mM extracellular calcium. For 0.3 Hz, no synaptic change is induced. For 10 Hz, t-LTP is induced. Increasing the pairing frequency restores t-LTP. To facilitate the comparison between the data, the first time point after pairing at 10 Hz has been set to that at 0.3 Hz. *P < 0.01.
Fig. 6.
Fig. 6.
Recovery of t-LTD in 1.3 mM. (A) Role of postsynaptic spike number on synaptic changes induced by a post-pre protocol at −25 ms at a pairing frequency of 0.3 Hz in 1.3 mM extracellular calcium. For a single action potential, no change is induced (black). For three action potentials, t-LTD is induced (orange). Thus, increasing the number of postsynaptic action potentials allows t-LTD to recover. *P < 0.01. (B) Effects of stimulation frequency on the induction of synaptic plasticity by a post-pre protocol at −25 ms with a single postsynaptic action potential in 1.3 mM extracellular calcium. For 0.3 Hz, no change is induced (black). For 10 Hz, t-LTD is induced (orange). Thus, increasing pairing frequency allows t-LTD to recover. To facilitate the comparison between the data, the first time point after pairing at 10 Hz has been set to that at 0.3 Hz. *P < 0.01.
Fig. 7.
Fig. 7.
Dependence of calcium transients of nonlinear plasticity model on the stimulation protocol and on the extracellular calcium concentration. Example model calcium transients resulting from a single pre-post pairing at Δt = 10 ms (A) and Δt = −25 ms (B), a presynaptic spike paired with a burst of three postsynaptic spikes (C), and a pre-post pair repeated at a frequency of 10 Hz (D). Transients for all stimulation protocols are shown for the three extracellular calcium concentrations used in the experiment (rows). The linear pre- and postsynaptic contributions are shown in cyan and magenta, respectively, together with the spike times indicated by the vertical lines. The nonlinear contribution is shown in purple. The transients depend strongly on the relative timing of pre- and postsynaptic activity, primarily due to the model’s nonlinearity. The long decay timescale of the nonlinear term implies that calcium returns to baseline slowly and thus may accumulate for induction protocols with high pairing frequencies.
Fig. 8.
Fig. 8.
A nonlinear calcium-based plasticity model fits well the plasticity results at multiple concentrations and using multiple induction protocols. (A) Model fit to the STDP data at [Ca2+] = 3, 1.8, and 1.3 mM (purple). Each measured synapse is represented by a black cross. Shaded area indicates the SD around the mean obtained by generating predictions using parameter sets in the neighborhood of the best fitting model (SI Appendix). (B) Experimental results and model predictions for protocols with postsynaptic burst stimuli. At [Ca2+] = 1.8 mM (Top), the model captures the change in sign of plasticity as a function of the number of spikes in the postsynaptic burst, and the reverse in sign when a postsynaptic burst of three spikes precedes a presynaptic spike. At [Ca2+] = 1.3 mM (Bottom), LTD is restored at a low pairing frequency by a burst of three postsynaptic spikes (regardless if they arrive closely before or after the presynaptic spike), compared to a spike-pair protocol where no significant change was observed, which is captured by the model. (C) Experimental results and model predictions for protocols at variable pairing frequencies. For spike pair protocols with Δt = 10 ms, the resulting plasticity depends strongly on the pairing frequency. At [Ca2+] = 1.8 mM (Top) the model accurately predicts the frequency at which plasticity switches sign. At [Ca2+] = 1.3 mM the model correctly predicts the change in sign of plasticity when pre- and postsynaptic spikes are paired at 10 Hz with positive/negative relative timing. (D) Root mean square (RMS) errors when the model predictions are compared to the spike-pair data, the bust data (only at a low pairing frequency of 0.3 Hz), and measurements of plasticity using high-frequency pairing protocols. Total error refers to the combined error for spike-pair and burst stimuli (at a low pairing frequency). Note that the model was fit using the spike-pair data. Among all fitted parameter sets, this figure shows results for the model with lowest combined spike-pair and burst protocols. Results from high-frequency protocols (C and parts of B) were not used in fitting or model selection. See SI Appendix, Fig. S6 for fit and predictions of the model with lowest RMS error on spike-pair data. Error bars for model results, predictions, and errors (D) are equal to the SD of the RMS error computed 200 times on subsets (80% of the data chosen randomly) of data points. Gray bars show estimates of the variability of the data, and black bars show the errors made by a null model (SI Appendix, Table S4).

References

    1. Dan Y., Poo M.-M., Spike timing-dependent plasticity of neural circuits. Neuron 44, 23–30 (2004). - PubMed
    1. Feldman D. E., The spike-timing dependence of plasticity. Neuron 75, 556–571 (2012). - PMC - PubMed
    1. Gustafsson B., Wigström H., Abraham W. C., Huang Y. Y., Long-term potentiation in the hippocampus using depolarizing current pulses as the conditioning stimulus to single volley synaptic potentials. J. Neurosci. 7, 774–780 (1987). - PMC - PubMed
    1. Markram H., Lübke J., Frotscher M., Sakmann B., Regulation of synaptic efficacy by coincidence of postsynaptic APs and EPSPs. Science 275, 213–215 (1997). - PubMed
    1. Debanne D., Gähwiler B. H., Thompson S. M., Long-term synaptic plasticity between pairs of individual CA3 pyramidal cells in rat hippocampal slice cultures. J. Physiol. 507, 237–247 (1998). - PMC - PubMed

Publication types