. 2020 Dec 16;12(574):eaax3519.
doi: 10.1126/scitranslmed.aax3519.

Chi3l1/YKL-40 is controlled by the astrocyte circadian clock and regulates neuroinflammation and Alzheimer's disease pathogenesis

Affiliations

Chi3l1/YKL-40 is controlled by the astrocyte circadian clock and regulates neuroinflammation and Alzheimer's disease pathogenesis

Brian V Lananna et al. Sci Transl Med. .

Abstract

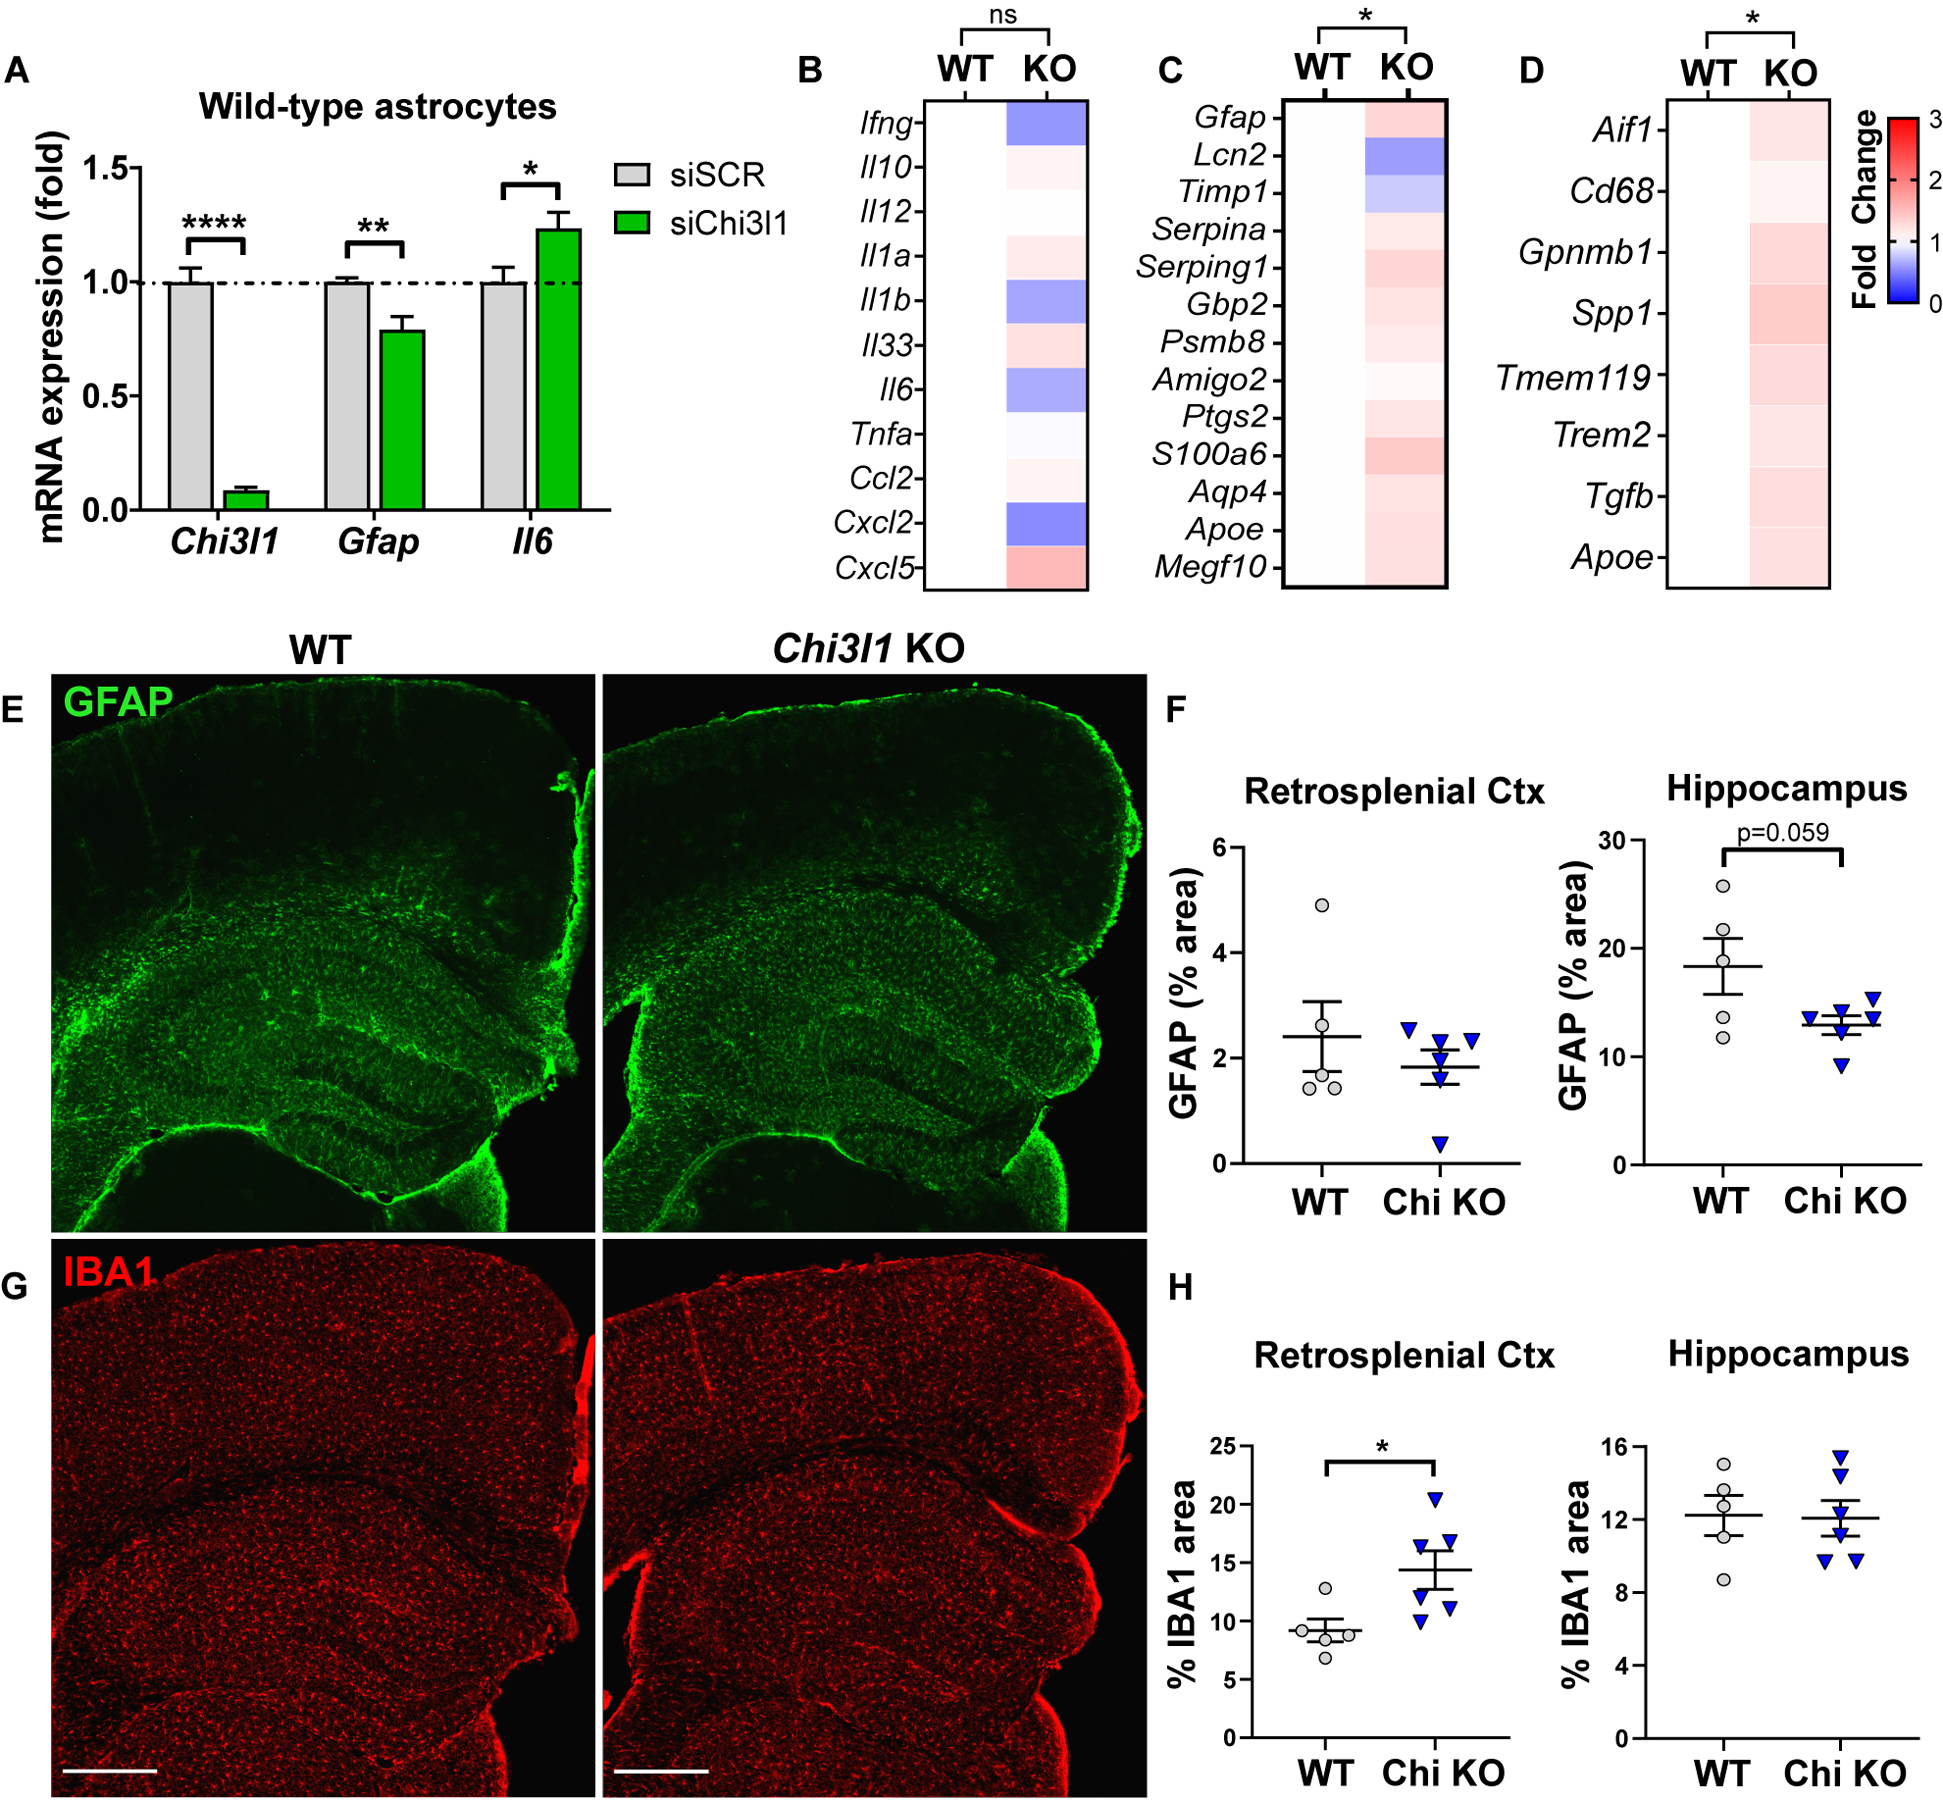
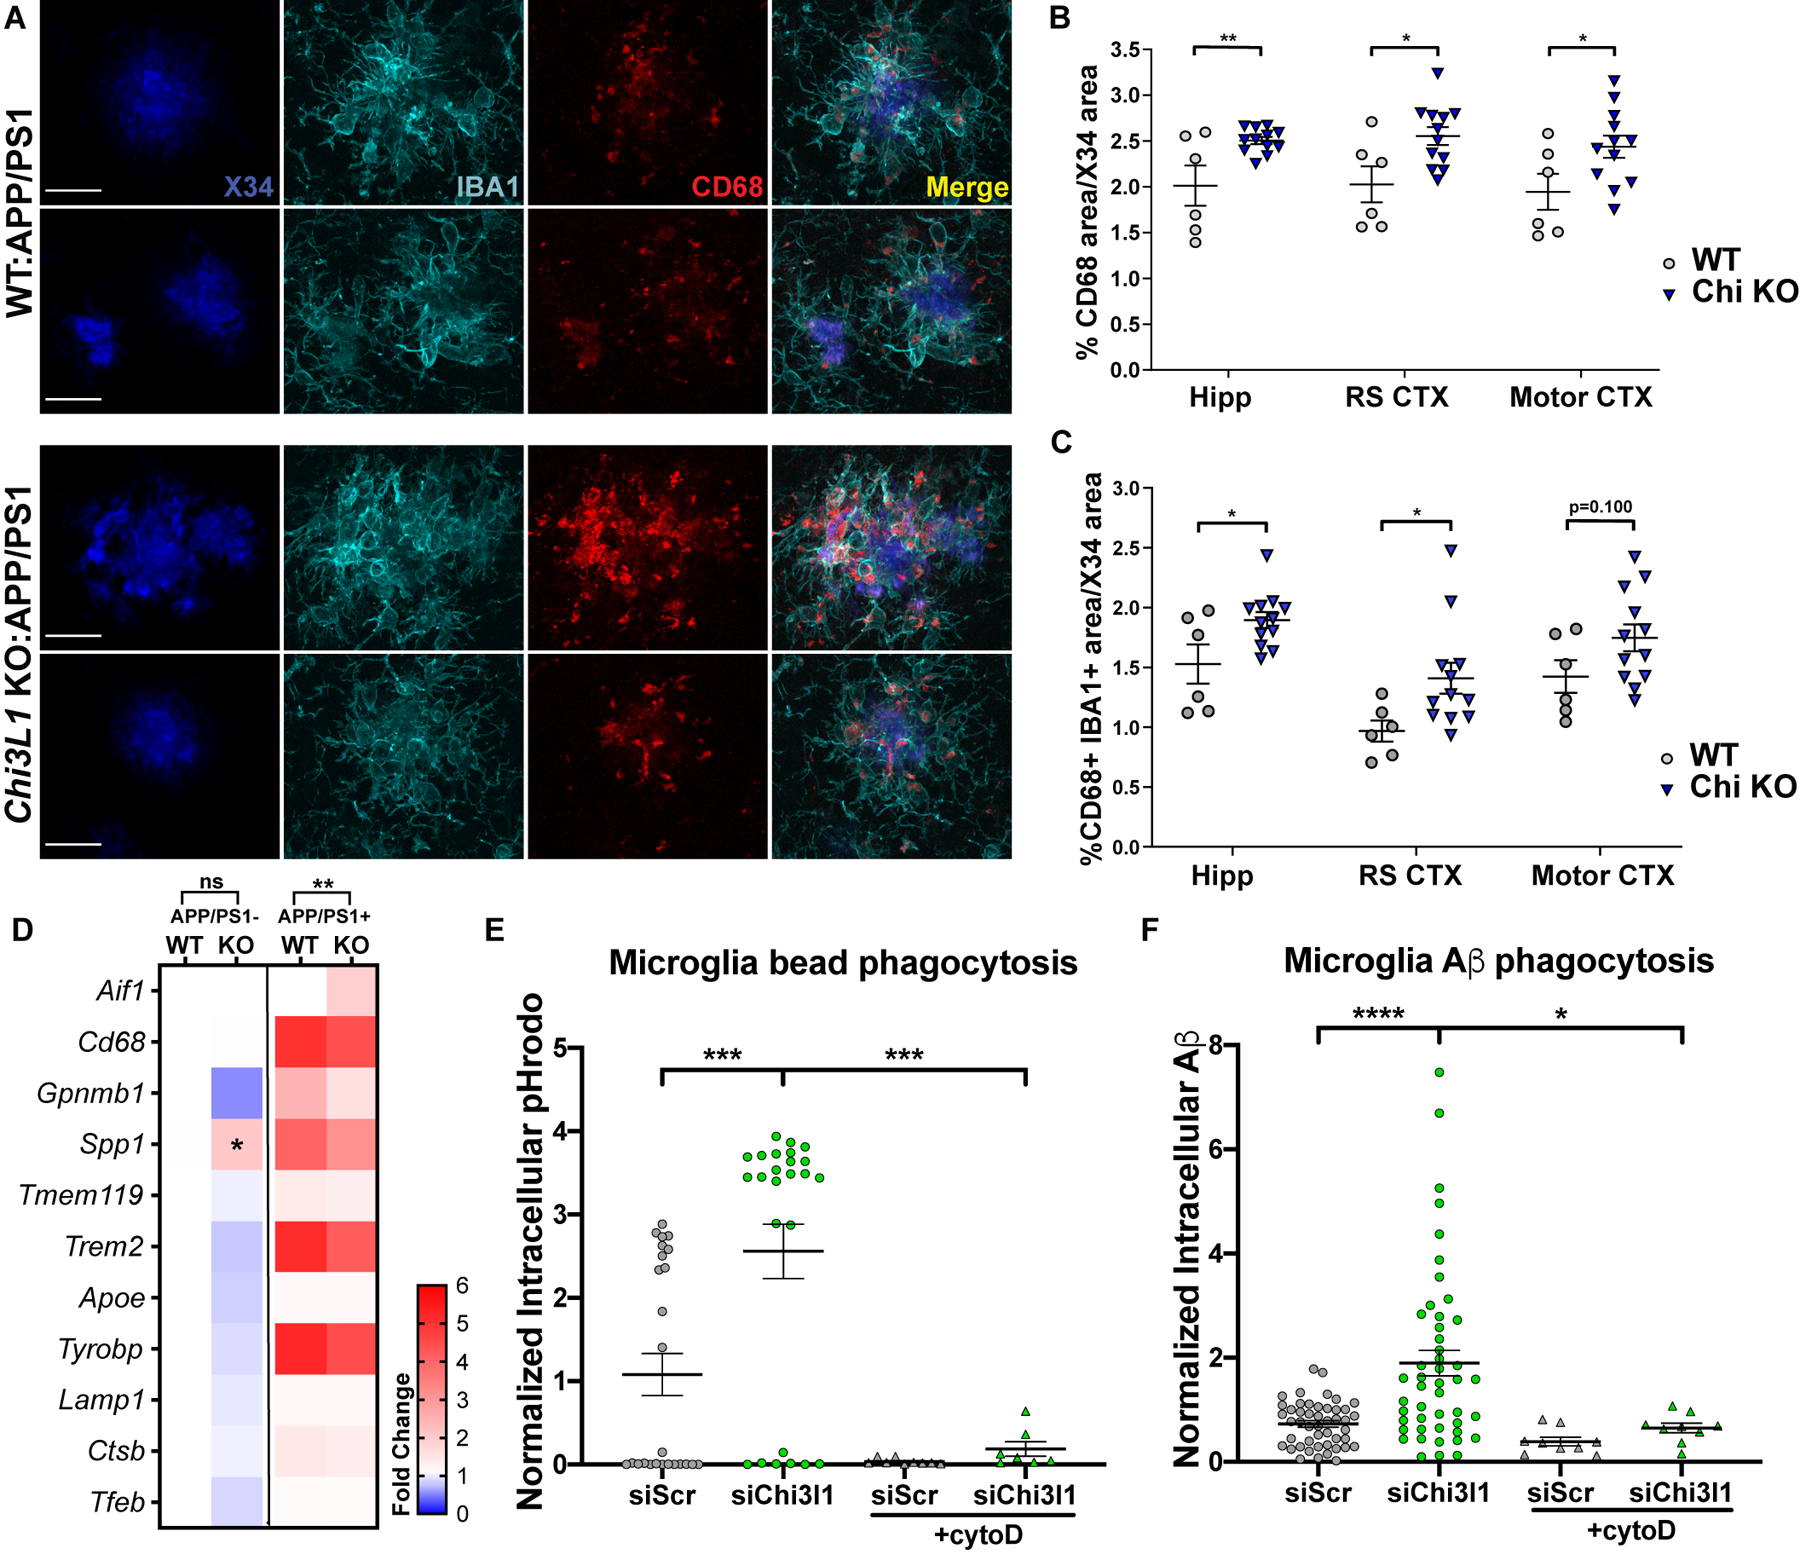
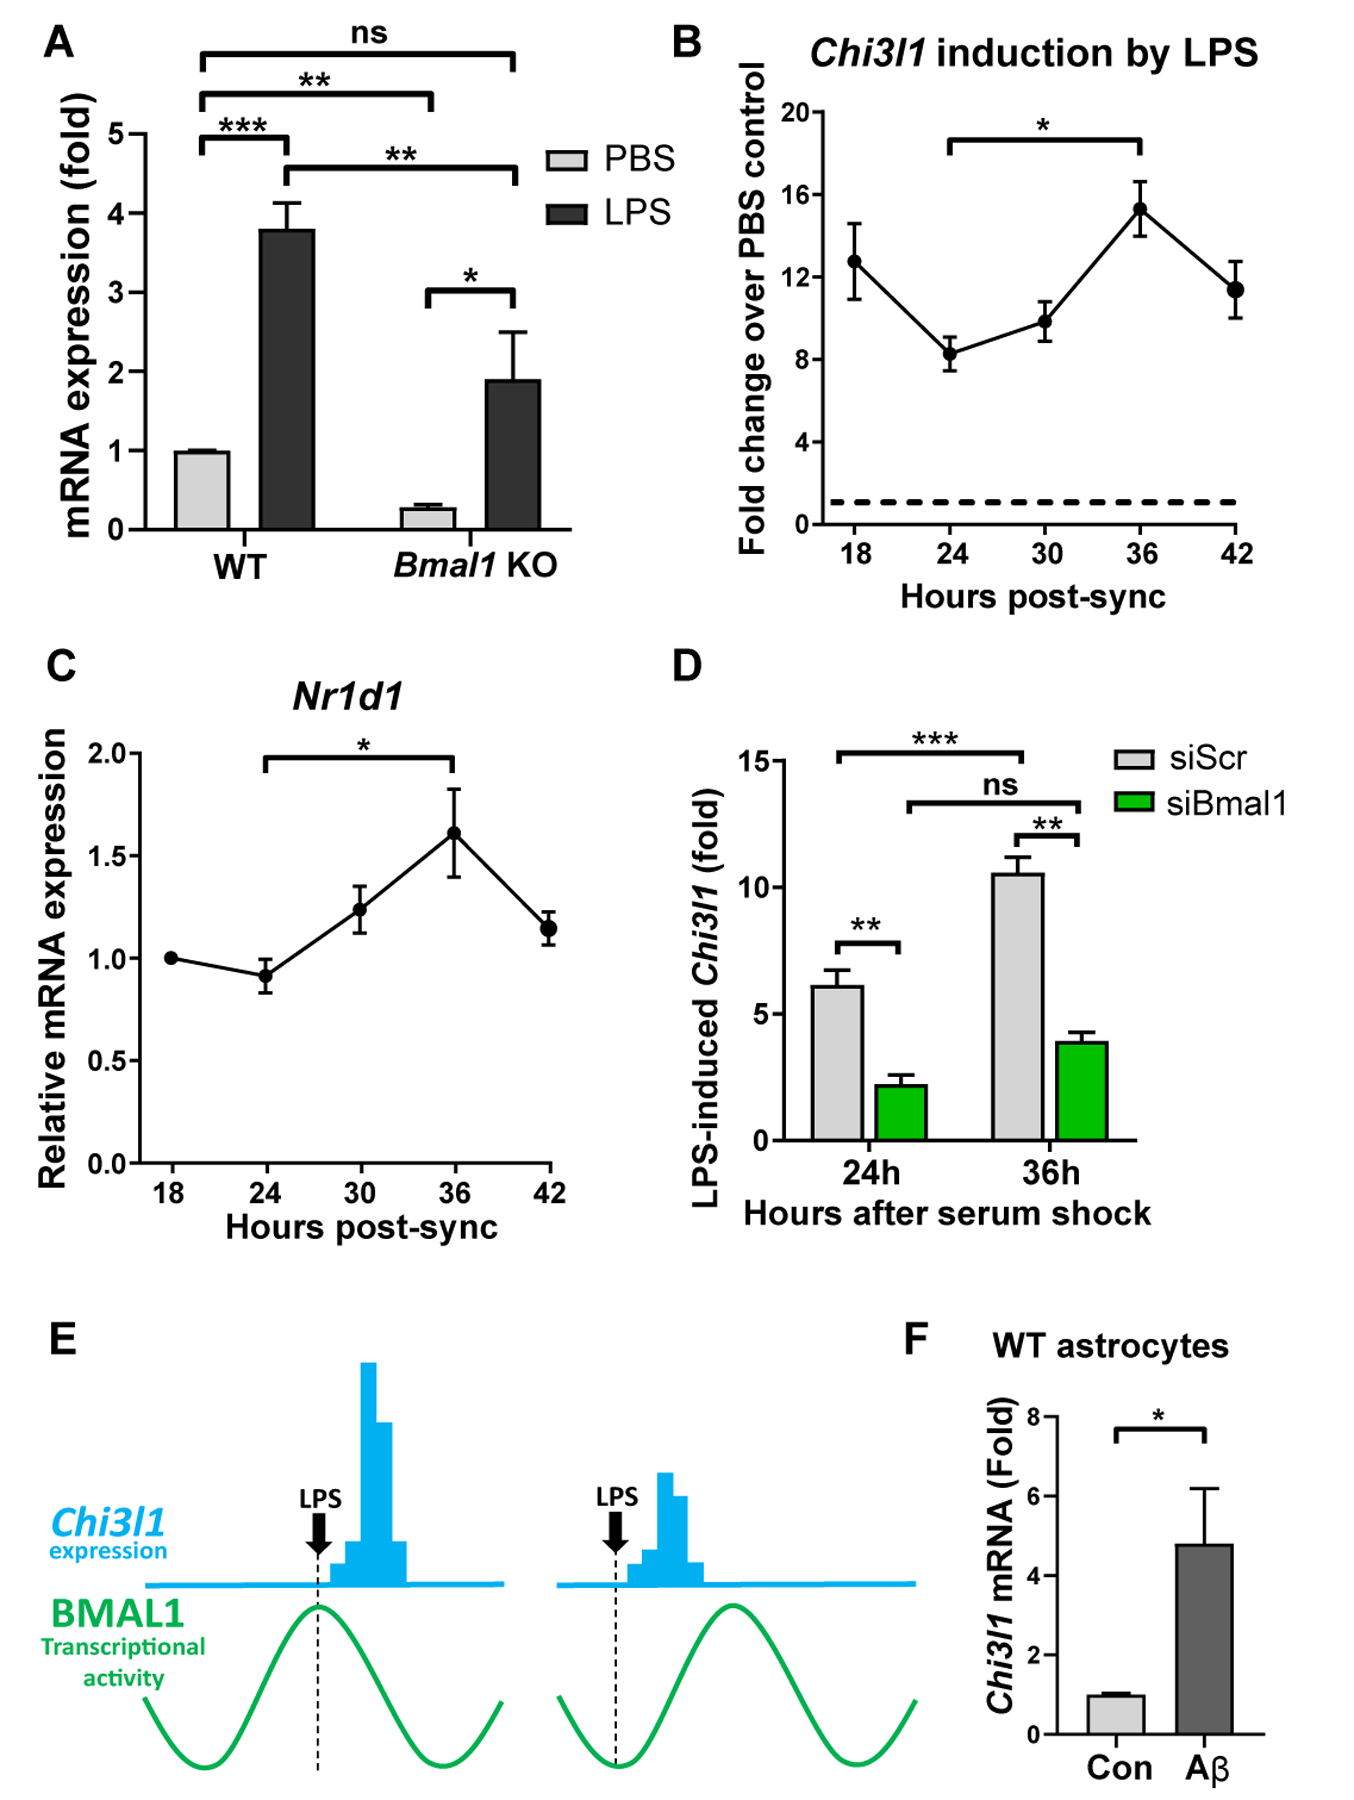
Regulation of glial activation and neuroinflammation are critical factors in the pathogenesis of Alzheimer's disease (AD). YKL-40, a primarily astrocytic protein encoded by the gene Chi3l1, is a widely studied cerebrospinal fluid biomarker that increases with aging and early in AD. However, the function of Chi3l1/YKL-40 in AD is unknown. In a cohort of patients with AD, we observed that a variant in the human CHI3L1 gene, which results in decreased CSF YKL-40 expression, was associated with slower AD progression. At baseline, Chi3l1 deletion in mice had no effect on astrocyte activation while modestly promoting microglial activation. In a mouse APP/PS1 model of AD, Chi3l1 deletion decreased amyloid plaque burden and increased periplaque expression of the microglial lysosomal marker CD68, suggesting that Chi3l1 may suppress glial phagocytic activation and promote amyloid accumulation. Accordingly, Chi3l1 knockdown increased phagocytosis of zymosan particles and of β-amyloid peptide in both astrocytes and microglia in vitro. We further observed that expression of Chi3l1 is regulated by the circadian clock, as deletion of the core clock proteins BMAL1 or CLOCK/NPAS2 strongly suppresses basal Chi3l1 expression, whereas deletion of the negative clock regulators PER1/PER2 increased Chi3l1 expression. Basal Chi3l1 mRNA was nonrhythmic because of a long mRNA half-life in astrocytes. However, inflammatory induction of Chi3l1 was gated by the clock. Our findings reveal Chi3l1/YKL-40 as a modulator of glial phagocytic activation and AD pathogenesis in both mice and humans and suggest that the astrocyte circadian clock regulates inflammatory Chi3l1 induction.


Conflict of interest statement

Competing interests: The authors report no financial competing interests. ESM has consulted for Eisai Pharmacauticals. No patents related to this work are pending.

Figures

Figure 1.
Figure 1.. A polymorphism in human CHI3L1 impacts rate of AD progression.
A. Single nucleus RNAseq tSNE plot showing cell clusters (top panel) or CHI3L1 expression (purple, bottom panel). Ex = excitatory neuron, In = Inhibitory neuron, OPC = oligodendrocyte precursor cells, Endo = endothelial cells. Data available at http://ngi.pub/snuclRNA-seq/. B. CHI3L1 expression by cell cluster from data in (A). ****P=3×10−280. C. AD progression (change in CDR-SB) from human patients with and without the CC_TT polymorphism of the Rs10399931 SNP in CHI3L1.
Figure 2.
Figure 2.. Loss of Chi3l1 mildly shifts glial activation.
A. qPCR gene expression from primary astrocytes transfected with control (siScr) or Chi3l1 (siChi3l1) siRNA. n = 6–10 replicates from 3 independent experiments. B–D. Cytokine and chemokine (B), astrocyte activation marker (C) or microglia activation marker (D) expression from fluidigm qPCR of 2–5mo Chi3l1−/− and WT control mouse cortex 6 hours after i.p. PBS. Mean of 6 mice/group normalized to WT. Two-way ANOVA with Tukey correction for multiple comparisons. E–H. Representative images depicting GFAP (astrocyte) staining (E) and associated quantification (F) or IBA1 (microglia) staining (G) and associated quantification (H) in Chi3l1−/− and WT control mice. Scale bar = 400μm All data represent mean +/− SEM. *p < 0.05, **p < 0.01, ****p < 0.0001 by two-tailed students t-test with Holm-Sidak correction for multiple comparisons when appropriate.
Figure 3.
Figure 3.. Loss of Chi3l1 mitigates amyloid pathology.
A. Representative hippocampal images from 8mo Chi3l1−/−:APP/PS1+ and APP/PS1+ control mice depicting staining by X34 (fibrillar plaques), HJ3.4 antibody (total Aβ), and subtraction of fibrillar (X34) from total (HJ3.4) Aβ. Hippocampus outlined in yellow. Yellow rectangle denotes region of inset in (B). Scale bar = 300μm B. Representative higher magnification images depicting stains from (A). “Halo” of non-fibrillar Aβ surrounding fibrillar plaque core (X34) substantially reduced in Chi3l1−/− mice. Scale bar = 50μm C–F. Quantification of X34+ puncta (fibrillar plaque number) (C), X34+ area (fibrillar Aβ) (D), HJ3.4+ area (total Aβ) (E), or area covered by non-fibrillar Aβ (total Aβ in HJ3.4 - fibrillar X34) (F) in hippocampal staining from (A). G. X34 and HJ3.4 colocalization (top) with 3D surface rendering of X34 (red) and HJ3.4 (green) staining (middle) with 20μm shells (pink) around each fibrillar plaque. Scale bar = 30μm H. Quantification of non-fibrillar plaque volume as ratio of HJ3.4 to X34 (top) or total Aβ in HJ3.4 - fibrillar X34 (bottom) in 20μm shell surrounding each X34+ plaque in subset of mice from (C)-(F). Data points represent average of 2–4 sections/mouse, 4–6 (Chi3l1+/+) and 4–12 (Chi3l1−/−:) mice per group. All data represent mean +/− SEM. *p < 0.05, **p < 0.01, ***p < 0.001 by two-tailed students t-test.
Figure 4.
Figure 4.. Loss of Chi3l1 mitigates astrogliosis, but facilitates phagocytosis in the presence of Aβ.
A. Representative high magnification images from hippocampi of 8 mo Chi3l1−/−:APP/PS1+ and APP/PS1+ control mice stained for X34 (fibrillar plaques) and GFAP (astrocytes). Scale bar = 20μm B–C. Quantification of GFAP coverage (B) or GFAP coverage normalized to X34+ area in same section (C) from mice in (A). Quantified from widefield image in Fig. S5. RS = retrosplenial. n = 6 (Chi3l1+/+) and 12 (Chi3l1−/−:) mice per group. D. Astrocyte activation marker gene expression from fluidigm qPCR of 8 mo Chi3l1−/−:APP/PS1−, WT:APP/PS1−, Chi3l1−/−:APP/PS1+, and APP/PS1+ control mouse hippocampus. Mean of 4 mice (APP/PS1−) or 6–10 (APP/PS1+) mice per group normalized to WT:APP/PS1−. Two-way ANOVA with Tukey correction for multiple comparisons. E–F. pHrodo-labeled zymosan bead (E) or TAMRA-Aβ (F) uptake by primary astrocyte cultures transfected with control (siSCR) or Chi3l1 (siChi3l1) siRNA, +/− cytochalasin D to inhibit phagocytosis (+cytoD). Each point represents one field of view with an average of 804 (E) or 517 (F) cells/field. Data from 2 independent experiments. All data represent mean +/− SEM. *p < 0.05, **p < 0.01, ***p < 0.001, ****p < 0.0001. Analyzed by two-tailed students t-test (B–C) or one-way ANOVA (E-F). All data subjected to Sidak correction for multiple comparisons unless otherwise noted.
Figure 5.
Figure 5.. Loss of Chi3l1 alters microglial activation and enhances Aβ phagocytosis.
A. Representative high magnification images from hippocampi of 8 mo Chi3l1−/−:APP/PS1+ and APP/PS1+ control mice stained for X34 (fibrillar plaques), IBA1 (microglia), and CD68 (phagocytic microglia). Scale bar = 20μm B–C. Quantification of CD68 (B) or colocalized IBA1/CD68 (C) from mice in (A) normalized to X34+ area in same section. Quantified from widefield image in Fig. S6. n = 6 (Chi3l1+/+) and 12 (Chi3l1−/−) mice per group. RS = retrosplenial D. Microglia-associated gene expression from Fluidigm qPCR of 8 mo Chi3l1−/−:APP/PS1−, WT:APP/PS1−, Chi3l1−/−:APP/PS1+ and APP/PS1+ control mouse hippocampus. Mean of 4 mice (APP/PS1−) or 6–10 (APP/PS1+) mice per group normalized to WT:APP/PS1−. Two-way ANOVA with Tukey correction for multiple comparisons E–F. pHrodo-labeled zymosan bead (E) or TAMRA-Aβ (F) uptake by primary microglia cultures transfected with control (siSCR) or Chi3l1 (siChi3l1) siRNA, +/− cytochalasin D to inhibit phagocytosis (+cytoD). Each point represents one field of view with an average of 209 (E) or 56 (F) cells/field. Data from 2 (E) or 1 (F) independent experiments. All data represent mean +/− SEM. *p < 0.05, **p < 0.01, ***p < 0.001. Analyzed by two-tailed students t-test (B–C) or one-way ANOVA (E–F). All data subjected to Sidak correction for multiple comparisons unless otherwise noted.
Figure 6.
Figure 6.. Chi3l1 is regulated by the circadian clock.
A. Microarray in Nestin-Cre;Bmal1f/f and Per1/2mut vs control, Bmal1f/f cortex (Lananna et al, 2018) cross referenced with 50 genes most upregulated in astrocytes with in vivo LPS (Zamanian et al, 2012). CT = clock time. B. Microarray data from (A) with 2 additional timepoints for Cre- and Per1/2mut mice. C. qPCR depicting gene expression in global Npas2 KO, Clock KO, Clock/Npas2 double KO or Bmal1 KO mouse cortex. n = 2 mice/group, normalized to WT control. D–F. qPCR showing Chi3l1 expression from Aldh1l1-Cre;Bmal1f/f (ALC) hippocampus (D) or Cx3cr1-Cre;Bmal1f/f (CX3) cortex (E), or gene expression from WT primary astrocytes 4–8 days after transfection with control (siSCR) or Bmal1 (siBmal1) siRNA (F). n = 3 mice/group (D), 6–8 mice/group (E), or 15 biological replicates from 5 independent experiments (F). G. ELISA of Chi3l1 protein (YKL-40) in culture medium of WT primary astrocytes 6 days after transfection with control (siSCR) or Bmal1 (siBmal1) siRNA. n = 3 biological replicates/group. H. ChIP-qPCR from mouse primary astrocytes with anti-BMAL1 antibody or IgG control. Three distinct E-box-containing regions in the Chi3l1 promoter were assayed. A known BMAL1 binding E-box-containing region in the Dbp promoter was assayed as positive control. I. qPCR showing expression of Chi3l1 and Bmal1 mRNA in primary mouse astrocytes treated with actinomycin D at 0 hours, then harvested at intervals thereafter. n = 3 wells/timepoint, normalized to Actb mRNA. *p<0.05 compared to timepoint 0 All data represent mean +/− SEM. *p < 0.05, **p < 0.01, ****p < 0.0001 by two-tailed students t-test with Holm-Sidak correction for multiple comparisons when appropriate.
Figure 7.
Figure 7.. Chi3l1 is induced during inflammation in a Bmal1 dependent manner.
A. qPCR showing gene expression from WT and Bmal1 KO primary astrocytes +/− 500ng/ml LPS for 6 hours. n = 5 independent experiments. B–C. qPCR showing LPS-induced Chi3l1 gene expression (B) or expression of Nr1d1 (C) in WT primary astrocytes synchronized with high serum shock. Cells were treated with 500 ng/ml LPS (B) or PBS (C) at designated timepoints and collected 3 hours after treatment. n = 6–9 replicates from 2–3 independent experiments per timepoint. Data normalized to basal Chi3l1 expression in PBS control cells (depicted by dashed line) (B) or expression at 18 hours (C). Main effect p = 0.0150 (B), p = 0.0013 (C). Multiple comparison tests depicted on graphs. D. qPCR showing LPS-induced Chi3l1 expression in WT primary astrocytes after transfection with control (siSCR) or Bmal1 (siBmal1) siRNA, treated with 500ng/ml LPS at 24h or 36h post-synchronization (as in (B)). n = 3 replicates/genotype/timepoint. E. Diagram depicting hypothesis that induction of Chi3l1 expression (blue) is dependent on the circadian phase of BMAL1 transcriptional activity (green curve). F. qPCR showing gene expression from WT primary astrocytes +/− 10μM Aβ fibrils for 48–72 hours. n = 6 replicates from 2 independent experiments. All data represent mean +/− SEM. *p < 0.05, **p < 0.01, ***p < 0.001. Analyzed by two-way ANOVA (A, D) or one-way ANOVA (B, C) with Tukey correction for multiple comparisons or two-tailed students t-test (F).

References

    1. Colonna M, Butovsky O, Microglia Function in the Central Nervous System During Health and Neurodegeneration. Annu Rev Immunol 35, 441–468 (2017). - PMC - PubMed
    1. Arranz AM, De Strooper B, The role of astroglia in Alzheimer’s disease: pathophysiology and clinical implications. Lancet Neurol, (2019). - PubMed
    1. Liddelow SA, Guttenplan KA, Clarke LE, Bennett FC, Bohlen CJ, Schirmer L, Bennett ML, Munch AE, Chung WS, Peterson TC, Wilton DK, Frouin A, Napier BA, Panicker N, Kumar M, Buckwalter MS, Rowitch DH, Dawson VL, Dawson TM, Stevens B, Barres BA, Neurotoxic reactive astrocytes are induced by activated microglia. Nature 541, 481–487 (2017). - PMC - PubMed
    1. Craig-Schapiro R, Perrin RJ, Roe CM, Xiong C, Carter D, Cairns NJ, Mintun MA, Peskind ER, Li G, Galasko DR, Clark CM, Quinn JF, D’Angelo G, Malone JP, Townsend RR, Morris JC, Fagan AM, Holtzman DM, YKL-40: a novel prognostic fluid biomarker for preclinical Alzheimer’s disease. Biological psychiatry 68, 903–912 (2010). - PMC - PubMed
    1. Sutphen CL, Jasielec MS, Shah AR, Macy EM, Xiong C, Vlassenko AG, Benzinger TL, Stoops EE, Vanderstichele HM, Brix B, Darby HD, Vandijck ML, Ladenson JH, Morris JC, Holtzman DM, Fagan AM, Longitudinal Cerebrospinal Fluid Biomarker Changes in Preclinical Alzheimer Disease During Middle Age. JAMA Neurol 72, 1029–1042 (2015). - PMC - PubMed

Publication types