. 2020 Dec 17;5(24):e140399.
doi: 10.1172/jci.insight.140399.

Identifying cell-enriched miRNAs in kidney injury and repair

Affiliations

Identifying cell-enriched miRNAs in kidney injury and repair

Katie L Connor et al. JCI Insight. .

Abstract

Small noncoding RNAs, miRNAs (miRNAs), are emerging as important modulators in the pathogenesis of kidney disease, with potential as biomarkers of kidney disease onset, progression, or therapeutic efficacy. Bulk tissue small RNA-sequencing (sRNA-Seq) and microarrays are widely used to identify dysregulated miRNA expression but are limited by the lack of precision regarding the cellular origin of the miRNA. In this study, we performed cell-specific sRNA-Seq on tubular cells, endothelial cells, PDGFR-β+ cells, and macrophages isolated from injured and repairing kidneys in the murine reversible unilateral ureteric obstruction model. We devised an unbiased bioinformatics pipeline to define the miRNA enrichment within these cell populations, constructing a miRNA catalog of injury and repair. Our analysis revealed that a significant proportion of cell-specific miRNAs in healthy animals were no longer specific following injury. We then applied this knowledge of the relative cell specificity of miRNAs to deconvolute bulk miRNA expression profiles in the renal cortex in murine models and human kidney disease. Finally, we used our data-driven approach to rationally select macrophage-enriched miR-16-5p and miR-18a-5p and demonstrate that they are promising urinary biomarkers of acute kidney injury in renal transplant recipients.

Keywords: Bioinformatics; Nephrology; Noncoding RNAs; Organ transplantation.


Conflict of interest statement

Conflict of interest: LD is a recipient of cofunding for PhD studentships from GlaxoSmithKline (GSK) and Regulus Therapeutics. JH is a recipient of cofunding for PhD studentships from GSK. BRC is a supervisor of a PhD studentship cofunded from GSK. OT is a recipient of a Biotechnology and Biosciences Research Council (BBSRC) PhD studentship cofunded by GSK. VS and COSS are formally employed by GSK. GMT and RBH are employees of GSK.

Figures

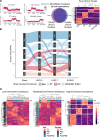
Figure 1
Figure 1. R-UUO model induces kidney injury followed by resolution.
(A) Schematic of the experimental process. Injury was induced by 2 or 7 days of UUO. After 7 days of UUO, ureteric reimplantation facilitates reversal of obstruction. At each time point proximal tubular cells, macrophages, endothelial cells, and PDGFR-β+ cells were isolated by fluorescence-activated cell sorting (FACS) for small RNA-sequencing (sRNA-Seq). (B and C) By UUO-7 there were marked tubular dilatation (arrows), cellular infiltration and increased tubular expression of kidney injury marker-1 (KIM-1/Havcr1) (arrows). Upon reversal (R-UUO), there was a rapid decline in Havcr1 expression, indicating successful reversal of renal tubular injury. Scale bar: 50 μm. Data shown as mean ± SEM. One-way ANOVA with Tukey’s multiple-comparison test. ****P < 0.0001. (D) The renal cortex was digested into single cells, which were separated by FACS into endothelial cells (ECs) (CD45CD31+), macrophages (CD45+F4/80hi), proximal tubular cells (PT cells) (CD45CD31LTL+), and PDGFR-β+ (CD45CD31PDGFR-β+) cells. (E) The proportions of these sorted cell populations varied with injury and repair (n = 4 per group). Data presented as mean ± SD analyzed by Welch’s ANOVA test with Dunnett’s multiple-comparison test. *P < 0.05, **P < 0.01, ***P < 0.001, ****P < 0.0001. (F) Principal component analysis of sRNA-Seq data demonstrates that cell type accounts for the key variance in miRNA expression (top 500 most variant miRNAs shown, 64 samples). UUO-2, UUO cull day 2; UUO-7, UUO cull day 7; R-UUO, cull following 2 weeks’ reversal of UUO.
Figure 2
Figure 2. Development of kidney cell enrichment clusters.
Analysis of single population sRNA-Seq of macrophage (Mac; n = 16), endothelial (EC; n = 16), PDGFR-β+ (n = 15), and proximal tubular (PT; n = 16) sorted cells (n = 3–4 per time point) from the R-UUO model to identify miRNAs specific for each cell type. (A) For each time point, cell clusters were developed using a combination of unbiased fuzzy clustering (mFuzz) and filtering relative expression (z score) in each cell type (abbreviated example shown of UUO-2, full data Supplemental Figures 2–5). (B) Sankey plot showing the trajectory of each individual miRNA enriched at baseline (Sham). Many miRNAs either became non–cell specific or occasionally switched cell type enrichment during renal injury and repair. (C) On unsupervised clustering, miRNAs in high enrichment consistency clusters were noted to have greater cell specificity when mapped to all time points. Heatmap: Each row represents a miRNA; each column is a sample, with clustering by Euclidian distances. UUO, unilateral ureteric obstruction; R-UUO, reversal of UUO (2 weeks’ reversal); PGF/PDGFR-β, platelet-derived growth factor receptor–β.
Figure 3
Figure 3. MiRNAs with consistent specific cell enrichment.
MiRNAs demonstrating consistent cell type enrichment across all 4 experimental conditions are presented (n = 129). Each column represents a sample, each row a miRNA, and the color the relative expression (z score). Heatmap produced using unsupervised clustering by Euclidian distances. This data set can be fully explored at http://www.kidney-enriched-micrornas.com/ UUO, unilateral ureteric obstruction; R-UUO, reversal of UUO; Cell, cell origin from FACS; Cluster, assigned enrichment group.
Figure 4
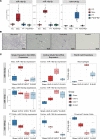
Figure 4. Global expression changes of cell-enriched miRNAs in the bulk and single-population data sets with injury and repair.
(A) The cumulative distribution of the highly enriched miRNA expression changes (log fold change, LogFC) in the kidney tissue sRNA-Seq data set is shown. There is an increase in macrophage-enriched (Mac, green line) and PDGFR-β+ (red line) and decrease in proximal tubular cell–enriched (PT, blue line) miRNAs’ expression versus nonenriched miRNAs (purple line) in comparisons against sham (sham vs. UUO day 7 and sham vs. R-UUO) (ECs in pink). This is in keeping with the histology. (B) When comparing the macrophage-enriched miRNA expression in the bulk versus single-population Mac sRNA-Seq data sets, there was an upregulation of Mac enriched miRNAs within the bulk data set at UUO day 7 (vs. sham and UUO day 2) but not within the cells themselves. This suggests that the bulk changes may be due to changes in cellular proportions in the sample. (C) For PT cell–enriched miRNAs, there was a loss of expression both within the PT cells and to a greater extent the bulk tissue at UUO day 7 (vs. UUO day 2 and R–UUO). Upon reversal, PT cell–enriched miRNA expression increased within PT cells to a relatively greater extent than was evident in the bulk. empirical cumulative distribution function plots for all cell types and comparisons are shown in Supplemental Figures 7–9. Kolmogorov-Smirnov test was used to compare the distribution of the LogFC. *P < 0.05, **P < 0.01, ***P < 0.001, ****P < 0.0001.
Figure 5
Figure 5. Selected enriched miRNA biomarkers’ expression and localization in the R-UUO model.
(A) Expression of macrophage-enriched miR-18a-5p and miR-16-5p and proximal tubular cell–enriched miR-194-5p in the sorted cell populations from the R-UUO model demonstrating their enrichment for specific populations. (B) Localization of miRNA expression by in situ hybridization on R-UUO 3 μM FFPE sections using specific LNA double-labeled probes demonstrating a tubular pattern of expression for miR-194-5p and specific tubulointerstitial cellular expression for miR-16-5p and miR-18a-5p. (C) Comparisons of enriched miRNA expression with injury and repair in the matched single-population, renal cortex, and FACS cell proportions for macrophage-enriched miR-16-5p and miR-18a-5p and PT cell–enriched miR-194-5p. The cortical expression profile of the miRNAs mirrors the corresponding enriched cell type proportions of the sorted kidney. All data are expressed as the median ± 1.5 IQR.
Figure 6
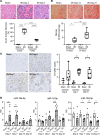
Figure 6. Expression of selected enriched miRNAs in IRI.
For the IRI model C57BL/6 mice underwent unilateral renal artery occlusion, resulting in warm ischemia for 18 minutes, followed by reperfusion and recovery for 2–21 days. (A) IRI mice demonstrated significant acute tubular necrosis on H&E staining at 2 and 7 days after injury. Scale bar: 50 μm. Data are expressed as median ± min and max value. One-way ANOVA with Tukey’s multiple-comparison test, ****P < 0.0001. (B) The normal renal architecture was progressively disrupted with significant fibrosis formation (semiquantified using picrosirius red staining) evident after 2 weeks. Scale bar: 50 μm. Data are expressed as median ± min and max value. ANOVA test with Tukey’s multiple-comparison test, *P < 0.05, **P < 0.01, ****P < 0.0001. (C) This injury was accompanied by increased macrophage number (F4/80 staining) as compared with sham animals. Scale bar: 50 μm. Data are expressed as median ± min and max value. ANOVA test with Tukey’s multiple-comparison test, *P < 0.05, **P < 0.01. (D) Within the kidney, we noted an upregulation of macrophage-enriched miR-16-5p and miR-18a-5p and downregulation of PT cell–enriched miR-194-5p with injury. Data expressed as mean ± SEM. ANOVA test with Tukey’s multiple-comparison test. *P < 0.05, **P < 0.01, ***P < 0.001, *****P < 0.00001.
Figure 7
Figure 7. Cell specificity of DEmiRNAs in discrete human renal disease phenotypes.
Cell-average expression in each cell type of DEmiRNAs in published human disease data sets: (A) delayed graft function (DGF) after renal transplantation, (B) diabetic nephropathy (DN), and (C) adult polycystic kidney disease (APKD) versus study controls. Mean expression values of miRNAs for each cell type across all conditions were calculated from our sRNA-Seq data. MiRNAs with high enrichment are shown here. Full plots of all DEmiRNAs and details of the data sets used are available in Supplemental Table 2 and Supplemental Figure 12.
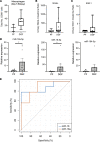
Figure 8
Figure 8. Macrophage-enriched miRNAs 16-5p and 18a-5p are differentially expressed in the urine of renal transplant recipients with DGF.
(A) On the day 5 renal biopsy, increased macrophage (CD68-positive) cell number was observed in recipients with DGF versus those with PF (n = 2). Data are expressed as median ± min and max value. (BD) The first available urine sample passed after transplantation was analyzed. No significant difference was seen in urinary injury markers (B) neutrophil associated gelatinase lipocalin (NGAL) or (C) KIM-1. (D) Macrophage-enriched miR-16-5p and miR-18a-5p were increased in recipients developing DGF; miR-194 was unchanged. Data are expressed as median ± min and max value. (E) Receiver operating characteristics curve of the differentially expressed miR-16-5p (AUC: 87%) and miR-18a-5p (AUC: 88.9%). Urinary miRNAs were normalized to miR-Cel-39 spike in D. Data reported as mean ± SEM. Mann-Whitney U test (*P < 0.05). PF, primary function.

References

    1. Denby L, et al. miR-21 and miR-214 are consistently modulated during renal injury in rodent models. Am J Pathol. 2011;179(2):661–672. doi: 10.1016/j.ajpath.2011.04.021. - DOI - PMC - PubMed
    1. Trionfini P, et al. MicroRNAs in kidney physiology and disease. Nat Rev Nephrol. 2015;11(1):23–33. doi: 10.1038/nrneph.2014.202. - DOI - PubMed
    1. Connor KL, Denby L. MicroRNAs as non-invasive biomarkers of renal disease [published online September 20, 2019]. Nephrol Dial Transplant. https://dx.doi.org10.1093/ndt/gfz183. - PMC - PubMed
    1. Chau BN, et al. MicroRNA-21 promotes fibrosis of the kidney by silencing metabolic pathways. Sci Transl Med. 2012;4(121):121ra18. - PMC - PubMed
    1. Gomez IG, et al. Anti-microRNA-21 oligonucleotides prevent Alport nephropathy progression by stimulating metabolic pathways. J Clin Invest. 2015;125(1):141–156. doi: 10.1172/JCI75852. - DOI - PMC - PubMed

Publication types