. 2020 Nov 1;7(1):189.
doi: 10.1038/s41438-020-00408-8.

The apple REFPOP-a reference population for genomics-assisted breeding in apple

Affiliations

The apple REFPOP-a reference population for genomics-assisted breeding in apple

Michaela Jung et al. Hortic Res. .

Abstract

Breeding of apple is a long-term and costly process due to the time and space requirements for screening selection candidates. Genomics-assisted breeding utilizes genomic and phenotypic information to increase the selection efficiency in breeding programs, and measurements of phenotypes in different environments can facilitate the application of the approach under various climatic conditions. Here we present an apple reference population: the apple REFPOP, a large collection formed of 534 genotypes planted in six European countries, as a unique tool to accelerate apple breeding. The population consisted of 269 accessions and 265 progeny from 27 parental combinations, representing the diversity in cultivated apple and current European breeding material, respectively. A high-density genome-wide dataset of 303,239 SNPs was produced as a combined output of two SNP arrays of different densities using marker imputation with an imputation accuracy of 0.95. Based on the genotypic data, linkage disequilibrium was low and population structure was weak. Two well-studied phenological traits of horticultural importance were measured. We found marker-trait associations in several previously identified genomic regions and maximum predictive abilities of 0.57 and 0.75 for floral emergence and harvest date, respectively. With decreasing SNP density, the detection of significant marker-trait associations varied depending on trait architecture. Regardless of the trait, 10,000 SNPs sufficed to maximize genomic prediction ability. We confirm the suitability of the apple REFPOP design for genomics-assisted breeding, especially for breeding programs using related germplasm, and emphasize the advantages of a coordinated and multinational effort for customizing apple breeding methods in the genomics era.


Conflict of interest statement

The authors declare that they have no conflict of interest.

Figures

Fig. 1
Fig. 1. Linkage disequilibrium decay in the apple reference population.
Linkage disequilibrium with a loess smoother for a distances betweenSNPs across the span of chromosomes, and b for SNPs within a 5 kb distance
Fig. 2
Fig. 2. Structure of the apple reference population.
a Unrooted neighbor-joining tree of the accession group, colors correspond to the legend in “b”. b Principal component analysis of the accession group with progeny group as supplementary individuals encircled with a normal confidence ellipse (constructed using a multivariate normal distribution, level 0.95). Plot of the first two principal components with their respective proportion of the total variance shown within brackets. c ADMIXTURE bar plot of the accession group for K = 14. Labels in plots “a” to “c” refer to the geographic origin of genotypes: ZAF (South Africa), JPN (Japan), ANZ (Australia and New Zealand), CAN (Canada), USA (United States of America), WCE (Western and Central Europe), NEE (Northern and Eastern Europe), SE (Southern Europe), SEE (Southeastern Europe), U (accessions of unknown geographic origin), and P representing the progeny group in plot “b”. In plot “c”, each group of genotypes with a common geographic origin is labeled at its right side
Fig. 3
Fig. 3. Distributions and heritability of the phenotypic data.
a, b Violin plots of floral emergence and harvest date for individual environments using the adjusted phenotypic values of each tree. Gray and black circles denote mean and median values, respectively. c Individual-location clonal mean heritability for two analyzed traits with values before and after the correction of spatial heterogeneity. d Density plot of phenotypic least-square means of genotypes across environments with environmental effects removed, calculated from the adjusted phenotypic values of each tree corrected for spatial heterogeneity within environments. The environments were labeled with codes: Belgium (BEL), Switzerland (CHE), Spain (ESP), France (FRA), and Italy (ITA)
Fig. 4
Fig. 4. Visualization of variability between traits (floral emergence and harvest date), genotypes (both apple REFPOP groups) and environments.
a, b Predicted values of genotypes adjusted for spatial heterogeneity within each environment, 30 randomly chosen genotypes were highlighted with colors. Order of the environments corresponds to their latitude. The environments were labeled with codes: Spain (ESP), Italy (ITA), Switzerland (CHE), France (FRA), and Belgium (BEL). c Stacked bar plots with the variance of the fixed effect of environment and the random effects of genotype, genotype by environment interaction, and residuals; calculated from the model following Eq. (5) (see “Material and methods” section)
Fig. 5
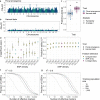
Fig. 5. Results of the genome-wide association study (GWAS) and genomic prediction analysis.
Manhattan plots for a floral emergence and b harvest date with log-transformed p-values obtained with GWAS and Bonferroni-corrected significance threshold indicated with dashed line. c Genomic predictive ability measured with Pearson correlation coefficient, multi-location clonal mean heritability, and average predictive ability. Comparison of the number of significant associations in d GWAS and e genomic predictive ability measured with the respective mean values and their 95% confidence intervals under various SNP densities obtained through three feature selection strategies (see “Materials and methods” section). Plots “d” and “e” share a common legend placed in “e”. f, g Expected precision of genomic estimated breeding values (GEBVs) with different training population sizes N, number of effective markers M in linkage disequilibrium with the genes underlying the trait and two heritability values h2 of f 0.5 and g 0.8. The N values correspond to a minimum of 10 individuals, and to the sizes of the accession group (N = 269), the whole apple REFPOP (N = 534) and a population of an approximately double size of the apple REFPOP (N = 1000)

References

    1. Food and Agriculture Organization of the United Nations. FAOSTAT (FAO, 2017). Access 19 Mar 2019. http://www.fao.org/faostat/en/#home.
    1. Urrestarazu J, et al. Analysis of the genetic diversity and structure across a wide range of germplasm reveals prominent gene flow in apple at the European level. BMC Plant Biol. 2016;16:130. doi: 10.1186/s12870-016-0818-0. - DOI - PMC - PubMed
    1. Urrestarazu J, et al. Genome-wide association mapping of flowering and ripening periods in apple. Front. Plant Sci. 2017;8:1923. doi: 10.3389/fpls.2017.01923. - DOI - PMC - PubMed
    1. Kumar, S., Volz, R. K., Chagné, D. & Gardiner, S. in Genomics of Plant Genetic Resources: Vol. 2. Crop Productivity, Food Security and Nutritional Quality (eds Tuberosa, R., Graner, A. & Frison, E.) 387–416 (Springer Netherlands, Dordrecht, 2014).
    1. Meuwissen THE, Hayes BJ, Goddard ME. Prediction of total genetic value using genome-wide dense marker maps. Genetics. 2001;157:1819. - PMC - PubMed