

Identification of key gene networks controlling organic acid and sugar metabolism during watermelon fruit development by integrating metabolic phenotypes and gene expression profiles
- PMID: 33328462
- PMCID: PMC7705761
- DOI: 10.1038/s41438-020-00416-8
Identification of key gene networks controlling organic acid and sugar metabolism during watermelon fruit development by integrating metabolic phenotypes and gene expression profiles
Abstract
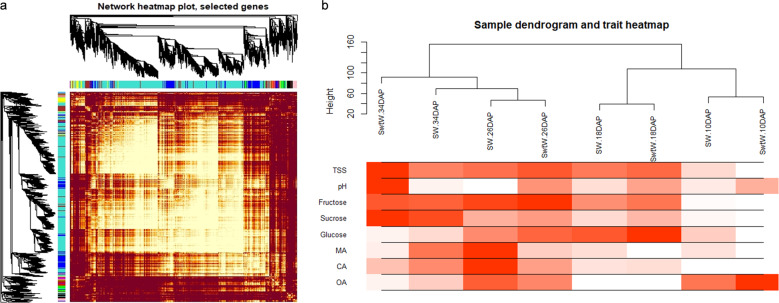
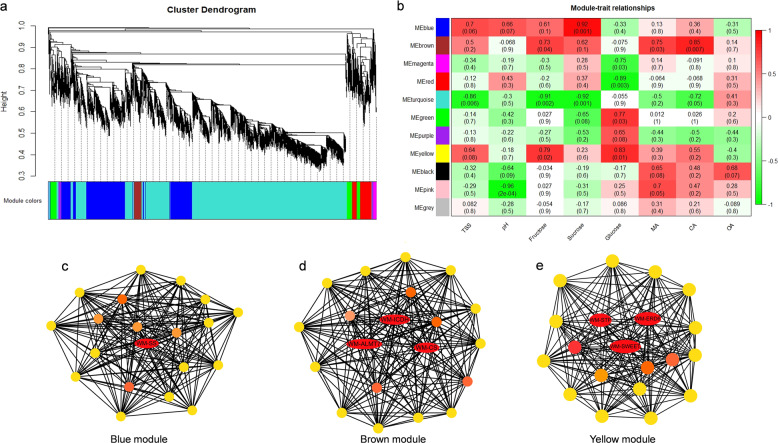
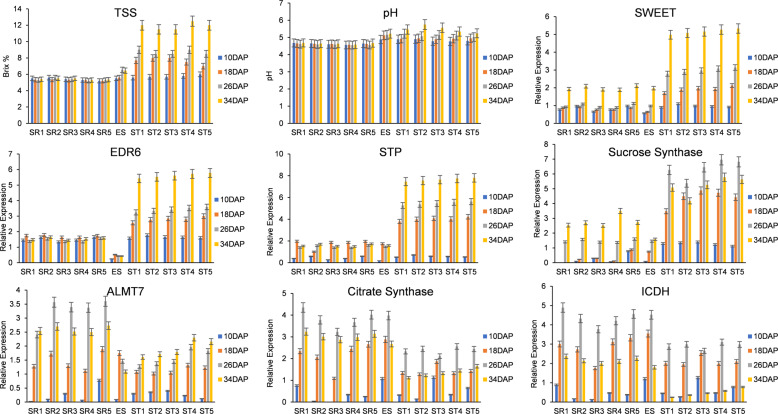
The organoleptic qualities of watermelon fruit are defined by the sugar and organic acid contents, which undergo considerable variations during development and maturation. The molecular mechanisms underlying these variations remain unclear. In this study, we used transcriptome profiles to investigate the coexpression patterns of gene networks associated with sugar and organic acid metabolism. We identified 3 gene networks/modules containing 2443 genes highly correlated with sugars and organic acids. Within these modules, based on intramodular significance and Reverse Transcription Quantitative polymerase chain reaction (RT-qPCR), we identified 7 genes involved in the metabolism of sugars and organic acids. Among these genes, Cla97C01G000640, Cla97C05G087120 and Cla97C01G018840 (r2 = 0.83 with glucose content) were identified as sugar transporters (SWEET, EDR6 and STP) and Cla97C03G064990 (r2 = 0.92 with sucrose content) was identified as a sucrose synthase from information available for other crops. Similarly, Cla97C07G128420, Cla97C03G068240 and Cla97C01G008870, having strong correlations with malic (r2 = 0.75) and citric acid (r2 = 0.85), were annotated as malate and citrate transporters (ALMT7, CS, and ICDH). The expression profiles of these 7 genes in diverse watermelon genotypes revealed consistent patterns of expression variation in various types of watermelon. These findings add significantly to our existing knowledge of sugar and organic acid metabolism in watermelon.
Conflict of interest statement
The authors declare that they have no conflict of interest.
Figures


Similar articles
-
Comparative transcriptome analysis reveals key genes potentially related to soluble sugar and organic acid accumulation in watermelon.PLoS One. 2018 Jan 11;13(1):e0190096. doi: 10.1371/journal.pone.0190096. eCollection 2018. PLoS One. 2018. PMID: 29324867 Free PMC article.
-
Transcriptome and Metabolome Reveal Sugar and Organic Acid Accumulation in Rosa roxburghii Fruit.Plants (Basel). 2023 Aug 24;12(17):3036. doi: 10.3390/plants12173036. Plants (Basel). 2023. PMID: 37687283 Free PMC article.
-
Identification of genes associated with soluble sugar and organic acid accumulation in 'Huapi' kumquat (Fortunella crassifolia Swingle) via transcriptome analysis.J Sci Food Agric. 2021 Aug 15;101(10):4321-4331. doi: 10.1002/jsfa.11072. Epub 2021 Jan 22. J Sci Food Agric. 2021. PMID: 33417244
-
Changes and response mechanism of sugar and organic acids in fruits under water deficit stress.PeerJ. 2022 Aug 24;10:e13691. doi: 10.7717/peerj.13691. eCollection 2022. PeerJ. 2022. PMID: 36039369 Free PMC article. Review.
-
[Sugar transport, metabolism, accumulation and their regulation in fruits].Zhi Wu Sheng Li Yu Fen Zi Sheng Wu Xue Xue Bao. 2004 Feb;30(1):1-10. Zhi Wu Sheng Li Yu Fen Zi Sheng Wu Xue Xue Bao. 2004. PMID: 15583402 Review. Chinese.
Cited by
-
Unveiling the genetic basis of floral scent formation in roses using weighted gene co-expression and protein-protein interaction network analyses.Sci Rep. 2025 Jul 1;15(1):21902. doi: 10.1038/s41598-025-08137-5. Sci Rep. 2025. PMID: 40596377 Free PMC article.
-
OsTST1, a key tonoplast sugar transporter from source to sink, plays essential roles in affecting yields and height of rice (Oryza sativa L.).Planta. 2023 May 23;258(1):4. doi: 10.1007/s00425-023-04160-w. Planta. 2023. PMID: 37219719
-
Unraveling the genetic architecture of blueberry fruit quality traits: major loci control organic acid content while more complex genetic mechanisms control texture and sugar content.BMC Plant Biol. 2025 Jan 10;25(1):36. doi: 10.1186/s12870-025-06061-4. BMC Plant Biol. 2025. PMID: 39789463 Free PMC article.
-
An integrated transcriptome and metabolome approach reveals the accumulation of taste-related metabolites and gene regulatory networks during watermelon fruit development.Planta. 2021 Jul 22;254(2):35. doi: 10.1007/s00425-021-03680-7. Planta. 2021. PMID: 34292405
-
Transcriptome Analysis Reveals Fruit Quality Formation in Actinidia eriantha Benth.Plants (Basel). 2023 Dec 6;12(24):4079. doi: 10.3390/plants12244079. Plants (Basel). 2023. PMID: 38140408 Free PMC article.
References
-
- Faostat, F. Available online: http://www.fao.org/faostat/en/#data. QC (accessed on January 2018) (2017).
-
- Guo, S. et al. Resequencing of 414 cultivated and wild watermelon accessions identifies selection for fruit quality traits. Nat. Genet.51, 1–8 (2019). - PubMed
