. 2020 Dec 16;11(1):6402.
doi: 10.1038/s41467-020-20228-7.

A single dose of recombinant VSV-∆G-spike vaccine provides protection against SARS-CoV-2 challenge

Affiliations

A single dose of recombinant VSV-∆G-spike vaccine provides protection against SARS-CoV-2 challenge

Yfat Yahalom-Ronen et al. Nat Commun. .

Abstract

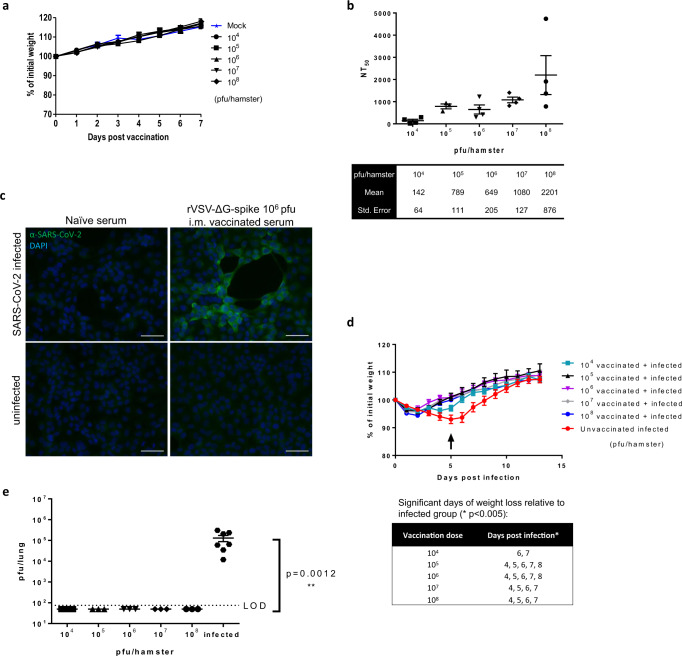
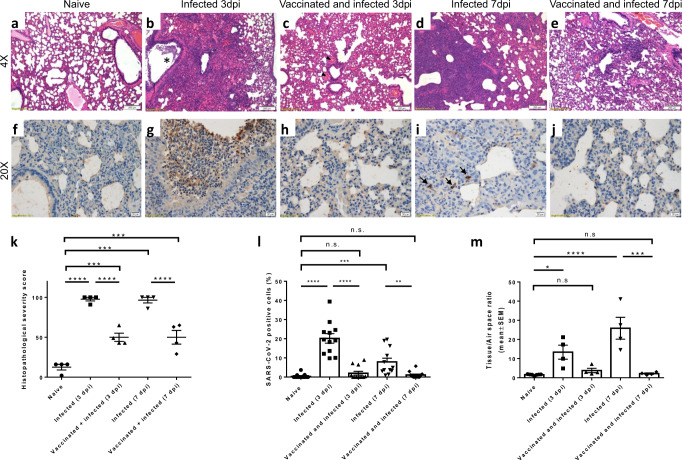
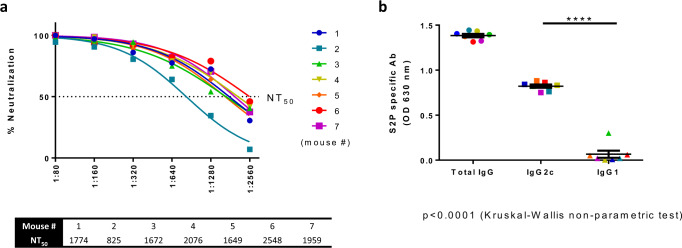
The COVID-19 pandemic caused by SARS-CoV-2 imposes an urgent need for rapid development of an efficient and cost-effective vaccine, suitable for mass immunization. Here, we show the development of a replication competent recombinant VSV-∆G-spike vaccine, in which the glycoprotein of VSV is replaced by the spike protein of SARS-CoV-2. In-vitro characterization of this vaccine indicates the expression and presentation of the spike protein on the viral membrane with antigenic similarity to SARS-CoV-2. A golden Syrian hamster in-vivo model for COVID-19 is implemented. We show that a single-dose vaccination results in a rapid and potent induction of SARS-CoV-2 neutralizing antibodies. Importantly, vaccination protects hamsters against SARS-CoV-2 challenge, as demonstrated by the abrogation of body weight loss, and alleviation of the extensive tissue damage and viral loads in lungs and nasal turbinates. Taken together, we suggest the recombinant VSV-∆G-spike as a safe, efficacious and protective vaccine against SARS-CoV-2.


Conflict of interest statement

Patent application for the described vaccine was filed by the Israel Institute for Biological Research.

Figures

Fig. 1
Fig. 1. rVSV-∆G-spike design and generation strategy.
a A schematic diagram of the genomic organization of WT-VSV (top diagram), and rVSV-∆G-spike (bottom diagram). N nucleoprotein, P phosphoprotein, M matrix, L large polymerase, G glycoprotein, SPIKE SARS-CoV-2 spike. b pVSV-∆G-spike map. c Schematic representation of the generation process of rVSV-∆G-spike vaccine. Infection of BHK-21 cells with MVA-T7, followed by cotransfection with pVSV-∆G-spike, and VSV-system accessory plasmids; transfection of BHK-21 cells with pCAGGS-VSV-G, followed by infection with the supernatant of the primary transfection, to create P1; sequential passaging in Vero E6 cells were performed creating rVSV-∆G-spike.
Fig. 2
Fig. 2. Characterization of rVSV-∆G-spike.
a A table summarizing the genome analysis of several passages of rVSV-∆G-spike, showing elimination of VSV-G over time, together with increased titer, and formation of plaques. NA not applicable. “-” not evaluated. b Representative immunofluorescence images of Vero E6 cells infected with early passage (P5)-rVSV-∆G-spike, or late passage (P13)-rVSV-∆G-spike, stained with a SARS-CoV-2 antibody (green), and counterstained with DAPI for nuclei staining (blue). Bottom panels show insets at large magnification. Scale bars: 50 µm. rVSV-∆G-spike at P5 formed syncitia, whereas P13 showed individual infected cells, with no evidence of syncitia. c Transmission electron micrographs of P14 rVSV-∆G-spike (top panels) compared to WT-VSV (bottom panels). Right panels show immunogold labeling using gold nanoparticles conjugated antibodies directed to the spikes’ RBD. Data for b and c are representative of four and five experiments, respectively.
Fig. 3
Fig. 3. Antigenic similarity of rVSV-ΔG-spike and SARS-CoV-2.
a Immunofluorescent images of Vero E6 cells infected with either WT-VSV (left panel), rVSV-ΔG-spike (middle panel), or SARS-CoV-2, stained with COVID-19 human convalescent serum. Representative images of five experiments are presented. Scale bars: 50 µm. b Correlation analysis of neutralization of rVSV-∆G-spike and SARS-CoV-2 by a panel of sera from COVID-19 convalescent patients. For each serum sample (n = 12), NT50 values were determined for neutralization of rVSV-∆G-spike or SARS-CoV-2. The NT50 values were plotted to determine the correlation between the neutralization assays. Spearman’s correlation r and p values are indicated. Source data are provided as a Source Data file.
Fig. 4
Fig. 4. Establishment of a golden Syrian hamster SARS-CoV-2 model.
a Body weight changes of hamsters infected with 5 × 104 (n = 8), 5 × 105 (n = 8), or 5 × 106 (n = 8) pfu/hamster of SARS-CoV-2, compared to mock-infected hamsters (n = 4). Table shows days of significant differences, relative to mock infection. Statistical analysis was performed using one unpaired t-test per row, with correction for multiple comparisons using the Holm–Sidak method, p < 0.005. bg Lungs were isolated and processed for paraffin embedding from naive hamsters (left panels) or SARS-CoV-2-infected hamsters (right panels, 5 × 106 pfu/hamster) at 7 dpi. Sections (5 µm) were taken for H&E staining (be) and SARS-CoV-2 immunolabeling (f, g, nuclei-blue, SARS-CoV-2-green). be: scale bar = 100 µm; f, g: scale bar = 10 µm. Black arrows indicate patches of focal inflammation, pleural invagination, and alveolar collapse. An asterisk (*) indicates hemorrhagic areas. A hash symbol indicates edema and protein-rich exudates. Black arrow heads indicate pulmonary mononuclear cells. White arrows indicate SARS-CoV-2 positive immunolabeling. Naive group: n = 4, SARS-CoV-2 5 × 106 7 dpi group: n = 1. Source data are provided as a Source Data file.
Fig. 5
Fig. 5. A single-dose i.m. rVSV-∆G-spike vaccine safety and efficacy in hamsters following SARS-CoV-2 challenge.
a Body weight changes of mock-vaccinated hamsters (n = 4), and hamsters vaccinated with rVSV-∆G-spike ranging from 104 to 108 pfu/hamster (n = 10, n = 11, n = 11, n = 11, n = 10, for each vaccinated group, respectively). b NT50 values of i.m. vaccinated hamsters’ sera (104–108 pfu/hamster) against SARS-CoV-2 (n = 4 for 104, 106, 107, and 108, n = 3 for 105). Means and SEM are indicated below the graph. c Representative immunofluorescence images of Vero E6 cells infected with SARS-CoV-2 (upper panels) or uninfected (lower panels), labeled with serum from either naive (left panel) or rVSV-∆G-spike (106 pfu/hamster) i.m. vaccinated hamsters (right panel). Representative images of three experiments are presented. Scale bars: 50 µm. d Body weight changes of hamsters infected with SARS-CoV-2, and hamsters vaccinated with 104–108 pfu/hamster and infected with 5 × 106 pfu/hamster 25 days post vaccination. Arrow indicates 5 dpi—hamsters were sacrificed and lungs were removed for viral load. For vaccinated groups 104–107: days 0–5 (n = 12), days 6–12 (n = 9), 108 group: days 0–5 (n = 11), day 6–12 (n = 8). For unvaccinated infected: days 0–5 (n = 14), days 6–12 (n = 12). Statistical significance was determined using two-tailed one unpaired t-test per row, with correction for multiple comparisons using Holm–Sidak method. p < 0.005. e Viral loads in lungs (5 dpi) of hamsters infected with 5 × 106 pfu/hamster of SARS-CoV-2 (n = 7), and hamsters vaccinated with 104–108 pfu/hamster of rVSV-∆G-spike, and then infected with 5 × 106 pfu/hamster of SARS-CoV-2 (n = 3 for each vaccinated group). Limit of detection (LOD) 75 pfu/lung. All vaccinated groups show statistical significance, compared to infected unvaccinated group as determined by one-way ANOVA nonparametric Kruskal–Wallis test, with Dunn’s multiple comparisons test, *p = 0.0012. Data for a, d, and e are presented as mean values ± SEM. Source data are provided as a Source Data file.
Fig. 6
Fig. 6. Viral load analysis in organs of rVSV-∆G-spike vaccinated hamsters following SARS-CoV-2 challenge.
a Body weight changes of SARS-CoV-2 infected hamsters (5 × 106 pfu) 25 days post vaccination with 1 × 106 pfu, or unvaccinated. Arrows indicate 3 and 7 dpi—hamsters were sacrificed. Number of animals per group: days 0–3 n = 15, days 4–7 n = 7, days 8–12 n = 3. Statistical significance was performed by using two-tailed one unpaired t-test per row, with correction for multiple comparisons using Holm–Sidak method, *p < 0.005. Viral loads in lungs (b) and nasal turbinates (c) at 3 dpi of hamsters infected with SARS-CoV-2 (5 × 106 pfu/hamster, n = 4), and hamsters vaccinated with rVSV-∆G-spike (106 pfu/hamster), followed by infection with SARS-CoV-2 (5 × 106 pfu/hamster, n = 4). LOD: 75 pfu/lung, 50 pfu/nasal turbinates. Data for ac are presented as mean values ± SEM. Significance analysis for b and c was performed using two-tailed unpaired Mann–Whitney nonparametric test, *p = 0.0286. Source data are provided as a Source Data file.
Fig. 7
Fig. 7. Histopathological analysis of rVSV-∆G-spike i.m. vaccinated and infected hamsters’ lungs at 3 and 7 dpi.
General histology (H&E) and SARS-CoV-2 DAB immunolabeling of naive, unvaccinated infected (5 × 106), and vaccinated (106 pfu) hamsters’ lungs, at 3 and 7 dpi. Lungs were isolated and processed for paraffin embedding from naive (a, f), infected (5 × 106 pfu) (b, g for 3 dpi and d, i for 7 dpi) and vaccinated and infected (c, h for 3 dpi and e, j for 7 dpi). Sections (4 µm) were taken for H&E staining (ae) and SARS-CoV-2 DAB immunolabeling (fj, positive SARS-CoV-2—brown, hematoxylin counterstaining—blue). An asterisk (*) indicates cellular debris in bronchiolar lumen. Black arrow heads indicate congestion of blood in blood vessels. Black arrows indicate positive stained cells. ae: scale bar = 200 µm; fj: scale bar = 20 µm. k Histopathological severity analysis of hamsters lungs of naive, vaccinated, and infected lungs, at 3 and 7 dpi. l Digital morphometric analysis of DAB immunohistochemical staining for SARS-CoV-2 in lungs of naive, infected, and vaccinated lungs, at 3 and 7 dpi. m Tissue/air space analysis of naive, infected, and vaccinated lungs, at 3 and 7 dpi. Data for aj was taken for five groups. Each group includes four animals. For each animal, five fields were imaged and analyzed. Data for km are presented as mean values ± SEM. Statistical analyses for km were performed by one-way ANOVA with Tukey’s multiple comparisons test, with p < 0.0001, p = 0.0006, p < 0.0001, respectively. Source data are provided as a Source Data file.
Fig. 8
Fig. 8. Th1 and Th2 isotytpe analysis of rVSV-∆G-spike induced antibodies.
rVSV-∆G-spike vaccinated (107 pfu/mouse, n = 7) C57BL/6J mice sera analysis for a NT50 values against SARS-CoV-2 as determined by PRNT, and b levels of S2P specific binding antibodies: total IgG, IgG2c, and IgG1 as determined by ELISA. Statistical significance was determined using one-way ANOVA nonparametric test, with Kruskal–Wallis test: ****p < 0.0001. Each mouse is represented by a different color. Source data are provided as a Source Data file.

References

    1. Coronaviridae Study Group of the International Committee on Taxonomy of Viruses The species severe acute respiratory syndrome-related coronavirus: classifying 2019-nCoV and naming it SARS-CoV-2. Nat. Microbiol. 2020;5:536–544. doi: 10.1038/s41564-020-0695-z. - DOI - PMC - PubMed
    1. Wu F, et al. A new coronavirus associated with human respiratory disease in China. Nature. 2020;579:265–269. doi: 10.1038/s41586-020-2008-3. - DOI - PMC - PubMed
    1. Zhou P, et al. A pneumonia outbreak associated with a new coronavirus of probable bat origin. Nature. 2020;579:270–273. doi: 10.1038/s41586-020-2012-7. - DOI - PMC - PubMed
    1. Amanat F, Krammer F. SARS-CoV-2 vaccines: status report. Immunity. 2020;52:583–589. doi: 10.1016/j.immuni.2020.03.007. - DOI - PMC - PubMed
    1. Hoffmann M, et al. SARS-CoV-2 cell entry depends on ACE2 and TMPRSS2 and is blocked by a clinically proven protease inhibitor. Cell. 2020;181:271–280. doi: 10.1016/j.cell.2020.02.052. - DOI - PMC - PubMed

MeSH terms