. 2020 Dec 16;11(1):6396.
doi: 10.1038/s41467-020-19297-5.

Eosinophils improve cardiac function after myocardial infarction

Affiliations

Eosinophils improve cardiac function after myocardial infarction

Jing Liu et al. Nat Commun. .

Abstract

Clinical studies reveal changes in blood eosinophil counts and eosinophil cationic proteins that may serve as risk factors for human coronary heart diseases. Here we report an increase of blood or heart eosinophil counts in humans and mice after myocardial infarction (MI), mostly in the infarct region. Genetic or inducible depletion of eosinophils exacerbates cardiac dysfunction, cell death, and fibrosis post-MI, with concurrent acute increase of heart and chronic increase of splenic neutrophils and monocytes. Mechanistic studies reveal roles of eosinophil IL4 and cationic protein mEar1 in blocking H2O2- and hypoxia-induced mouse and human cardiomyocyte death, TGF-β-induced cardiac fibroblast Smad2/3 activation, and TNF-α-induced neutrophil adhesion on the heart endothelial cell monolayer. In vitro-cultured eosinophils from WT mice or recombinant mEar1 protein, but not eosinophils from IL4-deficient mice, effectively correct exacerbated cardiac dysfunctions in eosinophil-deficient ∆dblGATA mice. This study establishes a cardioprotective role of eosinophils in post-MI hearts.


Conflict of interest statement

The authors declare no competing interests.

Figures

Fig. 1
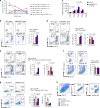
Fig. 1. Increased human and mouse blood and heart EOS count after MI.
a EOS count per liter blood in men with (n = 345) and without (n = 5,519) AMI (P = 3.3 x 10E-9). b. Spearman correlation between LV EF and blood EOS count among a subgroup of 482 men who had the echocardiography results available (r = −0.122, P = 0.013). c. FACS strategy to analyze heart and blood EOS from WT mice at 1-day post-MI. d Representative FACS images of heart EOS from WT sham at 1-day after operation. EOS-deficient ΔdblGATA sham mice served as negative control. e FACS analysis of blood EOS in WT sham and MI mice at 1-day after surgery. Representative FACS images are shown to the left. f. FACS analysis determined heart EOS count or percentage among total CD45+ cells in WT MI and sham mice at different days after surgery. g, h Anti-mouse GFP antibody detection of GFP-positive EOS in the infarct, border, and remote regions from eoCRE+/−GFP+/− mice at 1-day post-MI. Representative images are shown to the left (g). Heart sections from sham-operated eoCRE+/−GFP+/− mice served as experimental control (h). Scale: 30 µm, inset: 15 µm. i. RT-PCR determined the mRNA levels of EOS relevant chemokines in heart tissues from WT MI and sham mice at 1-day after surgery. Data are mean ± SEM. The numbers of patients (a) and mice (eg, i) in each group, and P values (a, eg, i) are indicated, Student’s t-test (a), non-parametric Mann-Whitney U test followed by Bonferroni correction (e, f, i), and one-way ANOVA test (g).
Fig. 2
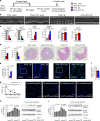
Fig. 2. EOS-deficiency exacerbates cardiac dysfunction post-MI.
a Mouse surgery strategy. b Representative LV M-mode echocardiography images from WT and ∆dblGATA mice at 1-month post-MI or sham. c Cardiac functions at 1-month post-MI: EF, FS, LV Vol;d, LV Vol;s, HW/BW ratio, HW/TL ratio, and mortality rate in different groups of mice as indicated. d Infarct size ratio, infarct thickness, and calculating formulas. e H&E staining for d Scale: 1500 µm. f TUNEL-positive apoptotic cells in infarct region. Scale: 100 µm, inset: 40 µm. g Masson’s trichrome staining determined collagen deposition in the infarct region. Scale: 1500 µm. Representative images in f and g are shown to the right. h, i. Immunoblots detected IL4 (h) and mEar1 (i) expression in heart from WT and ∆dblGATA sham and MI mice at 1-day and 1-month post-MI. Data are mean ± SEM. The numbers mice of in each experimental group and P values are indicated (c, d, fi), one-way ANOVA test (c, h, i) and non-parametric Mann-Whitney U test (d, f, g).
Fig. 3
Fig. 3. EOS deficiency affects heart acute immune cell accumulation post-MI.
a FACS quantification of different immune cells in percentage of total CD45+ cells at different time points post-MI. b CD45+CD11b+Gr-1+ neutrophils at 1-day after surgery. c RT-PCR determined the mRNA levels of neutrophil relevant chemokines (Cxcl1, Cxcl2, Cxcl3, Cxcl5, Cxcl7) in heart from WT and ΔdblGATA mice at 1-day post-MI. d, e CD45+CD11b+Ly6Chi and CD45+CD11b+Ly6Clo monocytes at 3 days (d) and 5 days (e) after surgery. f CD45+CD11c+MHC-II+ dendritic cells at 5 days after surgery. g CD45+CD4+CD8 and CD4CD8+ T cells at 7 days after surgery. h FACS gating strategy. Data are mean ± SEM. The numbers of mice in each experimental group and P values are indicated, one-way ANOVA test (b, dg) and non-parametric Mann–Whitney U test (c).
Fig. 4
Fig. 4. EOS activities in cardiac cell death, fibrosis, and cell adhesion.
a, b Immunofluorescent staining detected cleaved caspase 3-positive cardiac myosin heavy chain (MYH)-positive cardiomyocytes (a) and α-SMA-positive fibroblasts (b) in infarct, border, and remote regions of WT mice at 1-month post-MI. Scale: 100 µm, inset: 40 µm. c FACS detection of Annexin V+PI (propidium iodide) early apoptotic cardiomyocytes after cells were treated with and without H2O2 (100 µM) and EOS lysate (equivalent to 106 EOS/ml) from WT mice. Representative images in ac are shown to the left. d, e Immunoblot detection of p-Smad2/3, total Smad2/3, and GAPDH in fibroblasts treated with 10 ng/ml TGF-β and different concentrations of EOS lysate (equivalent to 1 × 105, 5 × 105, 1 × 106 EOS per ml) for 30 min. Representative immunoblots are shown to the right. f FACS detection of ICAM-1 and VCAM-1 expression from MHECs after treatment with and without (control) different concentrations of TNF-α (5, 25, and 100 ng/ml). g Adhesion of 5-(and 6)-carboxyfluorescein diacetate succinimidyl ester (CFSE)-labeled neutrophils on TNF-α (100 ng/ml)-treated MHECs after pretreatment with different types of EOS as indicated. Scale: 50 µm. h FACS gating strategy for panel c. The numbers of mice (a, b), the numbers of experiments (ce, g), and P values are indicated, one-way ANOVA test.
Fig. 5
Fig. 5. EOS-derived IL4 and mEar1 protect cardiac function post-MI.
a. Mouse surgery and treatment strategy. b. Representative LV M-mode echocardiography images at 1-month post-MI. c. Cardiac functions at 1-month post-MI: EF, FS, LV Vol;d, LV Vol;s, HW/BW, HW/TL, and mortality rates of different mice as indicated. d, e. Infarct size ratio, thickness, and Masson’s trichrome-positive areas of hearts from different groups of mice as indicated at 1-month post-MI. Representative H&E and Masson’s trichrome staining images are shown to the right. Scale bars: 1500 µm. f. FACS detection of Annexin V+PI early apoptotic cardiomyocytes after cells were exposed to 100 µM H2O2 with or without different types of EOS lysate (equivalent to 106 EOS/ml) or together with anti-mEar1 antibody. Representative FACS images are shown to the left. FASC gating strategy is shown in Fig. 4h. g, h. Immunoblot detection of Bcl-2 and GAPDH in mouse cardiomyocytes treated with IL4 (0, 10, 50, 100 ng/ml) (g) or mEar1 (0, 10, 100, 1000 ng/ml) (h) with or without H2O2 (100 µM). Representative blots are shown to the right. i. Immunoblots of p-Smad2/3, total Smad2/3, and GAPDH in fibroblasts treated with IL4 (0, 10, 50,100 ng/ml) and then with and without TGF-β (10 ng/ml) for 30 min. Data represent 4 independent experiments. j. Immunoblots of p-Smad2/3 and GAPDH in fibroblasts treated with different types of EOS lysates (equivalent to 106 EOS/ml) and TGF-β (10 ng/ml) for 30 min. Representative blots are shown to the left. k. Sham and 1-month post-MI mouse plasma IL4 levels from different groups as indicated. Data are mean ± SEM. The numbers of mice (ce, k), the numbers of independent experiments (fj), and P values are indicated, one-way ANOVA test.
Fig. 6
Fig. 6. DTX-induced EOS depletion exacerbates cardiac functions post-MI.
a Mouse surgery and treatment strategy. b Representative LV M-mode echocardiography images at 1-month post-MI from different groups of mice. c. EF, FS, LV Vol;d, LV Vol;s, HW/BW, and HW/TL in different groups of mice. df Infarct size ratio and thickness (d), infarct TUNEL-positive apoptotic cells (e), and infarct region Masson’s trichrome-positive areas (f) in hearts from different groups of mice as indicated. Representative H&E staining (Scale: 1500 µm) and TUNEL staining (Scale: 100 µm, inset: 30 µm) images are shown to the right. g TUNEL staining of human cardiomyocytes treated with different doses of human EOS lysates (equivalent to 2.5 × 103, 1 × 104, 2.5 × 104 EOS/ml) under hypoxia and normoxia conditions for 36 hrs. Representative images are shown to the right. Scale: 30 µm. h, i Immunoblot detection of p-Smad2/3, total Smad2/3 and GAPDH from human cardiac fibroblasts treated with and without different doses of human EOS lysate (equivalent to 1 × 104, 2 × 104, 4 × 104 EOS/ml) and TGF-β (10 ng/ml) for 30 min. Data are mean ± SEM. The numbers of mice (cf), the numbers of independent experiments (gi), and P values are indicated, one-way ANOVA test (c, h, i) and non-parametric Mann-Whitney U test (dg).
Fig. 7
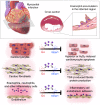
Fig. 7. EOS functions in post-MI heart.
a Schematic illustration of EOS accumulation in the infarct area of mouse heart post-MI. b Summary of EOS function in protecting heart from MI-induced injury by producing Th2 cytokines (e.g., IL4), cationic proteins (mouse mEar1, human ECP and EOS-derived neurotoxin), or other untested molecules to reduce cardiomyocyte apoptosis, cardiac fibroblast activation and fibrotic protein synthesis, and inflammatory cell adhesion and infarct heart accumulation.

Comment in

References

    1. McEwen BJ. Eosinophils: a review. Vet. Res Commun. 1992;16:11–44. doi: 10.1007/BF01839203. - DOI - PubMed
    1. Khoury P, Grayson PC, Klion AD. Eosinophils in vasculitis: characteristics and roles in pathogenesis. Nat. Rev. Rheumatol. 2014;10:474–483. doi: 10.1038/nrrheum.2014.98. - DOI - PMC - PubMed
    1. Bystrom J, Amin K, Bishop-Bailey D. Analysing the eosinophil cationic protein–a clue to the function of the eosinophil granulocyte. Respir. Res. 2011;12:10. doi: 10.1186/1465-9921-12-10. - DOI - PMC - PubMed
    1. Kounis NG, Soufras GD, Tsigkas G, Hahalis G. White blood cell counts, leukocyte ratios, and eosinophils as inflammatory markers in patients with coronary artery disease. Clin. Appl Thromb. Hemost. 2015;21:139–143. doi: 10.1177/1076029614531449. - DOI - PubMed
    1. Venge P, et al. Eosinophil cationic protein (ECP): molecular and biological properties and the use of ECP as a marker of eosinophil activation in disease. Clin. Exp. Allergy. 1999;29:1172–1186. doi: 10.1046/j.1365-2222.1999.00542.x. - DOI - PubMed

Publication types

MeSH terms