. 2020 Dec 16;3(1):778.
doi: 10.1038/s42003-020-01476-1.

Single-cell analysis supports a luminal-neuroendocrine transdifferentiation in human prostate cancer

Affiliations

Single-cell analysis supports a luminal-neuroendocrine transdifferentiation in human prostate cancer

Baijun Dong et al. Commun Biol. .

Abstract

Neuroendocrine prostate cancer is one of the most aggressive subtypes of prostate tumor. Although much progress has been made in understanding the development of neuroendocrine prostate cancer, the cellular architecture associated with neuroendocrine differentiation in human prostate cancer remain incompletely understood. Here, we use single-cell RNA sequencing to profile the transcriptomes of 21,292 cells from needle biopsies of 6 castration-resistant prostate cancers. Our analyses reveal that all neuroendocrine tumor cells display a luminal-like epithelial phenotype. In particular, lineage trajectory analysis suggests that focal neuroendocrine differentiation exclusively originate from luminal-like malignant cells rather than basal compartment. Further tissue microarray analysis validates the generality of the luminal phenotype of neuroendocrine cells. Moreover, we uncover neuroendocrine differentiation-associated gene signatures that may help us to further explore other intrinsic molecular mechanisms deriving neuroendocrine prostate cancer. In summary, our single-cell study provides direct evidence into the cellular states underlying neuroendocrine transdifferentiation in human prostate cancer.


Conflict of interest statement

The authors declare no competing interests.

Figures

Fig. 1
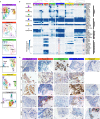
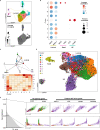
Fig. 1. Single-cell transcriptomic profiling of 6 CRPC tumors.
A Workflow for single-cell extraction, sequencing, and analysis. B Haematoxylin and eosin (H&E) staining for 6 CRPC patients. The scale bars represent 25 μm. C UMAP plots of cells from six patients with cells colored based on the cell types (upper row) and NE scores using the well-established NE marker genes (lower row). The minimum score is indicated by light gray and the maximum score is indicated by blue. The red arrows pointed to high NE score cell population.
Fig. 2
Fig. 2. NE cells present an epithelial phenotype.
A Pairwise correlations between the expression profiles of 12,861 epithelial cells (rows, column) from 6 CRPC samples (color bar). Correlations were calculated across 63 lineage-specific genes (Supplementary Table 2). B Enrichment scores for gene lists including basal, luminal, NE, AR, stemness, and EMT pathway associated genes. Cells were ordered as in (A). Green indicates a low score and purple indicates a high score. C Average inferred CNV signals of corresponding cells in (A). Black indicates the high CNV signal (Supplementary Fig. 3). D UMAP visualization of all 12,861 epithelial cells for the 6 patients with cells colored by the gradient of NE score (top) and average CNV signal (bottom). The minimum score is indicated by light gray and the maximum score is indicated by blue (top) or black (bottom). E UMAP visualization of all 12,861 epithelial cells from 6 patients with color-coded for the sample origin which kept concordant with (A).
Fig. 3
Fig. 3. Intratumor heterogeneity analyses reveal different extents of NE differentiation.
A UMAP visualization of epithelial cell sub-clusters from each sample. B Heatmap depicting prostate lineage marker genes and AR pathway gene expression levels in epithelial cell sub-clusters from each sample. Those highlighted in red frame showed cluster 5 in patient #4 and cluster 4 in patient #6 was NE sub-clusters. C Immunohistochemistry (IHC) staining for K5, K18, AR, SYP, and SOX2 in sections from five samples. Scale bars represent 50 μm.
Fig. 4
Fig. 4. Epithelial cellular relationships in patient #4.
A UMAP visualization of epithelial cells from patient #4 with color-coded for the corresponding sub-cluster (left) and the average inferred CNVs signals (right; gray to black). B Dot plots of the expression level of NE, urothelial-like, basal and luminal lineage markers across the populations shown in (A) (Source data are provided as Supplementary Data 1). C Immunofluorescence (IF) co-staining for K18 (red) and SYP (green) in sections for patient #4. Scale bar represents 100 μm. D The PAGA graph and connectivity scores of the populations shown in (A). E Velocities of epithelial cells from patient #4 are visualized as streamlines in a UMAP-based embedding, in which color-coded for the corresponding populations shown in (A). F Representative confocal fluorescence microscopy of triple co-staining of SYP (green), K18 (gray), and K5 (red) in PC TMA sections. The SYP + NE cells have three subtypes: K18+K5SYP+, K18K5SYP+, and K18+K5+SYP+. Scale bars represent 25 μm. G Pie chart of statistics for PC TMA co-staining results showing that the major part of prostate cancers contain NE cells with exclusive luminal phenotype (K18+SYP+,83/102).
Fig. 5
Fig. 5. Epithelial cellular relationships in patient #6.
A UMAP visualization of epithelial cells from Patient #6 with color-coded for the corresponding sub-cluster (top) and the average inferred CNV signal (bottom; gray to black). B Dot plots of the expression level of NE, basal, and luminal lineage markers across the populations shown in (A) (Source data are provided as Supplementary Data 1). C The PAGA graph and connectivity scores of the populations shown in (A). D Velocities of epithelial cells from patient #6 are visualized as streamlines in a UMAP-based embedding, in which color-coded for the corresponding Seurat cluster in (A). E Phase portraits (upper row) and expression dynamics along latent time (lower row) for specific genes selected from top-ranked likelihood gene set (gene likelihood >0.2).
Fig. 6
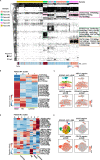
Fig. 6. Intra-tumoral meta-programs underlying NED.
A Heatmap showing scores of 12861 epithelial cells (column, from 6 CRPC patients) for each of 60 programs (rows) derived from NMF analysis of individual samples. Cells and programs are hierarchically clustered, and 3 NE-related meta-programs (P1, P2, and P4) and a cell cycle-related meta-program (P3) are highlighted. B Enrichment scores of prostate lineages: basal, luminal, NE marker genes and AR, stemness, EMT, and cell cycle pathway genes in cells ordered as in (A), with the color-coding for the corresponding CRPC sample. C Pearson correlation between the expression of genes of P1, P2, and P4 and the NE score, as measured by the average expression of 14 known NE markers. Three previously published bulk RNA-seq datasets were used in this analysis, as described in the “Methods” section. Highlighted in red are some known NED genes (Source data are provided as Supplementary Data 1). D Heatmap depicting strong expression of 121 genes (Pearson R ≥ 0.3, as measured by Pearson correlation analysis shown in (C) in ARNE+ group of Morrissey dataset. Total samples are divided into five groups as previously suggested in ref. .
Fig. 7
Fig. 7. Transcription-factor regulatory networks underlying NED.
A Heatmap of SCENIC binary regulon activities (row) and NE scores (row) of 12,861 epithelial cells (column). Three TF regulatory networks with high activities in NE cells were highlighted. B Heatmap of the mean regulon activities (row) that differentially expressed on epithelial clusters (column) of patient #4. C t-SNE on the SCENIC regulon activity matrix and the representative regulon activities on epithelial cells from patient #4. Cells are colored by the corresponding cluster and gradient of regulon activity (gray to red). D Heatmap of the mean regulon activities (row) that differentially expressed on epithelial clusters (column) of patient #6. E t-SNE on the SCENIC regulon activity matrix and the representative regulon activities on epithelial cells from patient #6. Cells are colored by the corresponding cluster and gradient of regulon activity (gray to red).
Fig. 8
Fig. 8. Cellular relationship and disease progression model of NEPC.
Schematic illustration of tumor evolution toward the neuroendocrine phenotype, in which dotted arrows indicate the potential relationship between cell lineages and the solid arrows indicate that NEPC is directly originated from AR-dependent tumor cells. In this model, we suppose that the NE precursor, AR-independent tumor cell, directly transdifferentiates from the luminal-like tumor cell, and that is the precursor, which will next evolve in forming the focal NEPC and finally progress to small-cell (pure) NEPC. The extent of AR and NE signature scores varies over the spectrum of adenocarcinoma to neuroendocrine transdifferentiation (orange indicates a high level of AR signal and green indicates a high level of NE signal).

References

    1. Graf T, Enver T. Forcing cells to change lineages. Nature. 2009;462:587–594. doi: 10.1038/nature08533. - DOI - PubMed
    1. Le Magnen C, Shen MM, Abate-Shen C. Lineage plasticity in cancer progression and treatment. Annu. Rev. Cancer Biol. 2018;2:271–289. doi: 10.1146/annurev-cancerbio-030617-050224. - DOI - PMC - PubMed
    1. Beltran, H. et al. The role of lineage plasticity in prostate cancer therapy resistance. Clin. Cancer Res. 10.1158/1078-0432.ccr-19-1423 (2019). - PMC - PubMed
    1. Davies AH, Beltran H, Zoubeidi A. Cellular plasticity and the neuroendocrine phenotype in prostate cancer. Nat. Rev. Urol. 2018;15:271–286. doi: 10.1038/nrurol.2018.22. - DOI - PubMed
    1. Mu P, et al. SOX2 promotes lineage plasticity and antiandrogen resistance in TP53-and RB1-deficient prostate cancer. Science. 2017;355:84–88. doi: 10.1126/science.aah4307. - DOI - PMC - PubMed

Publication types