. 2021 Feb;16(2):579-602.
doi: 10.1038/s41596-020-00433-w. Epub 2020 Dec 16.

Generation and long-term culture of advanced cerebral organoids for studying later stages of neural development

Affiliations

Generation and long-term culture of advanced cerebral organoids for studying later stages of neural development

Stefano L Giandomenico et al. Nat Protoc. 2021 Feb.

Abstract

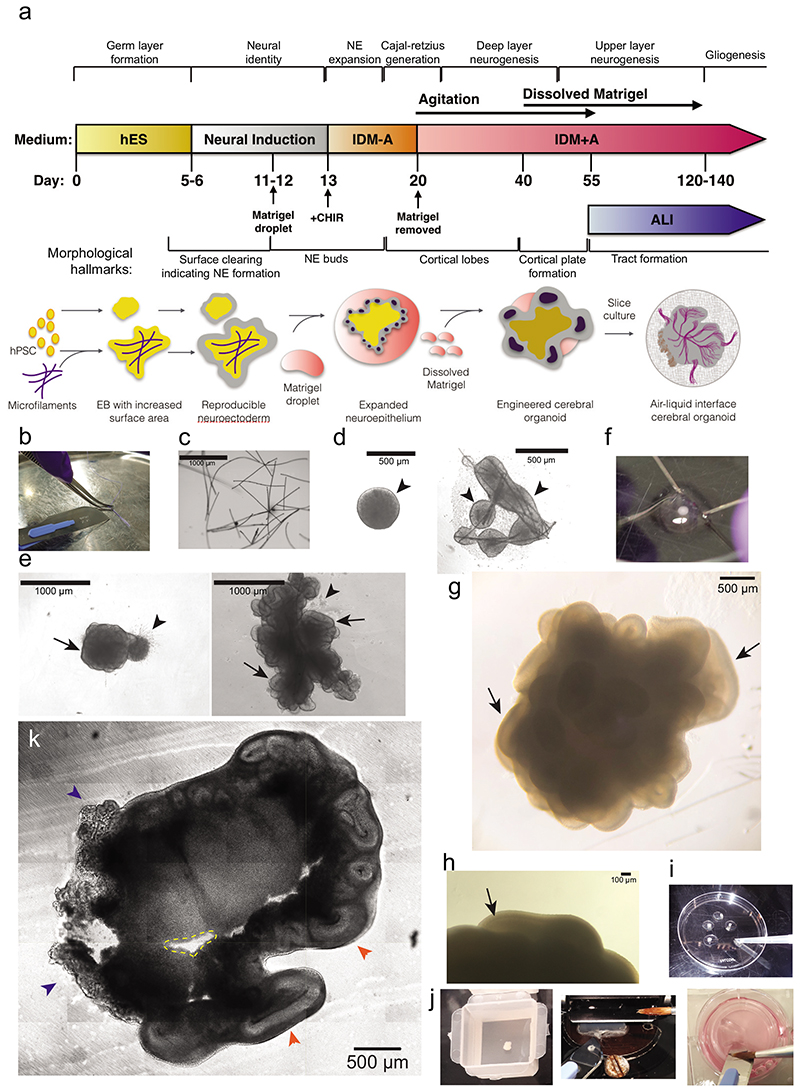
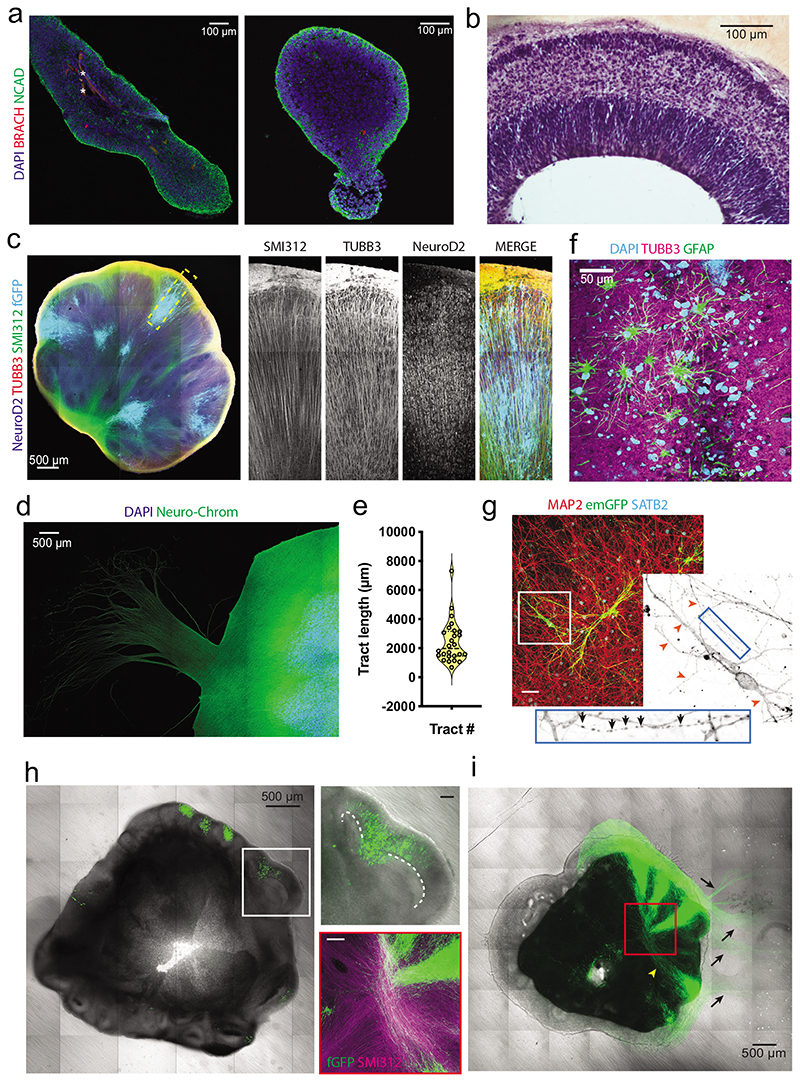
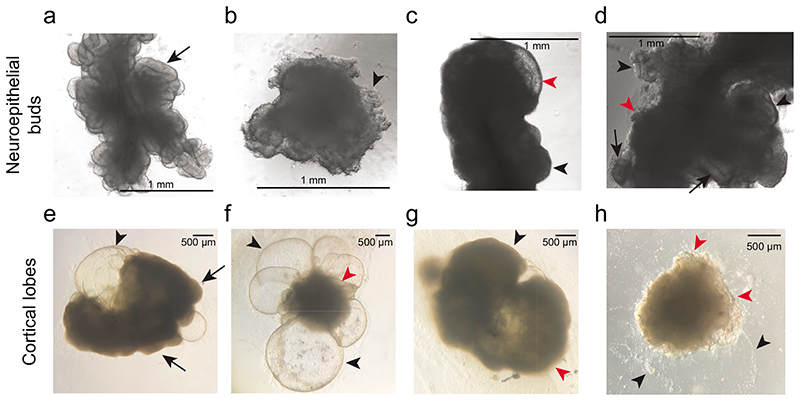
Cerebral organoids, or brain organoids, can be generated from a wide array of emerging technologies for modeling brain development and disease. The fact that they are cultured in vitro makes them easily accessible both genetically and for live assays such as fluorescence imaging. In this Protocol Extension, we describe a modified version of our original protocol (published in 2014) that can be used to reliably generate cerebral organoids of a telencephalic identity and maintain long-term viability for later stages of neural development, including axon outgrowth and neuronal maturation. The method builds upon earlier cerebral organoid methodology, with modifications of embryoid body size and shape to increase surface area and slice culture to maintain nutrient and oxygen access to the interior regions of the organoid, enabling long-term culture. We also describe approaches for introducing exogenous plasmid constructs and for sparse cell labeling to image neuronal axon outgrowth and maturation over time. Together, these methods allow for modeling of later events in cortical development, which are important for neurodevelopmental disease modeling. The protocols described can be easily performed by an experimenter with stem cell culture experience and take 2-3 months to complete, with long-term maturation occurring over several months.


Conflict of interest statement

Declaration of competing financial interests

M.A.L. is an inventor on two cerebral organoid patents with licensing agreements with third parties, including Stem Cell Technologies.

Figures

Figure 1
Figure 1. Methodological overview and key steps.
a. Timeline of the protocol for generating improved cerebral organoids and air-liquid interface (ALI) cultures with key developmental stages provided above and morphological hallmarks provided below. NE = neuroepithelium. b. Image to demonstrate microscaffold preparation. The suture is splayed with the blunt side of the scalpel blade, then cut into 1 mm pieces on a sterile tray. c. Image showing rehydrated fibres observed under a phase contrast microscope (scale bar = 1000 μm). d. Images of round EB at day 7 after successful neural induction (left-hand panel), showing a smooth border and brightening edges (arrowheads), and a micropatterned organoid at day 7 (right-hand panel), demonstrating bright smooth edges (arrowheads) indicative of proper neural induction. e. Images of reduced-size organoid made with 3,000 cells at Day 12 observed under phase contrast (left-hand panel) and a micropatterned organoid at Day 13 (right-hand panel). Note that both organoids predominantly consist of neuroepithelial buds (arrows) with sparse disorganized areas of migratory cells (arrowheads). Scale bars = 1000 μm. f. Image to show the process of removing Matrigel droplets by microdissection with syringe needles. One needle is used as a pin to hold the Matrigel droplet while the other is used as a blade to cut or tear off the Matrigel until most is removed. g. Bright-field image at day 50 showing well-formed, large and smooth cortical lobes (arrows) covering the entire organoid. h. Image to show a visible cortical plate under phase contrast on a Day 58 organoid (arrow). Scale bar = 100 μm. i. Image to show process of preparation for slice culture. Organoids are transferred to the lid of a 60 mm dish with a cut 1 ml tip and gently washed with HBSS. j. Image of an organoid just after embedding in 3% low-melt agarose within a peel-A-way mold (left-hand panel). We also provide an image to show the process of section collection with a scalpel and a brush (middle panel); the brush is used to manipulate the section only through contact with the agarose. The tissue section is slid and loaded onto the scalpel blade for transfer, before being deposited onto the cell culture insert by gently pushing the edge of the section off the scalpel blade (right-hand panel). The brush can also be used to apply medium to the scalpel blade to facilitate sliding of the tissue section off the blade. k. Bright-field image of a tissue slice of a 54-day old organoid immediately after sectioning. The ALI-CO displays regions of choroid plexus (blue arrowheads) and large cortical walls organized around what is left of the cortical ventricles (orange arrowheads). Small cavities (dashed yellow line) in the organoid section can be caused by detachment of small regions of necrotic tissue that is particularly brittle. Scale bar = 500 μm.
Figure 2
Figure 2. Expected results upon histological and immunohistochemical analysis.
a. Image of a micropatterned organoid at Day 11 (left-hand panel) and a non-micropatterned organoid made with 3,000 cells at Day 10 stained for germ layer markers N-cadherin (N-cad) for neural ectoderm and Brachyury (Brach) for mesoderm (right-hand panel). Both organoids show primarily neural differentiation. Autofluorescent fibres are marked with an asterisk. Scale bars = 100 μm. b. Image to show radial arrangement of cell nuclei in the cortical plate as visible by hematoxylin and eosin (H&E) staining of a section of a Day 69 organoid. Scale bar = 100 μm. c. Immunofluorescence image of an 88-day-old H9 ALI-CO (60+28 days at the ALI) electroporated with fGFP on day 58. The section was stained for the neuronal nuclear marker NeuroD2, the neuronal cytoplasmic marker TUBB3 and the axonal marker SMI312. Large SMI312+/TUBB3+ axon bundles are seen to project between different lobules of the ALI-CO, and the lobules display radial organization as shown by the combination of markers used. A magnified view of the boxed area in the far-left-hand image is shown in the other images, showing radial organization of neurons (NeuroD2+) within lobules to form an ordered array of cell bodies (fGFP+), axons (SMI312+) and more widely neuronal processes (TUBB3+), as well as a merged image showing all of these processes at once. Scale bar = 500 μm. d. Immunofluorescence image of an 88-day-old H9 ALI-CO (54+34 days at the ALI), showing a large escaping tract positive for the panaxonal marker Neuro-Chrom but devoid of cell bodies (DAPI-). Scale bar = 500 μm. e. Violin plot of tract length quantification performed on a total of 26 fGFP+ tracts from 6 ALI-COs aged between 69-75 days total derived from H1 and H9 hESCs. The solid line corresponds to the median (M=1978.5 μm) and the dashed lines to the first (Q1=1472.7 μm) and third (Q3= 3126.5 μm) quartiles. f. Immunofluorescence image of a 168-day-old H9 ALI-CO (68+100 days at the ALI), showing a dense TUBB3+ neuropil populated by GFAP+ astrocytes with characteristic star-shape. Scale bar = 50 μm g. Immunofluorescence image of a 280-day-old H9 ALI-CO (45+235 days at the ALI) sparsely labeled with EmGFP Sendai virus and stained for the dendritic marker MAP2 and the nuclear neuron upper-layer marker SatB2 (left-hand panel). The image reveals a thick and healthy neuropil with individual EmGFP+ neurons displaying mature morphology. The right-hand panel is a magnified view of the area highlighted by a white box in the left-hand panel. The blue box shows a further magnification of an axon with varicosities (black arrows). Scale bars 50 μm. h. Overlay of bright-field and fluorescence images of an fGFP electroporated 60-day-old ALI-CO immediately after sectioning. The top-right panel, which is a magnified view of the area highlighted by a white box in the left-hand panel, shows individual electroporated cortical lobes. The dashed white line marks the apical surface. Scale bars = 500 μm (left-hand panel) and 100 μm (right-hand panels). i. Overlay of bright-field and fluorescence images of the ALI-CO slice shown in Figure 2h after 28 days at the ALI (60+28 days total). Over time, the ALI-CO has developed thick internal (yellow arrowhead) and external (black arrows) fGFP+ tracts. The red box marks the magnified region stained for panaxonal marker SMI312+ in combination with the electroporated fGFP+, showing their presence in a specific tract within the interior. Scale bars = 500 μm.
Figure 3
Figure 3. Examples of morphological hallmarks and suboptimal morphologies.
a-d. Representative images of acceptable and suboptimal organoids based on the morphology of neuroepithelial buds. a. An optimal organoid 3 days after Matrigel embedding with excellent neuroepithelial bud morphology demonstrated by their brightness, smooth borders and apicobasal thickness (arrow). b. A suboptimal organoid 2 days after Matrigel embedding, displaying no evidence of proper neuroepithelial bud formation, instead forming very thin and convoluted epithelia (arrowhead), likely of a nonneural identity. c. A suboptimal organoid 5 days after Matrigel embedding, displaying suboptimal buds that are dark and lack a visible lumen (black arrowhead). A cyst can also be seen (red arrowhead), which should not be present at this early time point and further indicates improper identity. d. A suboptimal organoid 5 days after Matrigel embedding, displaying some healthy neuroepithelial buds (arrows) but an abundance of nonneural thin epithelia (red arrowheads) and other dark buds lacking a smooth border (black arrowhead). e-h. Representative images of acceptable and suboptimal organoids based on cortical lobe morphology. e. An acceptable organoid at day 55 with numerous cortical lobules (arrows). Although a large cyst is present (arrowhead), the adjacent cortical tissue appears well developed and healthy. f. A suboptimal organoid at day 55, lacking visible cortical lobes and displaying numerous cysts (black arrowheads) and central disorganized tissue (red arrowhead). g. A suboptimal organoid at day 55, displaying regions with a smooth border but that fail to form protruding lobules (black arrowhead). The rest of the tissue also appears disorganized and lacks smooth borders (red arrowhead). h. A suboptimal organoid at day 40, displaying convoluted thin epithelia (red arrowheads) and numerous migrating cells (black arrowheads).

Similar articles

Cited by

References

    1. Lancaster MA, et al. Cerebral organoids model human brain development and microcephaly. Nature. 2013;501:373–379. - PMC - PubMed
    1. Paşca AM, et al. Functional cortical neurons and astrocytes from human pluripotent stem cells in 3D culture. Nature Methods. 2015;12:671–678. - PMC - PubMed
    1. Kadoshima T, et al. Self-organization of axial polarity, inside-out layer pattern, and speciesspecific progenitor dynamics in human ES cell-derived neocortex. Proc Natl Acad Sci USA. 2013;110:20284–20289. - PMC - PubMed
    1. Zhang S-C, Wernig M, Duncan ID, Brüstle O, Thomson JA. In vitro differentiation of transplantable neural precursors from human embryonic stem cells. Nat Biotechnol. 2001;19:1129–1133. - PubMed
    1. Eiraku M, et al. Self-Organized Formation of Polarized Cortical Tissues from ESCs and Its Active Manipulation by Extrinsic Signals. Cell Stem Cell. 2008;3:519–532. - PubMed

Publication types