. 2021 Jan;589(7842):415-419.
doi: 10.1038/s41586-020-03043-4. Epub 2020 Dec 16.

Mapping routine measles vaccination in low- and middle-income countries

Collaborators

Mapping routine measles vaccination in low- and middle-income countries

Local Burden of Disease Vaccine Coverage Collaborators. Nature. 2021 Jan.

Abstract

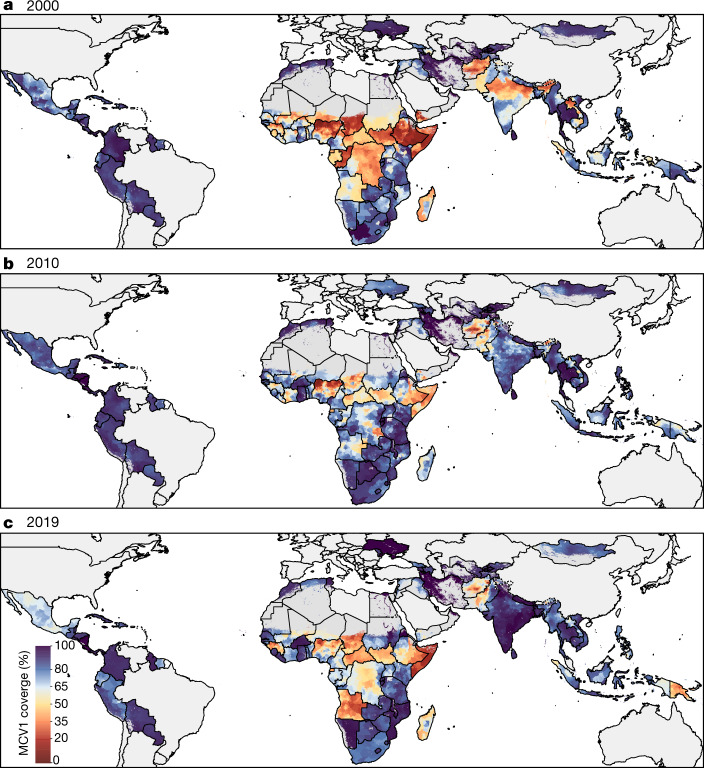
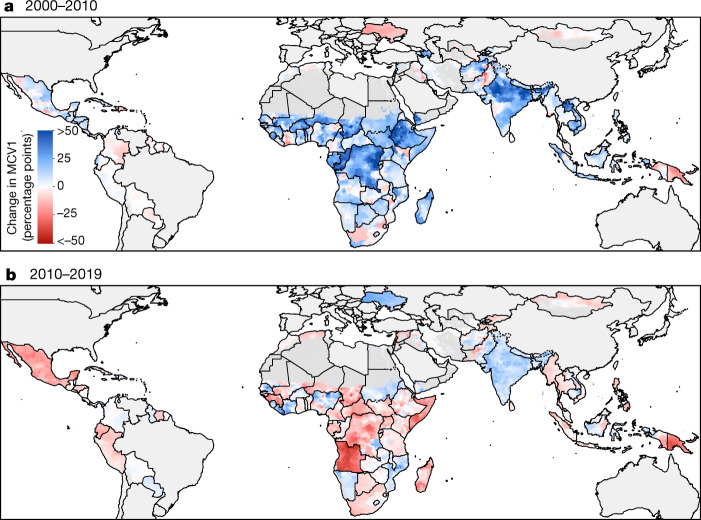
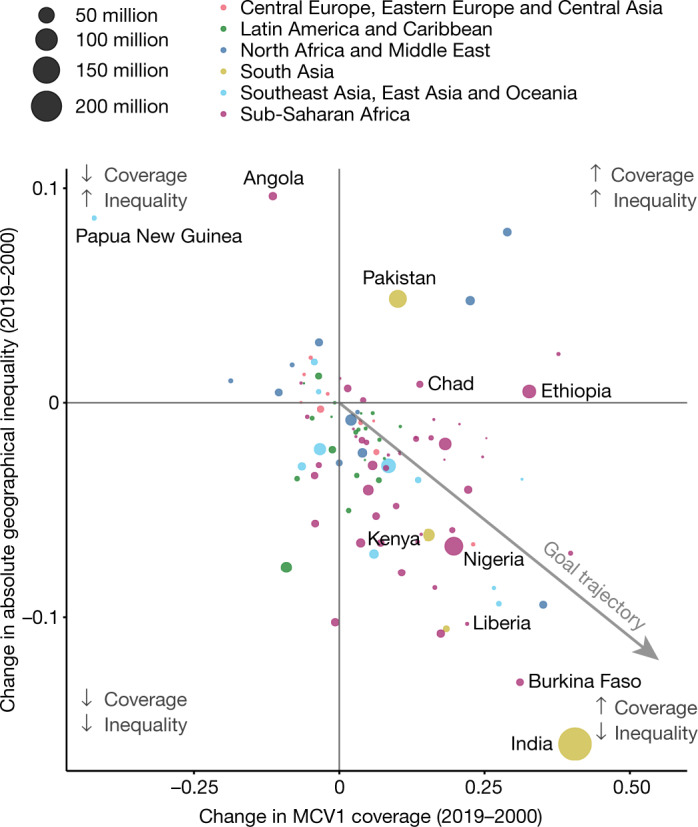
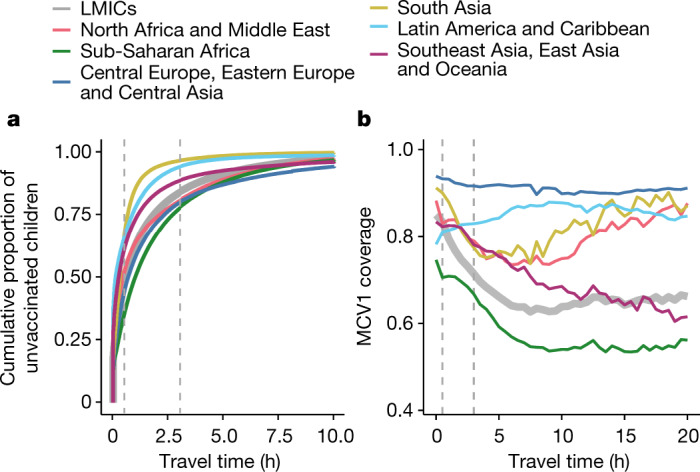
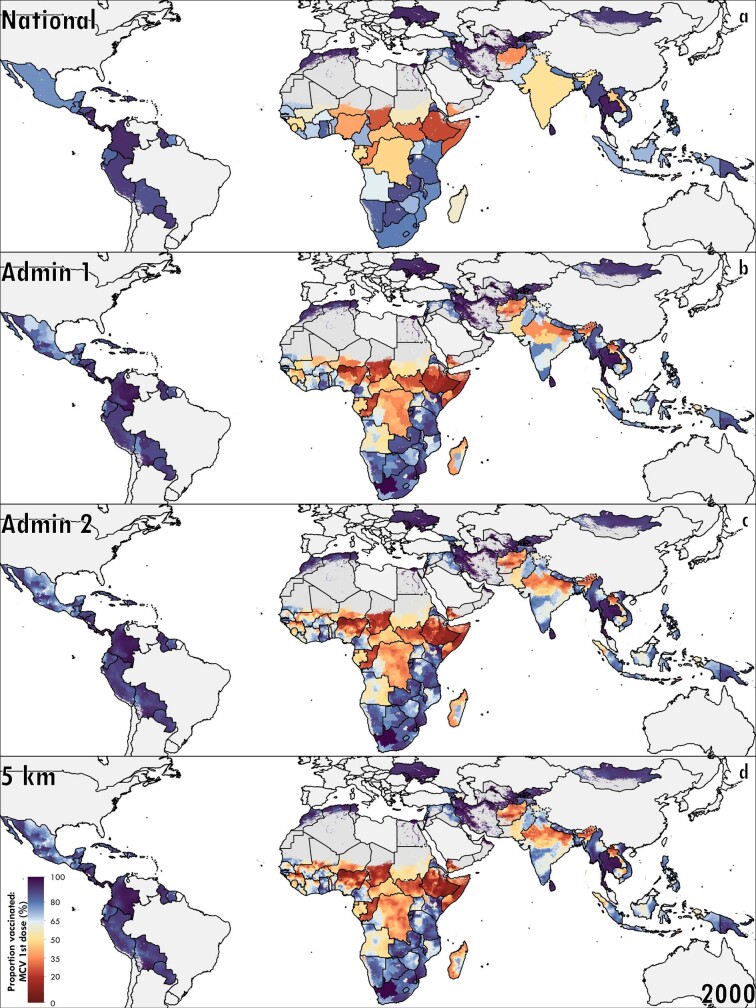
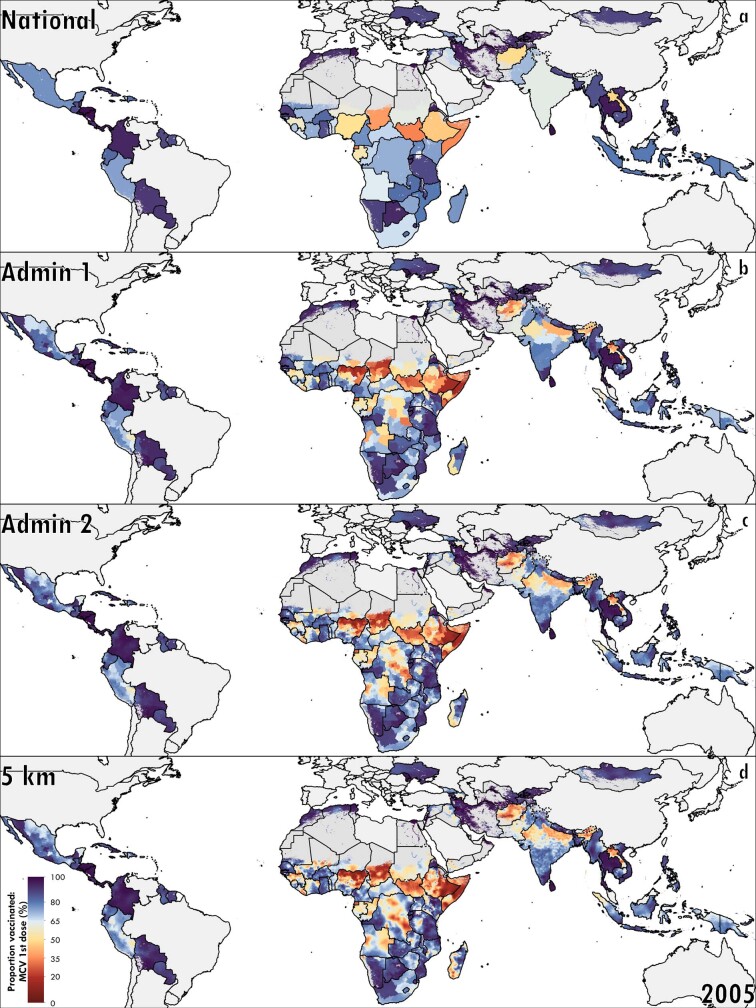
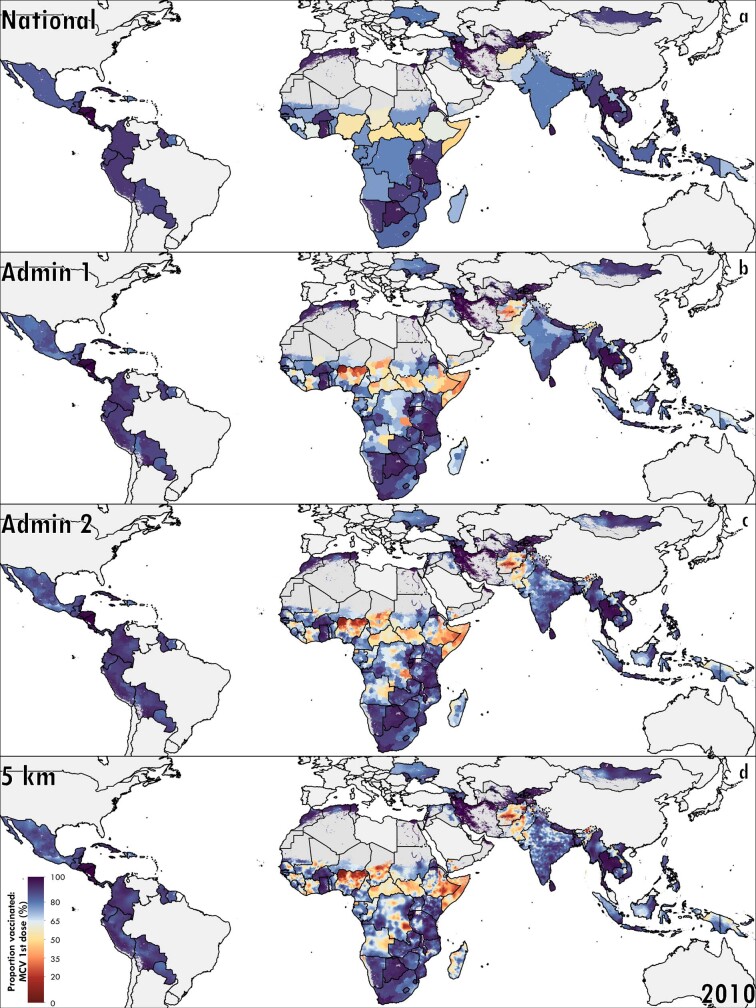
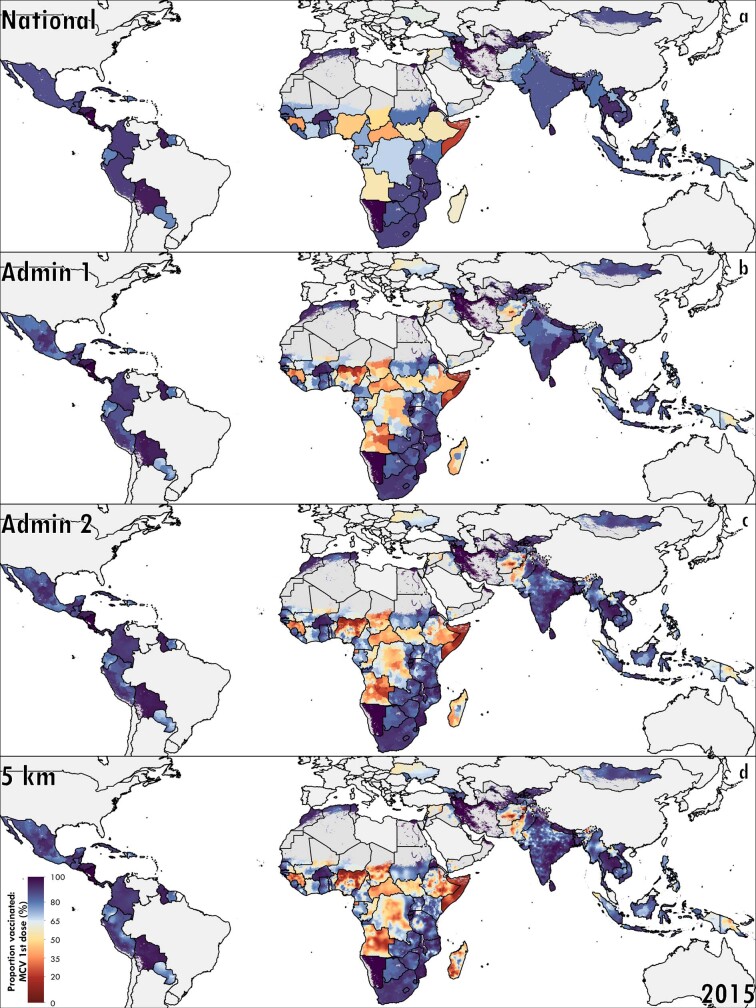
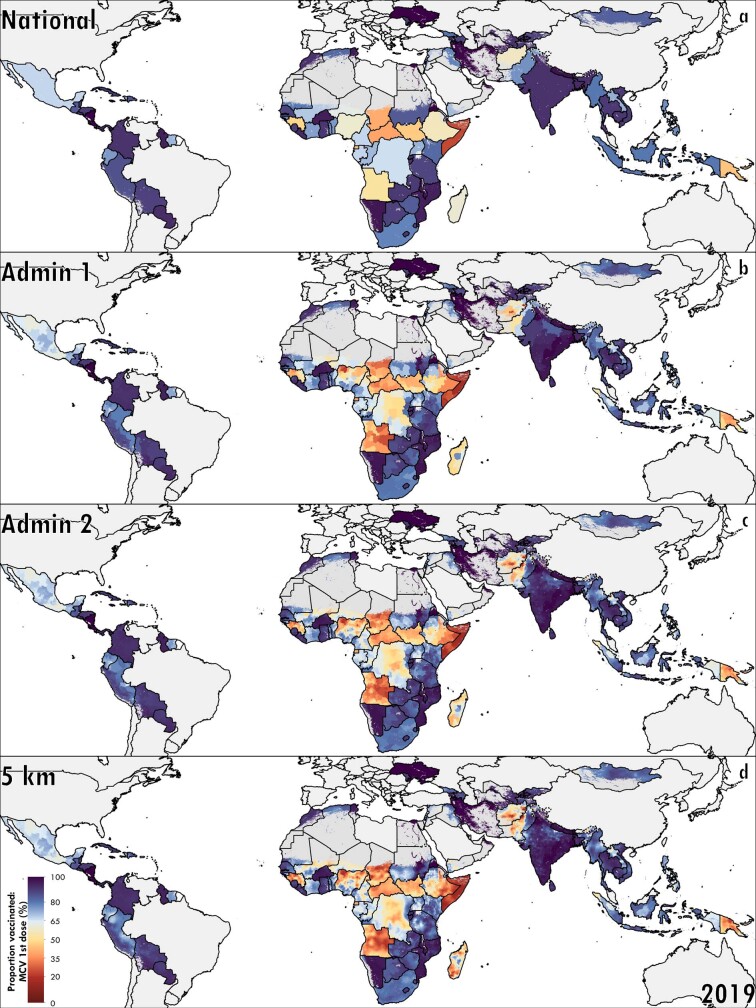
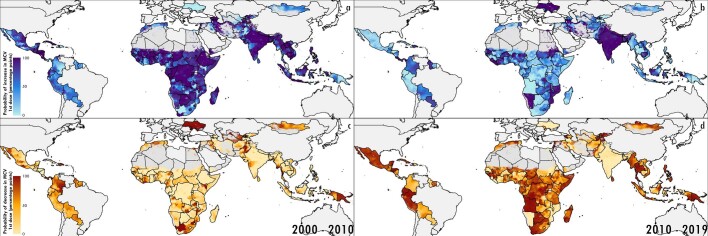
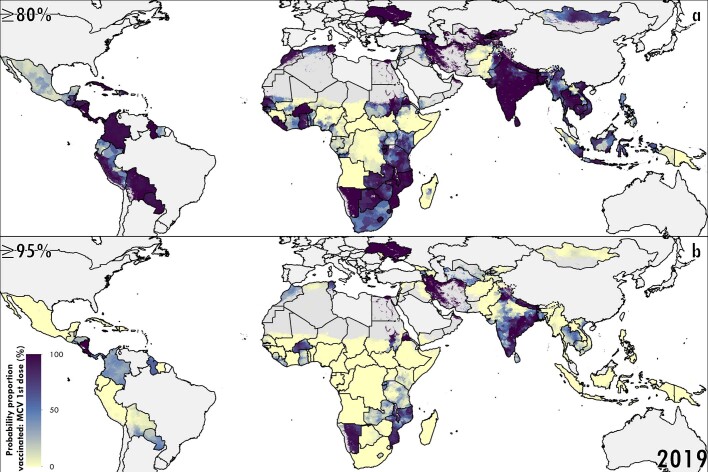
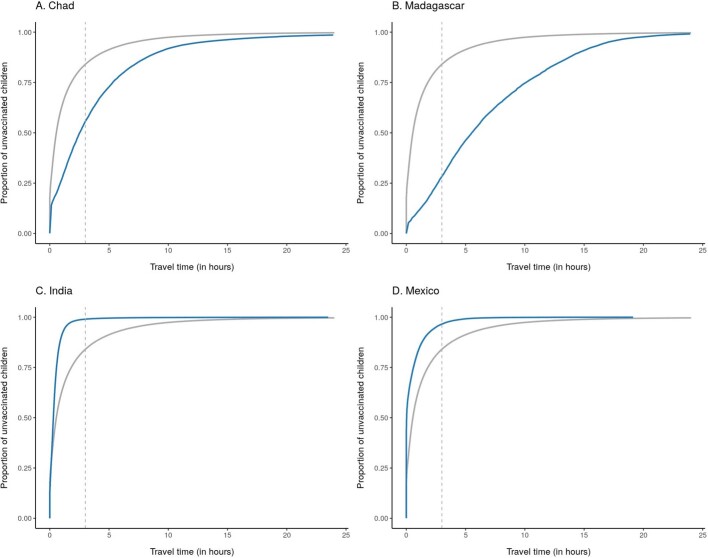
The safe, highly effective measles vaccine has been recommended globally since 1974, yet in 2017 there were more than 17 million cases of measles and 83,400 deaths in children under 5 years old, and more than 99% of both occurred in low- and middle-income countries (LMICs)1-4. Globally comparable, annual, local estimates of routine first-dose measles-containing vaccine (MCV1) coverage are critical for understanding geographically precise immunity patterns, progress towards the targets of the Global Vaccine Action Plan (GVAP), and high-risk areas amid disruptions to vaccination programmes caused by coronavirus disease 2019 (COVID-19)5-8. Here we generated annual estimates of routine childhood MCV1 coverage at 5 × 5-km2 pixel and second administrative levels from 2000 to 2019 in 101 LMICs, quantified geographical inequality and assessed vaccination status by geographical remoteness. After widespread MCV1 gains from 2000 to 2010, coverage regressed in more than half of the districts between 2010 and 2019, leaving many LMICs far from the GVAP goal of 80% coverage in all districts by 2019. MCV1 coverage was lower in rural than in urban locations, although a larger proportion of unvaccinated children overall lived in urban locations; strategies to provide essential vaccination services should address both geographical contexts. These results provide a tool for decision-makers to strengthen routine MCV1 immunization programmes and provide equitable disease protection for all children.


Conflict of interest statement

This study was funded by the Bill & Melinda Gates Foundation. Authors employed by the Bill & Melinda Gates Foundation provided feedback on initial maps and drafts of this manuscript. Otherwise, the funders of the study had no role in study design, data collection, data analysis, data interpretation, or writing of the final report. The corresponding authors had full access to all the data in the study and had final responsibility for the decision to submit for publication. O.O.A. is supported by DSI-NRF Centre of Excellence for Epidemiological Modelling and Analysis (SACEMA). C.A.T.A. reports personal fees from Johnson & Johnson (The Philippines), outside the submitted work. M.L.B. reports grants from the US Environmental Protection Agency, the National Institutes of Health (NIH) and the Wellcome Trust Foundation, during the conduct of the study. M.L.B. also reports honoraria and/or travel reimbursements from the NIH (for the review of grant proposals), American Journal of Public Health (participation as editor), Global Research Laboratory and Seoul National University, Royal Society London UK, Ohio University, Atmospheric Chemistry Gordon Research Conference, Johns Hopkins Bloomberg School of Public Health, Arizona State University, Ministry of the Environment Japan, Hong Kong Polytechnic University, University of Illinois–Champaign, and University of Tennessee–Knoxville. S. Basu reports grants from the NIH, grants from the US Centers for Disease Control and Prevention, grants from the US Department of Agriculture, grants from Robert Wood Johnson Foundation, personal fees from Research Triangle Institute, personal fees from Collective Health, personal fees from KPMG, personal fees from HealthRight360, personal fees from PLOS Medicine, personal fees from The New England Journal of Medicine, outside the submitted work. F.D. reports grants from the Bill & Melinda Gates Foundation, during the conduct of the study. A. Deshpande reports grants from the Bill & Melinda Gates Foundation, during the conduct of the study. S.J.D. reports grants from The Fleming Fund at the UK Department of Health & Social Care, during the conduct of the study. S.M.S.I. received funding from the National Heart Foundation of Australia. J.J.J. reports personal fees from AMGEN, personal fees from ALAB, personal fees from TEVA, personal fees from SYNEXUS, personal fees from BOEHRINGER INGELHEIM and personal fees from VALEANT, outside the submitted work. H.J.L. reports grants from GSK, outside the submitted work. W.M. is Program Analyst in Population and Development at the United Nations Population Fund (UNFPA), an institution which does not necessarily endorse this study. T. Pilgrim reports grants and personal fees from Biotronik, grants and personal fees from Boston Scientific and grants from Edwards Lifesciences, outside the submitted work. M.J.P. reports grants and personal fees from MSD, GSK, Pfizer, Boehringer Ingelheim, BMS, Novavax, Astra Zeneca, Sanofi, IQVIA and other pharmaceutical industries, personal fees from Quintiles, Novartis, Pharmerit and Seqirus, grants from Bayer, BioMerieux, WHO, EU, FIND, Antilope, DIKTI, LPDP, Budi, and other from Ingress Health, Pharmacoeconomics Advice Groningen (PAG Ltd), Asc Academics, outside the submitted work. M.J.P. holds stocks in Ingress Health and PAG Ltd and is advisor to Asc Academics, all of which are pharmacoeconomic consultancy companies, outside of submitted work. J. A. Singh reports personal fees from Crealta/Horizon, Medisys, Fidia, UBM LLC, Trio Health, Medscape, WebMD, Clinical Care Options, Clearview Healthcare Partners, Putnam Associates, Spherix, Practice Point Communications, the NIH and the American College of Rheumatology, personal fees from the speaker’s bureau of Simply Speaking, stock options in Amarin Pharmaceuticals and Viking Pharmaceuticals, non-financial support from the steering committee of OMERACT, an international organization that develops measures for clinical trials and receives arm’s length funding from 12 pharmaceutical companies, outside of the submitted work. J. A. Singh serves on the FDA Arthritis Advisory Committee, is a member of the Veterans Affairs Rheumatology Field Advisory Committee, and is the editor and the Director of the UAB Cochrane Musculoskeletal Group Satellite Center on Network Meta-analysis, all outside the submitted work. R.U. reports other financial activities from Deakin University, outside the submitted work. J.F.M. reports grants from the Bill and Melinda Gates Foundation, during the conduct of the study.

Figures

Fig. 1
Fig. 1. Estimated MCV1 coverage among districts in 101 LMICs, 2000–2019.
ac, MCV1 coverage among target population in districts in 2000 (a), 2010 (b) and 2019 (c). Countries excluded from the analysis and pixels classified as ‘barren or sparsely vegetated’ based on European Space Agency Climate Change Initiative (ESA-CCI) satellite data or with fewer than 10 people per 1 × 1-km2 pixel based on WorldPop estimates are masked in grey,.
Fig. 2
Fig. 2. Estimated absolute changes in MCV1 coverage in the early (2000–2010) and late (2010–2019) study periods.
a, b, Mean district-level absolute differences in MCV1 coverage from 2000 to 2010 (a) and from 2010 to 2019 (b). Countries excluded from the analysis and pixels classified as ‘barren or sparsely vegetated’ based on ESA-CCI satellite data or with fewer than 10 people per 1 × 1-km2 pixel based on WorldPop estimates are masked in grey,.
Fig. 3
Fig. 3. Absolute geographical inequality of MCV1 coverage in 2000 and 2019.
We compared the change in geographical absolute inequality to change in national-level coverage from 2000 to 2019. Points are sized by under-5 population size.
Fig. 4
Fig. 4. Vaccination status in 2019 and geographical remoteness.
Cumulative proportion of unvaccinated children living within the spectrum of the travel time (in hours) to a major city or settlement per region (left) and coverage among children living within the spectrum of travel time to a major city or settlement per region (right). Vertical dashed grey line shows thresholds for ‘urban’ and ‘remote rural’, living within 30 min and at least 3 h from a major city or settlement, respectively.
Extended Data Fig. 1
Extended Data Fig. 1. Data processing and geospatial modelling flowchart.
Survey data and the suite of covariates used in modelling are first compiled and processed (orange and grey). The modelling process (purple) consists of data being used in a stacked generalization ensemble modelling process via boosted regression tree, lasso and generalized additive models, fitting the second-stage spatiotemporal model using integrated nested Laplace approximation, and finally calibration to GBD estimates (blue). Steps in dark green and outputs in yellow indicate the post-estimation process when the full posterior distribution of predications is transformed to both 5 × 5-km2 and first and second administrative-unit-level maps and their various final results. Intermediate outputs throughout the process are shown in blue and overall processes are shown in light green.
Extended Data Fig. 2
Extended Data Fig. 2. Regions of countries used in modelling.
Analyses were divided into 13 regions based on the GBD super-regions to allow for locations similar in data availability and patterns of vaccine coverage to be analysed using similar covariate and modelling relationships. Each colour represents a different region, as described in the legend.
Extended Data Fig. 3
Extended Data Fig. 3. National, first- and second-administrative-unit level, and pixel-level MCV1 coverage, 2000.
ad, Posterior means are represented at the national (a), first-administrative-unit (b), second-administrative-unit (c) and 5 × 5-km2 pixel (d) levels. Pixels that are grey in colour are either not included in the analysis, or have been classified as being ‘barren or sparsely vegetated’ or had fewer than 10 people per 1 × 1-km2 pixel,.
Extended Data Fig. 4
Extended Data Fig. 4. National, first- and second-administrative level, and pixel-level MCV1 coverage, 2005.
ad, Posterior means are represented at the national (a), first-administrative-unit (b), second-administrative-unit (c) and 5 × 5-km2 pixel (d) levels. Pixels that are grey in colour are either not included in the analysis, or have been classified as being ‘barren or sparsely vegetated’ or had fewer than 10 people per 1 × 1-km2 pixel,.
Extended Data Fig. 5
Extended Data Fig. 5. National, first- and second-administrative-unit level, and pixel-level MCV1 coverage, 2010.
ad, Posterior means are represented at the national (a), first-administrative-unit (b), second-administrative-unit (c) and 5 × 5-km2 pixel (d) levels. Pixels that are grey in colour are either not included in the analysis, or have been classified as being ‘barren or sparsely vegetated’ or had fewer than 10 people per 1 × 1-km2 pixel,.
Extended Data Fig. 6
Extended Data Fig. 6. National, first- and second-administrative-unit level, and pixel-level MCV1 coverage, 2015.
ad, Posterior means are represented at the national (a), first-administrative-unit (b), second-administrative-unit (c) and 5 × 5-km2 pixel (d) levels. Pixels that are grey in colour are either not included in the analysis, or have been classified as being ‘barren or sparsely vegetated’ or had fewer than 10 people per 1 × 1-km2 pixel,.
Extended Data Fig. 7
Extended Data Fig. 7. National, first- and second-administrative-unit level, and pixel-level MCV1 coverage, 2019.
ad, Posterior means are represented at the national (a), first-administrative-unit (b), second-administrative-unit (c) and 5 × 5-km2 pixel (d) levels. Pixels that are grey in colour are either not included in the analysis, or have been classified as being ‘barren or sparsely vegetated’ or had fewer than 10 people per 1 × 1-km2 pixel,.
Extended Data Fig. 8
Extended Data Fig. 8. Probability of increased or decreased coverage from 2000 to 2010 and 2010 to 2019.
ad, Probability of an increase in coverage in each district (a, b) and probability of decrease in coverage in each district (c, d) from 2000 to 2010 (a, c) and 2010 to 2019 (b, d).
Extended Data Fig. 9
Extended Data Fig. 9. Estimated district-level probabilities of reaching MCV1 coverage targets in 2019.
a, b, Probability of districts having achieved 80% GVAP and Measles Rubella Initiative targets (a) and 95% critical proportion to immunize coverage targets to reach herd immunity (b). Countries excluded from the analysis and pixels classified as ‘barren or sparsely vegetated’ based on ESA-CCI satellite data or with fewer than 10 people per 1 × 1-km2 pixel based on WorldPop estimates are masked in grey,.
Extended Data Fig. 10
Extended Data Fig. 10. Country examples of concentration curves.
Concentration curves of the cumulative proportion of unvaccinated children as a function of travel time (in hours) in Chad (a), Madagascar (b), India (c) and Mexico (d). Curves for both the indicated countries (blue) and all LMICs (grey) are shown.

Comment in

References

    1. McLean HQ, Fiebelkorn AP, Temte JL, Wallace GS. Prevention of measles, rubella, congenital rubella syndrome, and mumps, 2013: summary recommendations of Advisory Committee on Immunization Practices (ACIP) MMWR Morb. Mortal. Wkly Rep. 2013;62:1–34. - PubMed
    1. Keja K, Chan C, Hayden G, Henderson RH. Expanded programme on immunization. World Health Stat. Q. 1988;41:59–63. - PubMed
    1. World Health Assembly. WHO Expanded Programme on Immunization (World Health Organization, 1974).
    1. GBD 2019 Diseases and Injuries Collaborators Global burden of 369 diseases and injuries in 204 countries and territories, 1990–2019: a systematic analysis for the Global Burden of Disease Study 2019. Lancet. 2020;396:1204–1222. - PMC - PubMed
    1. WHO. Global Vaccine Action Plan 2011–2020. http://www.who.int/immunization/global_vaccine_action_plan/GVAP_doc_2011... (2012).

Publication types

MeSH terms