. 2021 Jan;589(7842):448-455.
doi: 10.1038/s41586-020-03046-1. Epub 2020 Dec 16.

Fat1 deletion promotes hybrid EMT state, tumour stemness and metastasis

Affiliations

Fat1 deletion promotes hybrid EMT state, tumour stemness and metastasis

Ievgenia Pastushenko et al. Nature. 2021 Jan.

Abstract

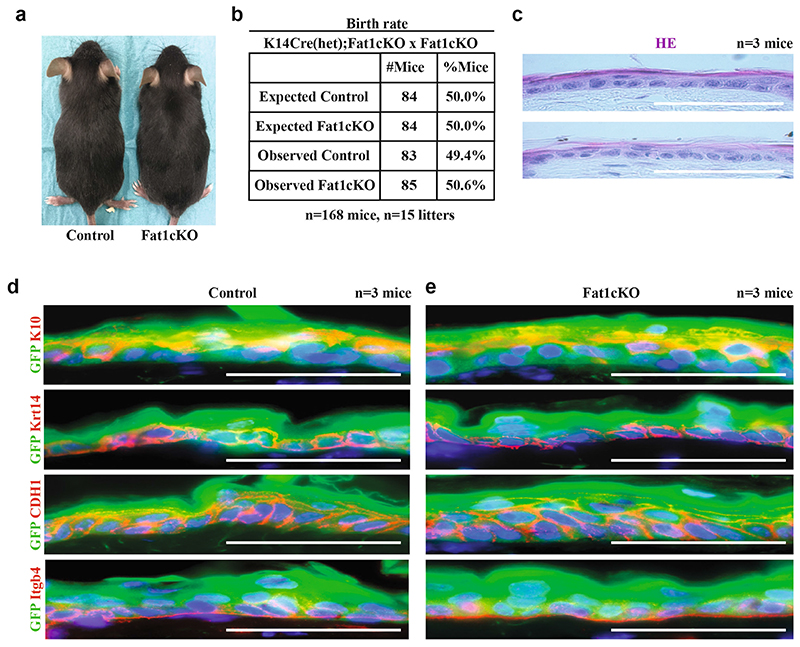
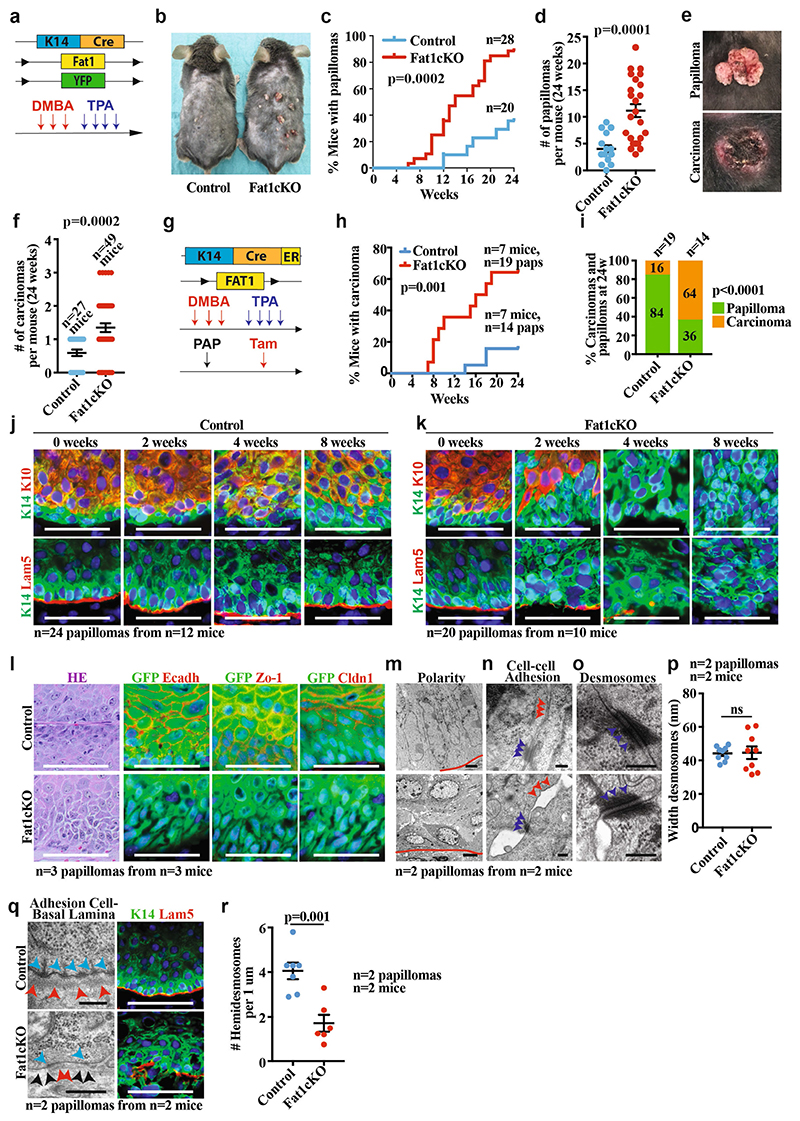
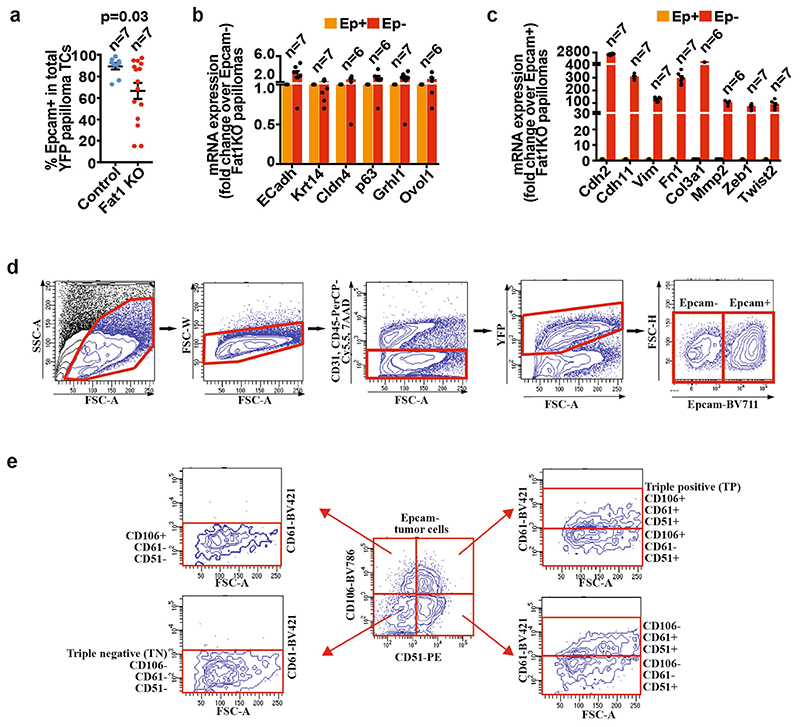
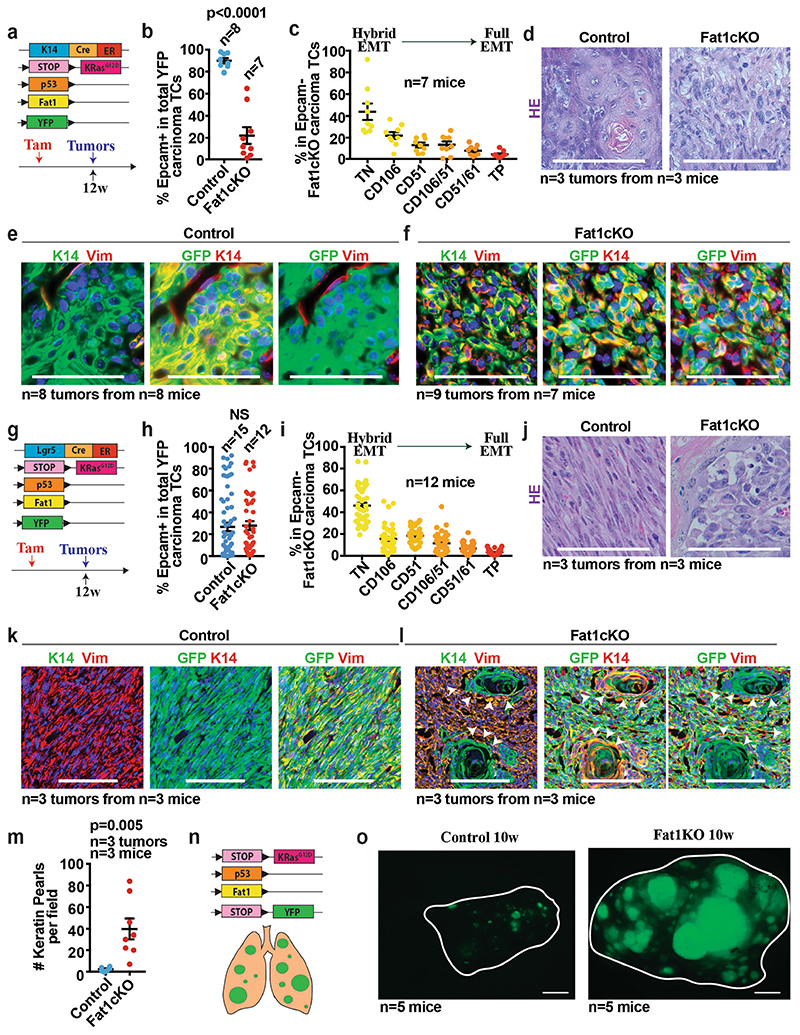
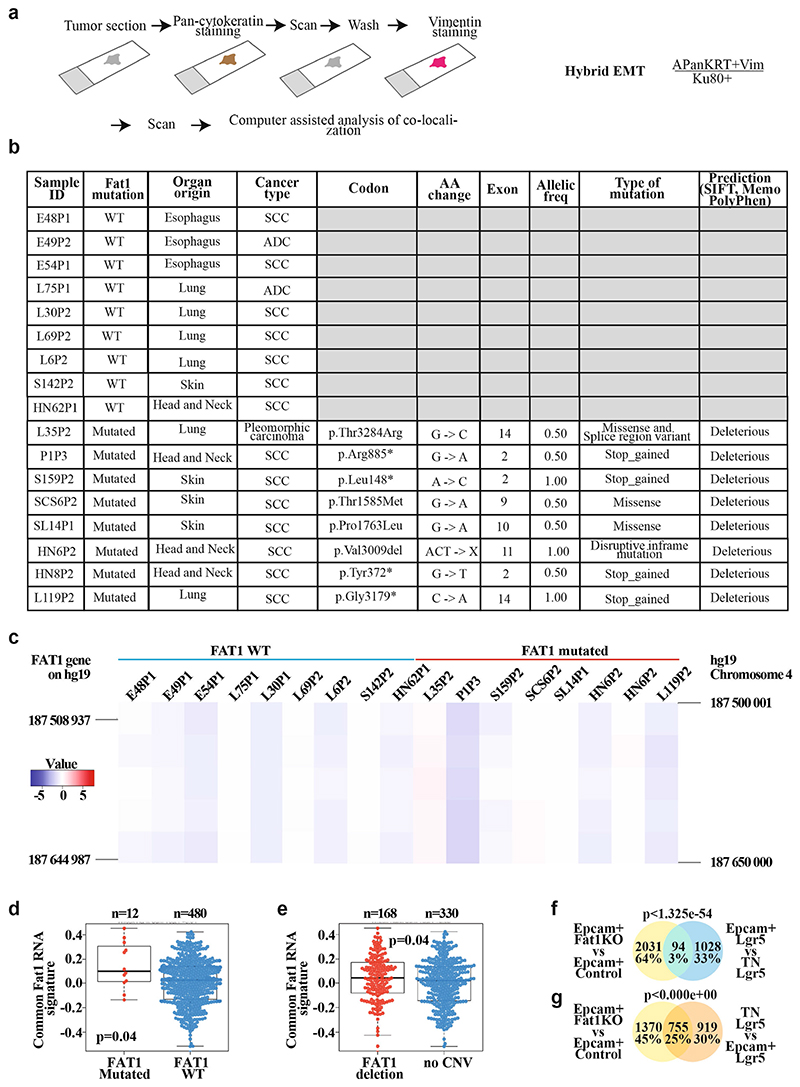
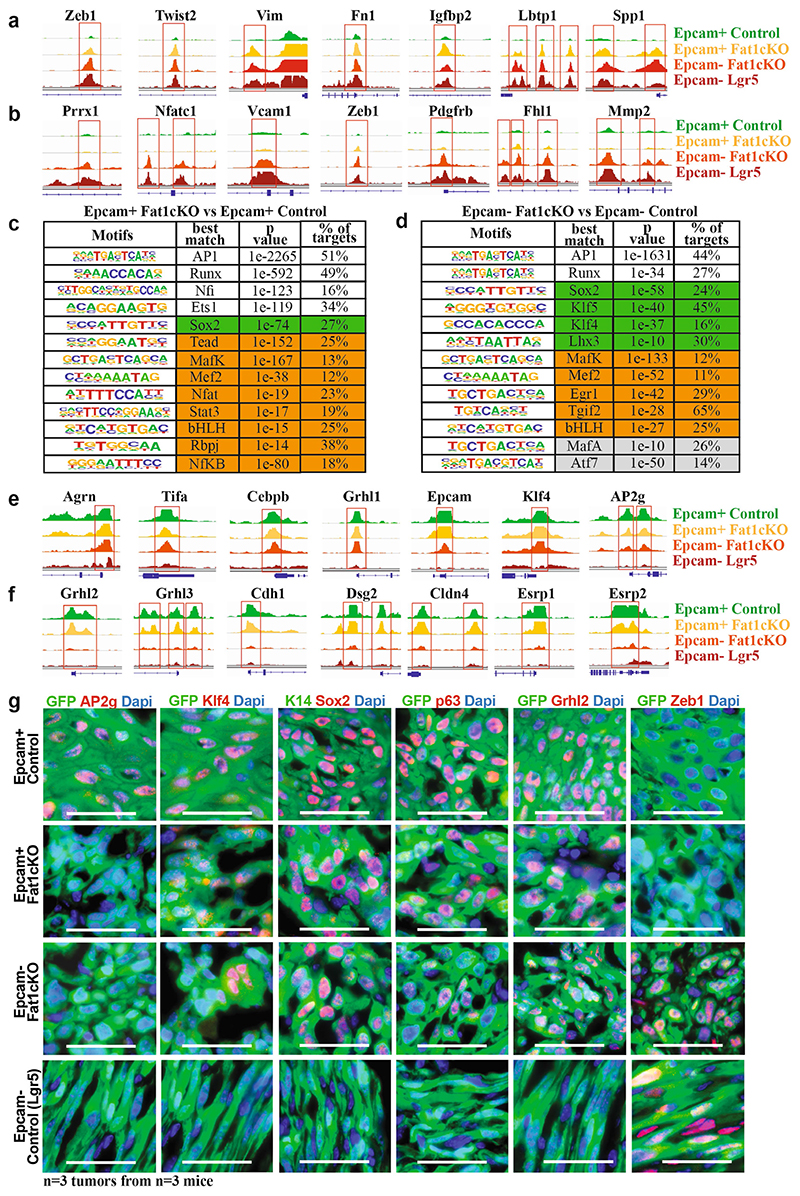
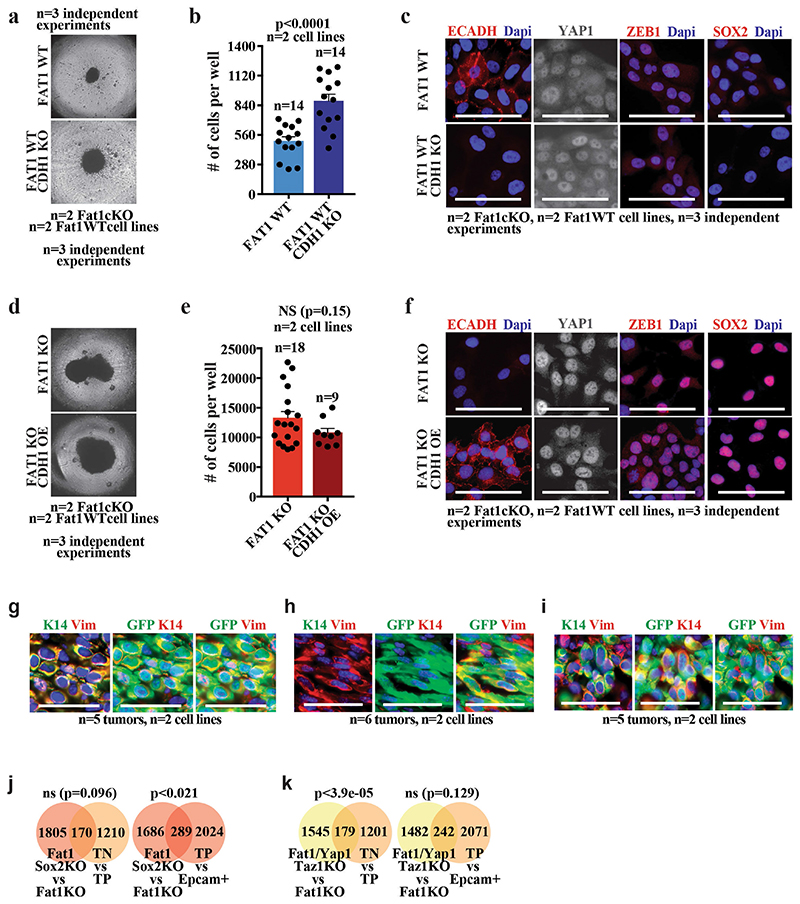
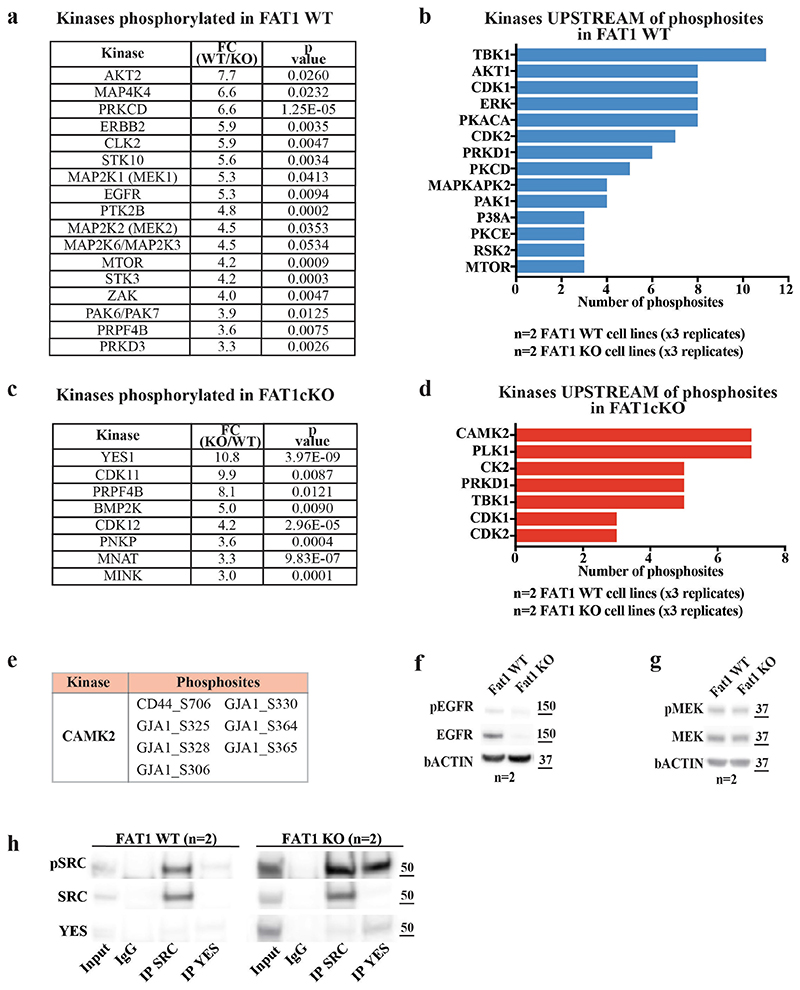
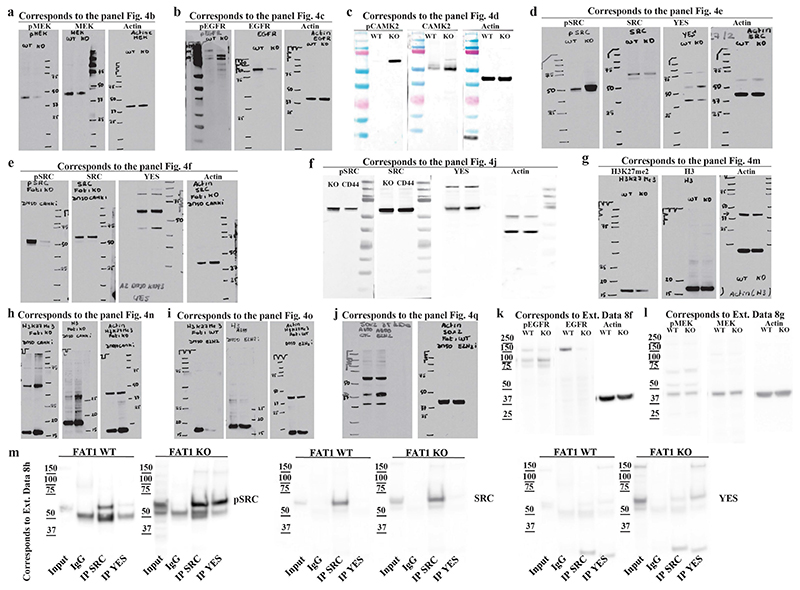
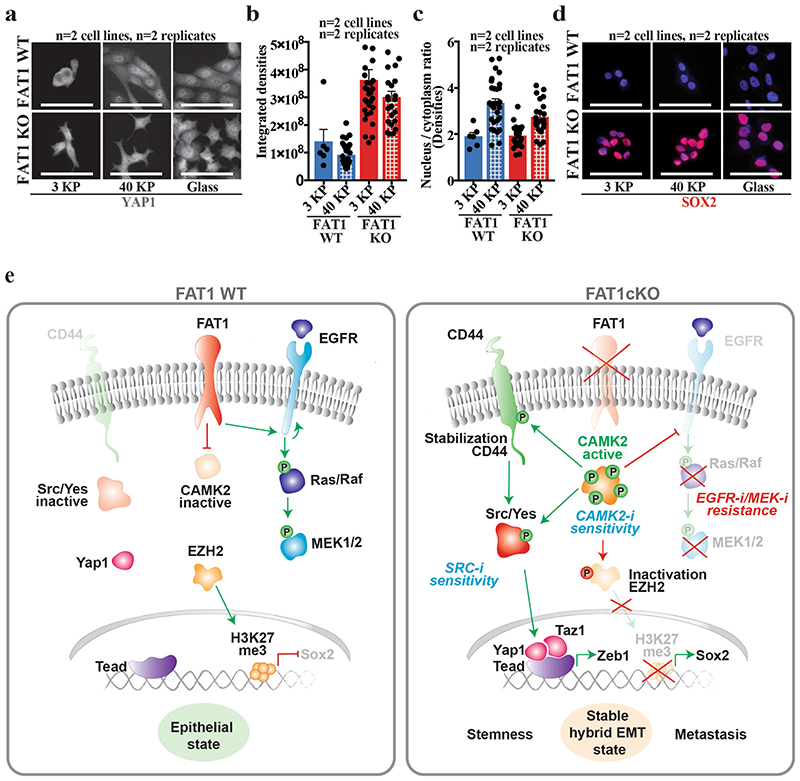
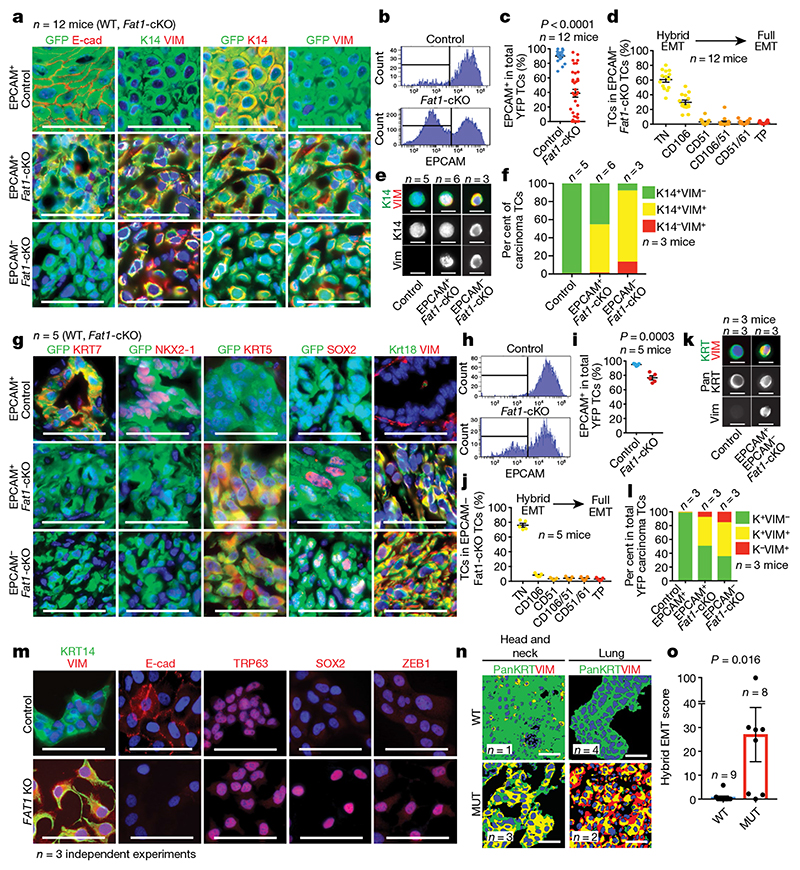
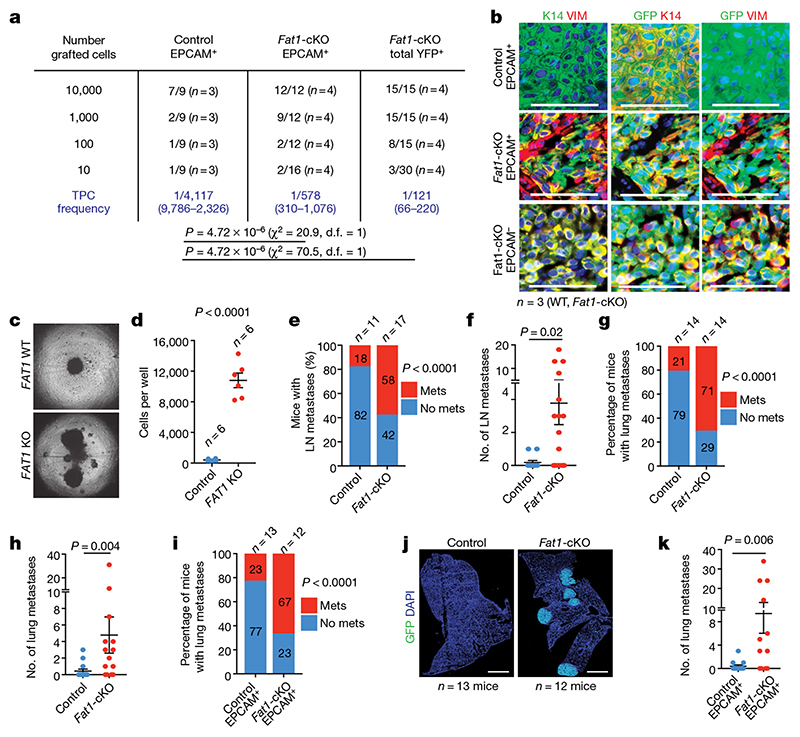
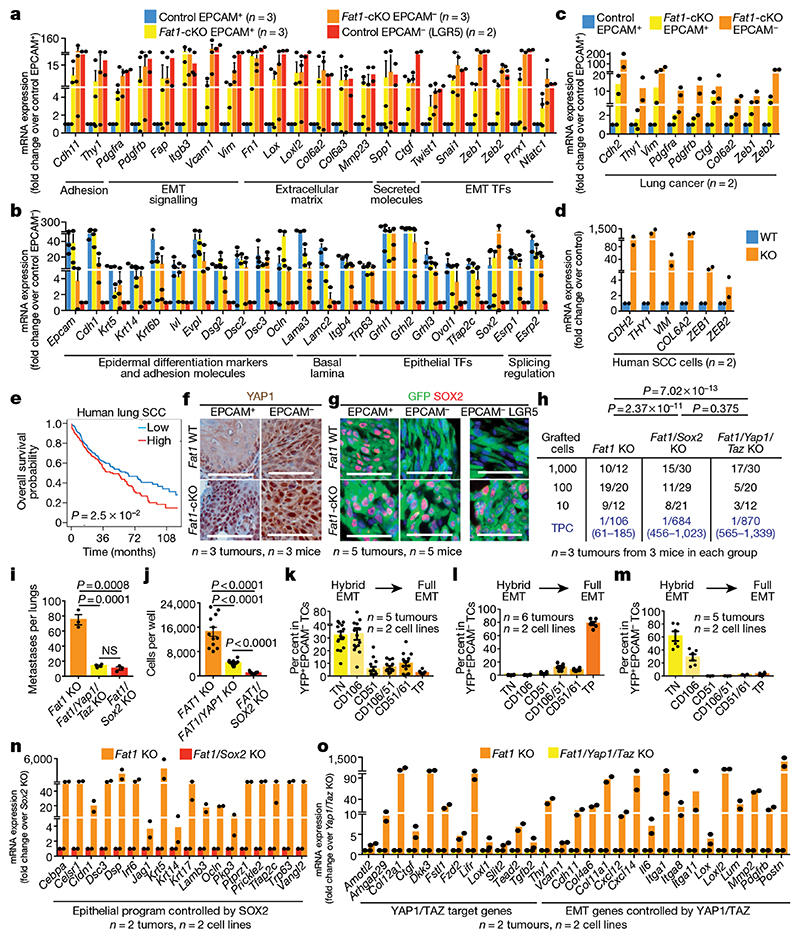
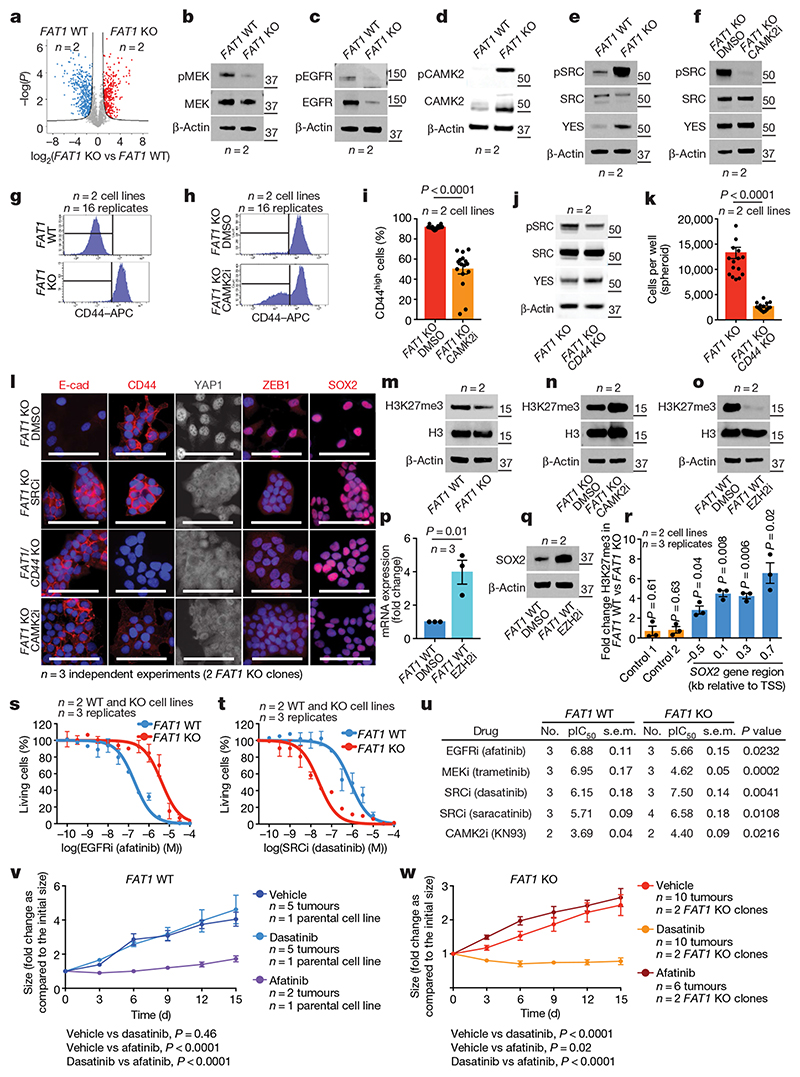
FAT1, which encodes a protocadherin, is one of the most frequently mutated genes in human cancers1-5. However, the role and the molecular mechanisms by which FAT1 mutations control tumour initiation and progression are poorly understood. Here, using mouse models of skin squamous cell carcinoma and lung tumours, we found that deletion of Fat1 accelerates tumour initiation and malignant progression and promotes a hybrid epithelial-to-mesenchymal transition (EMT) phenotype. We also found this hybrid EMT state in FAT1-mutated human squamous cell carcinomas. Skin squamous cell carcinomas in which Fat1 was deleted presented increased tumour stemness and spontaneous metastasis. We performed transcriptional and chromatin profiling combined with proteomic analyses and mechanistic studies, which revealed that loss of function of FAT1 activates a CAMK2-CD44-SRC axis that promotes YAP1 nuclear translocation and ZEB1 expression that stimulates the mesenchymal state. This loss of function also inactivates EZH2, promoting SOX2 expression, which sustains the epithelial state. Our comprehensive analysis identified drug resistance and vulnerabilities in FAT1-deficient tumours, which have important implications for cancer therapy. Our studies reveal that, in mouse and human squamous cell carcinoma, loss of function of FAT1 promotes tumour initiation, progression, invasiveness, stemness and metastasis through the induction of a hybrid EMT state.


Conflict of interest statement

Competing interests C. Blanpain, I.P. and F.M. are co-inventors on a patent application on the use of SRC inhibitors for the treatment of FAT1-mutated cancers.

Figures

Extended Data Fig. 1
Extended Data Fig. 1. Fat1 LOF does not alter development and skin homeostasis.
a, Image showing Fat1-cKO mouse and its control littermate. b, Table showing the number of control mice and mice with constitutive Fat1-cKO in skin epidermis, showing the absence of deviation from Mendelian ratio. c, Haematoxylin and eosin staining in control and Fat1-cKO epidermis. Scale bar, 50 μm. d, e, Immunostaining for GFP and KRT10, KRT14, E-cadherin or ITGB4 in control (d) and Fat1-cKO (e) epidermis. Scale bar, 50 μm.
Extended Data Fig. 2
Extended Data Fig. 2. Fat1 LOF accelerates DMBA/TPA-induced tumour initiation and malignant progression.
a, Model allowing constitutive Fat1 deletion in the skin epidermis and the scheme of DMBA/TPA protocol. b, Control and Fat1-cKO littermates 24 weeks after initiation of DMBA/TPA treatment. c, d, Time elapsed from the beginning of DMBA/TPA treatment until the appearance of the tumour (log-rank Mantel–Cox test) (c) and the number of papillomas per mouse (mean ± s.e.m., two-tailed t-test) (d) in control and Fat1-cKO mice. e, Macroscopic appearance of papilloma and carcinoma. f, Number of carcinomas per mouse at 24 weeks after DMBA/TPA in control and Fat1-knockout mice. Mean ± s.e.m., two-tailed t-test. g, Acute deletion of Fat1 in DMBA/TPA-induced papillomas. h, Time elapsed from tamoxifen (tam) administration to macroscopic malignant progression from papillomas into carcinomas. log-rank Mantel–Cox test. i, Proportion of papillomas that progressed to carcinomas in control and Fat1-cKO mice. χ 2 test. j, k, Immunostaining for KRT14, KRT10 and LAM5 in control (j) and Fat1-cKO papillomas (k) 0, 2, 4 and 8 weeks after tamoxifen administration. Scale bar, 50 μm. l, Haematoxylin and eosin and immunostaining for YFP, E-cadherin, ZO-1 or CLDN1 in control and Fat1-cKO papillomas. Scale bar, 50 μm. mo, Electron microscopy images showing polarity (Scale bars, 2 μm (control papilloma), 5 μm (Fat1-cKO papilloma)) (m), cell–cell adhesion (scale bar, 0.2 μm) (n) or desmosomes (scale bar, 0.2 μm) (o) in Fat1-cKO and wild-type papillomas. Red lines indicate interface between tumour cells and stroma. Blue arrowheads, desmosomes. Red arrowheads, tight and adherens junctions. p, Width of the desmosomes measured in nm in control and Fat1-cKO papillomas. Mean ± s.e.m., two-tailed t-test. q, Electron microscopy (scale bars, 0.2 μm (control), 5 μm (Fat1-cKO)) and immunostaining for KRT14 and LAM5 (scale bar, 50 μm) of control and Fat1-cKO papillomas. Blue arrowheads, hemidesmosomes. Red arrowheads, basal lamina in control papillomas and discontinued basal lamina in Fat1-cKO papillomas. Black arrowheads show fenestration of basal lamina in Fat1-cKO papillomas. r, Number of hemidesmosomes per 1 μm. Mean ± s.e.m., two-tailed t-test).
Extended Data Fig. 3
Extended Data Fig. 3. EMT in papillomas and gating strategy for FACS analysis and cell sorting of the tumour subpopulations.
a, Percentage of EPCAM+YFP+ tumour cells in control and Fat1-cKO papillomas. Mean ± s.e.m., two-tailed t-test. b, c, mRNA (qPCR) expression of epithelial (b) and mesenchymal (c) genes in EPCAM+ and EPCAM control and Fat1-cKO papillomas. Mean + s.e.m. d, FACS plots showing the gating strategy used to FACS-isolate or to analyse the proportion of YFP+EPCAM+ and EPCAM tumour cells from DMBA/TPA-induced K14-cre;Fat1cKO;Rosa26YFP/+ carcinomas and papillomas, Lgr5-creER;KRasG12D;p53cKO;Fat1cKO;Rosa26YFP/+ or K14-creER;KRasG12D;p53cKO;Fat1cKO;Rosa26YFP/+ skin SCCs and KrasG12D;p53cKO;Fat1cKO;Rosa26YFP/+ lung carcinomas. e, FACS plots showing the gating strategy to define the six subpopulations of EPCAM tumour cells: EPCAMCD106CD51CD61 (triple negative), EPCAMCD106+CD51CD61, EPCAMCD106CD51+CD61-, EPCAMCD106+CD51+CD61-, EPCAMCD106CD51+CD61+ and EPCAM-CD106+CD51+CD61+ (triple positive) populations.
Extended Data Fig. 4
Extended Data Fig. 4. Fat1 LOF promotes hybrid EMT state in a genetic model of skin SCC.
a, Mouse model of skin SCC allowing YFP and KrasG12D expression as well as p53 and Fat1 deletion preferentially in the interfollicular epidermis (IFE) using Krt14-creER. b, Percentage of EPCAM+ tumour cells in control and Fat1-cKO SCCs. Mean ± s.e.m., two-tailed t-test. c, Graph showing the distribution of the different EPCAM tumour cell subpopulations on the basis of the expression of CD106/VCAM1, CD61/ITGB3 and CD51/ITGAV in Fat1-cKO tumours. Mean ± s.e.m. d, Haematoxylin and eosin staining, showing representative control and Fat1-cKO tumours. Scale bar, 50 μm. e, f, Immunostaining for GFP, KRT14 or vimentin in representative control (e) and Fat1-cKO tumour (f). Scale bar, 50 μm. g, Mouse model of skin SCC allowing the expression of YFP and KrasG12D as well as p53 and Fat1 deletion preferentially in the hair follicle lineage using Lgr5-creER. h, Percentage of EPCAM+ tumour cells in the control and Fat1-cKO tumours. Mean ± s.e.m., two-tailed t-test. i, Graph showing the distribution of the different EPCAM tumour cell subpopulations on the basis of the expression of CD106/VCAM1, CD61/ITGB3 and CD51/ITGAV in Fat1-cKO tumours. Mean ± s.e.m. j, Haematoxylin and eosin staining, showing a representative Fat1 wild-type and Fat1-cKO tumour. Scale bar, 50 μm. k, l, Immunostaining for KRT14 and vimentin showing the absence of keratin pearls in representative EPCAM control SCC (k) and the presence of keratin pearls in representative EPCAM Fat1-cKO SCC (l). White arrowheads indicate keratin pearls. Scale bar, 100 μm. m, Dot plot showing the number of keratin pearls quantified per field at magnification 20×. n = 5 fields quantified per sample, mean ± s.e.m., two-tailed t-test. n, Mouse model allowing YFP and KrasG12D expression as well as p53 and Fat1 deletion in lung epithelial cells using intratracheal instillation of Ad5CMVCre virus. o, Immunofluorescence image showing the YFP+ lung tumours 10 weeks after intratracheal instillation of Ad5CMVCre virus in Fat1 wild-type and Fat1-cKO mice. Scale bar, 1 mm.
Extended Data Fig. 5
Extended Data Fig. 5. Mutations in FAT1 promotes hybrid EMT state in human cancers.
a, Schematic representing the method of analysing the co-expression of pan-cytokeratin and vimentin using immunohistochemistry of patient-derived xenografts that present (or not) mutations in FAT1, and the definition of hybrid EMT score. b, Table summarizing the samples of patient-derived xenografts on which whole-exome sequencing was performed, and detailed information on the mutations: codon, amino acid change, the exon containing the mutation, the allelic frequency, the type of mutations and the bioinformatic prediction of the effect of the mutation on the function of the protein using three bioinformatic algorithms (SIFT, Memo and PolyPhen). c, Heat map showing the copy number variation profile of FAT1 genomic region in the patient-derived xenograft samples included in the analysis of hybrid EMT score. The colour code corresponds to the quantified copy number and the genomic coordinate (reference genome hg19) of bin set for quantification. The FAT1 gene is marked on each vertical edge. d, e, Box plot showing the distribution of the common mRNA signature (mouse skin and lung Fat1-cKO SCCs and human FAT1-knockout SCC cell line) compared to FAT1 mutation status in human lung SCC (TCGA database; for the analysis, only high-impact mutations in >20% of variant allele frequency were considered) (d) and FAT1 copy number variation status in human lung SCC (TCGA database) (e). Boundaries of the box indicate the first and third quartiles of the FAT1 RNA signature value. The bold horizontal line indicates the median and the two external horizontal lines shows the minimum and maximum values. The dots represent all data points. Differences between the two groups are assessed using a two-sided Wilcoxon rank-sum test. f, g, Venn diagram of the genes upregulated in the EPCAM+ Fat1-cKO skin SCC and upregulated in LGR5 EPCAM+ versus triple-negative hybrid EMT tumour cells (f) or in triple-negative versus EPCAM+ cells (g). Two-sided hypergeometric test.
Extended Data Fig. 6
Extended Data Fig. 6. EPCAM+ Fat1-cKO tumour cells are epigenetically primed to undergo EMT, whereas EPCAM Fat1-cKO sustain the expression of epithelial program.
a, ATAC-seq profiles of the chromatin regulatory regions of mesenchymal genes closed in control EPCAM+ tumour cells and opened in EPCAM+ Fat1-cKO tumour cells, showing epigenetic priming of EPCAM+ Fat1-cKO tumour cells to undergo EMT. b, ATAC-seq profiles of the chromatin regulatory regions of mesenchymal genes with open chromatin regions only in EMT EPCAM tumour cells. c, Transcription factor motifs enriched in the ATAC-seq peaks upregulated between the EPCAM+ Fat1-cKO and EPCAM+ control tumour cells as determined by Homer. Cumulative hypergeometric distributions. White boxes show core transcription factors; boxes highlighted in green show epithelial transcription factors; and boxes highlighted in orange show EMT transcription factors. d, Transcription factor motifs enriched in the ATAC-seq peaks that are upregulated between the EPCAM Fat1-cKO and EPCAM control tumour cells as determined by Homer analysis. Cumulative hypergeometric distributions. White boxes show core transcription factors; boxes highlighted in green show epithelial transcription factors; boxes highlighted in orange show EMT transcription factors; and boxes highlighted in grey show other transcription factors. e, ATAC-seq of the chromatin regulatory regions of epithelial genes with open chromatin regions in EPCAM Fat1-cKO tumour cells as compared to EPCAM tumour cells from LGR5-derived SCCs, showing the sustained opening of epithelial enhancers in EPCAM Fat1-cKO tumour cells. f, ATAC-seq of the chromatin regulatory regions of epithelial genes that are closed upon EMT, irrespective of Fat1 deletion. g, Immunostaining for GFP and AP2G, KLF4, SOX2, p63, GRHL2 or ZEB1 in EPCAM+ and EPCAM control and Fat1-cKO DMBA/TPA skin SCCs. Scale bar, 50 μm.
Extended Data Fig. 7
Extended Data Fig. 7. Loss of cell adhesion is not sufficient to induce the hybrid EMT phenotype.
a, Images showing spheroids formed 7 d after plating 4,000 FAT1 wild-type or FAT1 wild-type, CDH1-knockout human A388 skin SCC cells on an ultra-low adherent plate. b, Bar chart showing the quantification by FACS of the number of cells in FAT1 wild-type, and FAT1 wild-type and CDH1-knockout, spheroids. Mean + s.e.m., two-tailed t-test. c, Immunostaining for E-cadherin, YAP1, ZEB1 and SOX2 in FAT1 wild-type, and FAT1 wild-type and CDH1-knockout, tumour cells. Scale bar, 50 μm. d, Images showing spheroids formed 7 d after plating 4,000 FAT1-knockout or FAT1-knockout and CDH1-overexpressing human A388 skin SCC cells on an ultra-low attachment plate. e, Bar chart showing the quantification by FACS of the number of cells in FAT1-knockout or FAT1-knockout and CDH1-overexpressing spheroids. Mean + s.e.m., two-tailed t-test. f, Immunostaining for E-cadherin, YAP1, ZEB1 and SOX2 in FAT1-knockout or FAT1-knockout and CDH1-overexpressing tumour cells. Scale bar, 50 μm. gi, Immunostaining of K14 and vimentin after subcutaneous transplantation of Fat1-cKO (g), Fat1 and Sox2 double-knockout (h) or Fat1, Yap1 and Taz triple-knockout (i) mouse skin SCC cells. Mean ± s.e.m. Scale bars, 50 μm. j, k, Venn diagram of the genes upregulated in EPCAM Fat1-cKO skin SCC upon Sox2 deletion (j) or upon Yap1 and Taz deletion (k), and upregulated genes in hybrid EMT triple-negative cells versus late EMT triple-positive cells (early hybrid EMT signature) and in triple-positive versus EPCAM+ cells (late EMT signature). Two-sided hypergeometric test.
Extended Data Fig. 8
Extended Data Fig. 8. Phosphoproteomic analysis reveals signalling cascades downstream of FAT1 LOF.
a, Table showing kinases that are significantly more phosphorylated in FAT1 wild-type cells as compared to FAT1-knockout cells. t-test, FDR = 0.05, S 0 = 1. b, Bar chart showing the kinases that are predicted to phosphorylate phosphosites significantly enriched in FAT1 wild-type tumour cells. c, Table showing kinases that are significantly more phosphorylated in FAT1-knockout cells as compared to FAT1 wild-type cells. t-test, FDR = 0.05, S 0 = 1. d, Bar chart showing the kinases that are predicted to phosphorylate phosphosites that are significantly enriched in FAT1-knockout tumour cells. e, Table showing the sites in FAT1-knockout cells predicted to be phosphorylated by CAMK2. f, g, Western blot showing pEGFR and EGFR (f) or pMEK and MEK (g) in Fat1 wild-type and Fat1-knockout Lgr5-creER;KrasG12D; p53cKO;Fat1fl/fl;RYFP mouse skin SCC cells. h, Western blot showing the expression levels of pSRC, total SRC and YES on the input of wild-type and FAT1-knockout cells, and upon immunoprecipitation of SRC and YES (n = 4). The apparent molecular weight reference in kDa is indicated close to fh.
Extended Data Fig. 9
Extended Data Fig. 9. Full scan of western blot membranes.
a–k, Images showing full scan of western blot membranes displayed in Fig. 4. Each panel indicates the figure and the panel to which the full membrane image belongs. Molecular weight size standards are indicated on each membrane. In all the experiments the controls (β-actin) were run on the same gel as the samples.
Extended Data Fig. 10
Extended Data Fig. 10. Increase in YAP1 and SOX2 signalling downstream of FAT1 LOF is independent of the stiffness of the substrate.
a, Immunostaining for YAP1 in FAT1 wild-type and FAT1-knockout human SCC cells upon increasing stiffness conditions. Scale bar, 50 μm. b, Quantification of YAP1 expression on the basis of fluorescence intensity in FAT1 wild-type and FAT1-knockout cells in different stiffness conditions. Mean + s.e.m. c, Quantification of YAP1 nuclear/cytoplasmic ratio on the basis of fluorescence intensity in FAT1 wild-type and FAT1-knockout cells in different stiffness conditions. Mean + s.e.m. d, Immunostaining for SOX2 in FAT1 wild-type and FAT1-knockout human SCC cells in increasing stiffness conditions. Scale bar, 50 μm e, Model of the signalling pathways that are activated or repressed in FAT1-knockout cells to induce a hybrid EMT state and to predict a differential effect on the response to therapy.
Fig. 1
Fig. 1. LOF of Fat1 promotes hybrid EMT state in mouse skin SCC, mouse lung cancer and human SCC.
a, Immunostaining for GFP, E-cadherin (E-cad), vimentin (VIM) and KRT14 (K14) in EPCAM+ control (wild-type (WT)), EPCAM+ Fat1-cKO and EPCAM Fat1-cKO DMBA/TPA-induced SCCs. Scale bars, 50 μm. b, c, FACS analysis (b) and percentage of EPCAM expression (c) in control and Fat1-cKO YFP+ skin SCCs. Mean ± s.e.m., two-tailed t-test. TC, tumour cell. d, Distribution of YFP+EPCAM tumour cells in CD106 (also known as VCAM1), CD61 (also known as ITGB3) and CD51 (also known as ITGAV) subpopulations in Fat1-cKO SCCs. Mean ± s.e.m. TN, EPCAM triple negative (CD106CD51CD61); TP, EPCAM triple positive (CD106+CD51+CD61+). e, f, Co-immunostaining (e) and quantification (f) of KRT14 and vimentin in cytospin of FACS-isolated skin SCC tumour cells. Scale bars, 20 μm. n = 90 cells per condition and tumour. g, Immunostaining for GFP, KRT7, NKX2-1, KRT5, SOX2, KRT8 and KRT18 (KRT8/18), and vimentin in Fat1 wild-type and -knockout lung carcinomas. Scale bars, 50 μm. h, i, FACS analysis (h) and percentage of EPCAM expression (i) in control and Fat1-cKO YFP+ lung tumour cells. Mean ± s.e.m., two-tailed t-test. j, Distribution of YFP+EPCAM tumour cells in CD106/VCAM1, CD61/ ITGB3 and CD51/ITGAV subpopulations in Fat1-cKO lung carcinomas. Mean ± s.e.m. k, l, Co-immunostaining (k) and quantification (l) of pancytokeratin (pan KRT) and vimentin in cytospin of FACS-isolated lung carcinoma tumour cells. Scale bars, 20 μm. n = 70 cells per condition and tumour. In l, K denotes pancytokeratin. m, Immunostaining for KRT14 and vimentin, E-cadherin, SOX2, TRP63 and ZEB1 in FAT1 wild-type and FAT1-knockout (KO) A388 human skin SCC cell line. Scale bars, 50 μm. n, o, Representative images (n) and quantification of hybrid EMT score (o) (colocalization of pancytokeratin and vimentin) in wild-type and FAT1-mutated (MUT) head and neck, and lung, patient-derived xenografts. Scale bars, 50 μm, Mean ± s.e.m., two-tailed Mann–Whitney U test.
Fig. 2
Fig. 2. Fat1 deletion promotes tumour stemness and metastasis in skin SCCs.
a, Tumour-propagating cell (TPC) frequency observed upon subcutaneous transplantation of limiting dilutions of YFP+EPCAM+ control, YFP+EPCAM+ and total YFP+ Fat1-cKO tumour cells using extreme limiting dilution analysis. χ 2 test. d.f., degrees of freedom. b, Immunostaining for GFP, KRT14 and vimentin in the secondary tumours arising after subcutaneous transplantation of tumour cells. Scale bars, 50 μm. c, Images showing spheroids formed 7 d after plating 4,000 FAT1 wild-type or FAT1-knockout human A388 skin SCC cells on an ultra-low adherent plate. d, Quantification of cell number in FAT1 wild-type and FAT1-knockout spheroids. Mean + s.e.m., two-tailed t-test. e, f, Proportion of mice presenting lymph node (LN) metastasis (χ 2 test) (e) and number of lymph node metastases per mouse (f) (mean ± s.e.m., two-tailed t-test). Mets, metastases. g, h, Proportion of mice presenting lung metastasis (χ 2 test) (g) and number of lung metastases per mouse (h) (mean ± s.e.m., two-tailed t-test). i, Proportion of mice presenting lung metastasis 40 d after intravenous injection of 20,000 YFP+EPCAM+ tumour cells. χ 2 test. j, Mosaic images of immunostaining for YFP of lungs after intravenous injection of control and Fat1-cKO tumour cells Scale bars, 1 mm. k, Number of metastases per lung arising from the injection of 20,000 YFP+EPCAM+ Fat1 wild-type and Fat1-cKO tumour cells. Mean ± s.e.m., two-tailed t-test.
Fig. 3
Fig. 3. YAP1 and SOX2 regulate mesenchymal and epithelial states downstream of Fat1 deletion.
a, b, mRNA expression (RNA-seq) of mesenchymal (a) and epithelial (b) genes in mouse skin SCC. Mean + s.e.m. TF, transcription factor. c, d, mRNA expression (RNA-seq) of mesenchymal genes in mouse lung carcinoma (c) and human SCC cells (d). Mean + s.e.m. e, Overall survival of patients with lung SCC, stratified by the expression of the common gene signature between mouse skin and lung and human skin FAT1-knockout SCC. log-rank Mantel–Cox test. f, g, Immunohistochemistry for YAP1 (f) and immunostaining for GFP and SOX2 (g) in wild-type and Fat1-cKO skin SCCs. Scale bars, 50 μm. h, i, Tumour-propagating cells (h) and lung metastasis (i) following the injection of YFP+EPCAM Fat1-knockout, Fat1- and Sox2 double-knockout or Fat1, Yap1 and Taz triple-knockout skin SCC cells. Mean ± s.e.m. two-tailed-t-test. NS, not significant. j, Number of cells in spheroids formed by FAT1-knockout, FAT1 and YAP1 double-knockout or FAT1 and SOX2 double-knockout human SCC cells after 7 d. Mean ± s.e.m., two-tailed t-test. k–m, YFP+EPCAM CD106/VCAM1, CD61/ITGB3 and CD51/ITGAV subpopulations in SCC after subcutaneous transplantation of Fat1-cKO (k), Fat1 and Sox2 double-knockout (l) or Fat1, Yap1 and Taz triple-knockout (m) mouse skin SCC cells. Mean ± s.e.m. Scale bars, 50 μm. n, o, mRNA (RNA-seq) expression of genes controlled by Sox2 (n) or by Yap1 and Taz (o) in EPCAM Fat1-cKO skin SCC. Mean + s.e.m.
Fig. 4
Fig. 4. Phosphoproteomic analysis identifies the signalling cascades downstream of FAT1 deletion.
a, Volcano plot showing the fold change and statistical significance of each phosphopeptide in wild-type versus FAT1-knockout cells (false-discovery rate (FDR) = 0.05, S 0 = 1). be, Western blot showing phosphorylated (p)MEK1 and MEK2 (MEK1/2) and total MEK (b), pEGFR and total EGFR (c), pCAMK2 and total CAMK2 (d), and pSRC, total SRC and YES (e) in FAT1-knockout and wild-type cells. f, Western blot showing pSRC, total SRC and YES in FAT1-knockout cells treated with dimethyl sulfoxide (DMSO) or with a CAMK2 inhibitor (CAMK2i). g, h, FACS analysis showing CD44 expression in wild-type and FAT1-knockout cells (g), and in FAT1-knockout cells treated with a CAMK2 inhibitor (h). i, FAT1-knockout cells expressing high levels of CD44 were treated with DMSO or a CAMK2 inhibitor. Mean + s.e.m. two-tailed-t-test. j, Western blot showing pSRC, total SRC and YES in FAT1-knockout and FAT1 and CD44 double-knockout cells. k, Number of cells in FAT1-knockout and FAT1 and CD44 double-knockout spheroids. Mean + s.e.m. two-tailed-t-test. l, Immunostaining for E-cadherin, CD44, YAP1, ZEB1 and SOX2 in FAT1 and CD44 double-knockout, and FAT1-knockout, cells treated with DMSO, an SRC inhibitor (SRCi) (saracatinib) or a CAMK2 inhibitor. Scale bars, 50 μm. mo, Western blot showing the expression of H3K27me3 and total H3 in FAT1 wild-type and -knockout cells (m), FAT1-knockout cells treated with a CAMK2 inhibitor (n) and in FAT1 wild-type cells treated with DMSO or an EZH2 inhibitor (EZH2i) (o). p, q, SOX2 mRNA (quantitative PCR with reverse transcription) (p) and protein (western blot) (q) in FAT1 wild-type cells 7 d after treatment with an EZH2 inhibitor. Mean ± s.e.m., two-tailed t-test. r, ChIP–qPCR of H3K27me3 mark in regions close to the SOX2 transcription start site. Ratio of relative enrichment in FAT1 wild-type versus -knockout cells; one sample t-test, mean ± s.e.m. s, t, Dose–response curve showing the effect of the EGFR inhibitor (ECFRi) afatinib (s) and the SRC inhibitor dasatinib (t) on FAT1 wild-type and FAT1-knockout cell viability at 48 h. Nonlinear regression log (inhibitor) with least-squares fit method. Mean ± s.e.m. u, Summary (n = 3) of pIC50 (negative log of half-maximal inhibitor concentration) and s.e.m. for different drugs for FAT1 wild-type and FAT1-knockout cells. Two-tailed t-test. v, w, Effect of dasatinib and afatinib on FAT1 wild-type (v) and FAT1-knockout (w) tumour growth upon subcutaneous transplantation. Mean ± s.e.m., two-way analysis of variance. The molecular weight (kDa) is indicated to the right of the blots in bf, j, mo, q.

References

    1. Morris LG, et al. Recurrent somatic mutation of FAT1 in multiple human cancers leads to aberrant Wnt activation. Nat Genet. 2013;45:253–261. - PMC - PubMed
    1. Dotto GP, Rustgi AK. Squamous cell cancers: a unified perspective on biology and genetics. Cancer Cell. 2016;29:622–637. - PMC - PubMed
    1. Sánchez-Danés A, Blanpain C. Deciphering the cells of origin of squamous cell carcinomas. Nat Rev Cancer. 2018;18:549–561. - PMC - PubMed
    1. The ICGC/TCGA Pan-Cancer Analysis of Whole Genomes Consortium. Pan-cancer analysis of whole genomes. Nature. 2020;578:82–93. - PMC - PubMed
    1. Lawrence MS, et al. Discovery and saturation analysis of cancer genes across 21 tumour types. Nature. 2014;505:495–501. - PMC - PubMed

Publication types

MeSH terms