. 2021 Jan;589(7842):456-461.
doi: 10.1038/s41586-020-03056-z. Epub 2020 Dec 16.

Sorting nexin 5 mediates virus-induced autophagy and immunity

Affiliations

Sorting nexin 5 mediates virus-induced autophagy and immunity

Xiaonan Dong et al. Nature. 2021 Jan.

Abstract

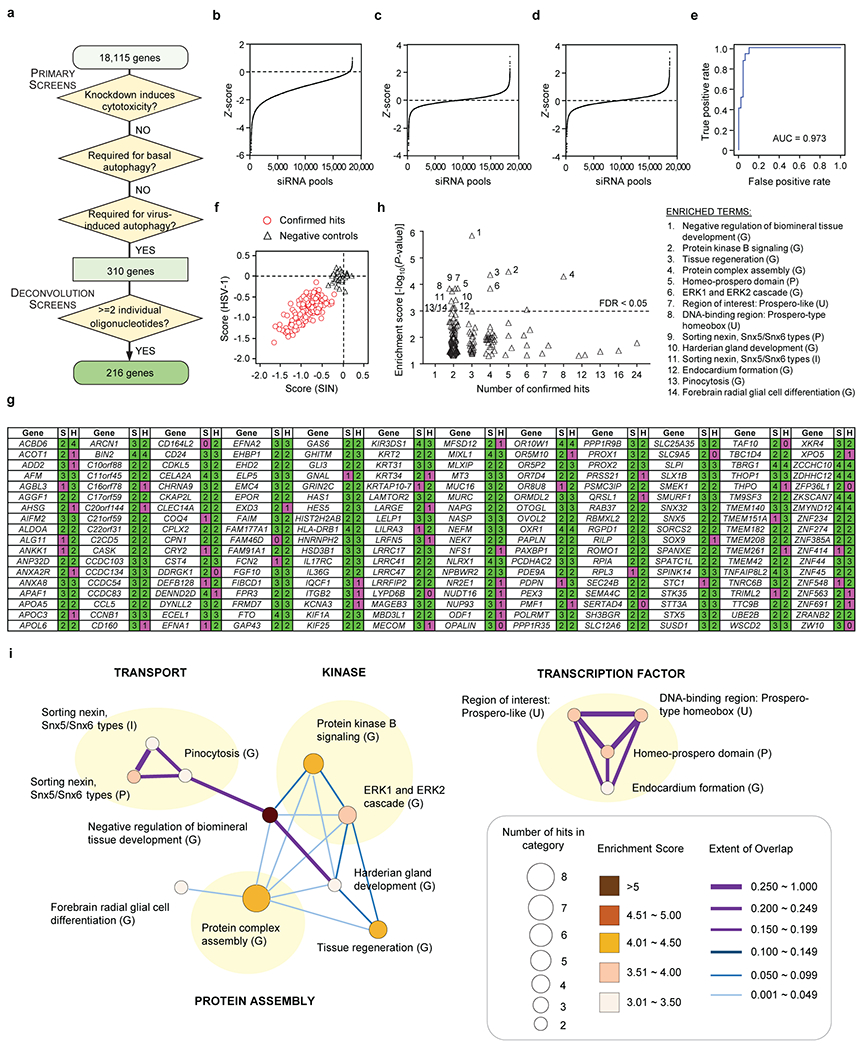
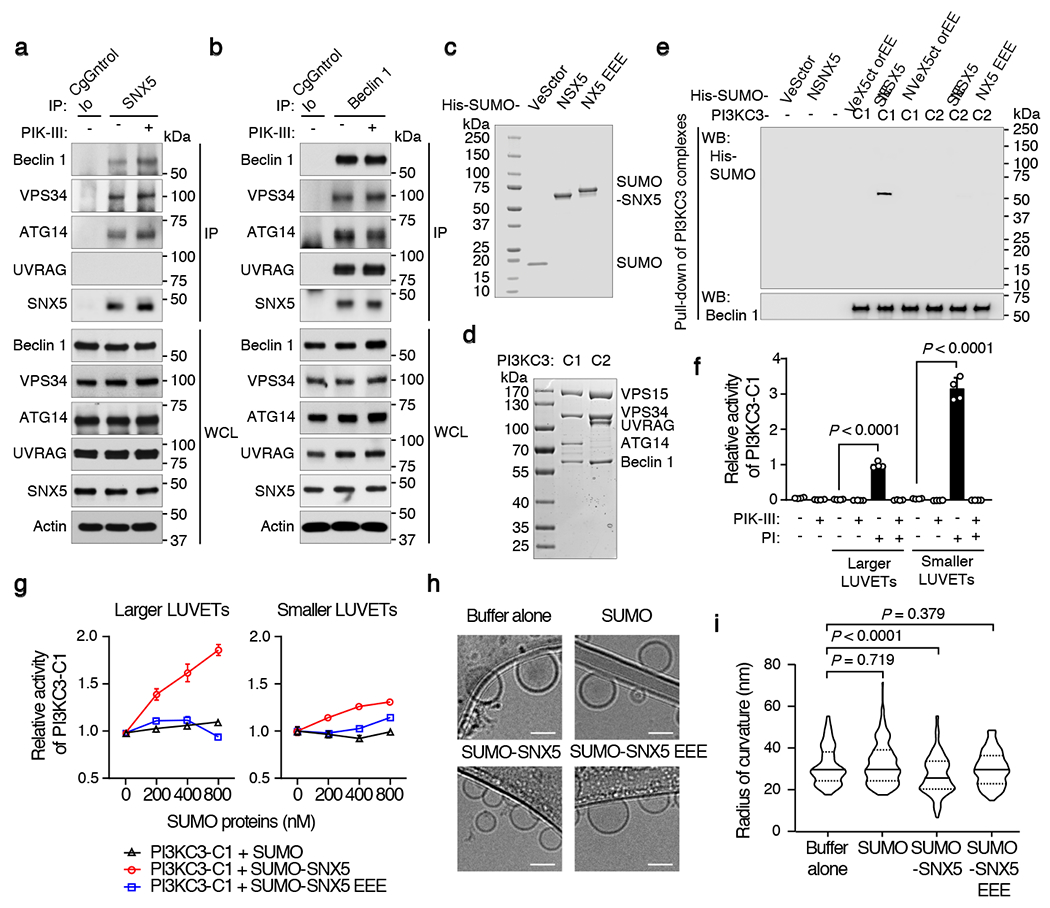
Autophagy, a process of degradation that occurs via the lysosomal pathway, has an essential role in multiple aspects of immunity, including immune system development, regulation of innate and adaptive immune and inflammatory responses, selective degradation of intracellular microorganisms, and host protection against infectious diseases1,2. Autophagy is known to be induced by stimuli such as nutrient deprivation and suppression of mTOR, but little is known about how autophagosomal biogenesis is initiated in mammalian cells in response to viral infection. Here, using genome-wide short interfering RNA screens, we find that the endosomal protein sorting nexin 5 (SNX5)3,4 is essential for virus-induced, but not for basal, stress- or endosome-induced, autophagy. We show that SNX5 deletion increases cellular susceptibility to viral infection in vitro, and that Snx5 knockout in mice enhances lethality after infection with several human viruses. Mechanistically, SNX5 interacts with beclin 1 and ATG14-containing class III phosphatidylinositol-3-kinase (PI3KC3) complex 1 (PI3KC3-C1), increases the lipid kinase activity of purified PI3KC3-C1, and is required for endosomal generation of phosphatidylinositol-3-phosphate (PtdIns(3)P) and recruitment of the PtdIns(3)P-binding protein WIPI2 to virion-containing endosomes. These findings identify a context- and organelle-specific mechanism-SNX5-dependent PI3KC3-C1 activation at endosomes-for initiation of autophagy during viral infection.


Conflict of interest statement

Competing interests: Beth Levine is a scientific co-founder of Casma Therapeutics, Inc. Ramnik J. Xavier is co-founder of Jnana Therapeutics and Celsius Therapeutics. None of these companies provided support for this work.

Figures

Extended Data Fig. 1.
Extended Data Fig. 1.. SIN and HSV-1ΔBBD increase autophagy in HeLa cells via an ATG7-, ATG13-, and PI3KC3-dependent mechanism.
a-c, Representative fluorescent micrographs (a) and quantitation (b, c) of GFP-LC3 puncta (autophagosomes) in HeLa/GFP-LC3 cells treated with non-targeting control siRNA (NC) or ATG7 siRNA for 72 h and then mock-infected or infected with SIN or HSV-1ΔBBD (at a multiplicity of infection [MOI] of 10 and 5, respectively; 4.5 h) in the presence or absence of the lysosomal inhibitor bafilomycin A1 (Baf A1, 100 nM) for 1 h prior to fixation. Scale bars, 20 μm. Arrows denote representative autophagosomes that would be scored as positive in b and c. The box plot with whiskers from minimum to maximum in b represents 100-150 cells analyzed for one of triplicate samples per condition. Bars in c represent mean ± s.d. of triplicate samples (100-150 cells analyzed per sample). Similar results were observed in three independent experiments. Both analyses were performed for similar fluorescence microscopy experiments in Figs. 1, 3, and Extended Data Figs. 1, 3, 4, 8, 9, 10, and only bar graphs are shown. d, Western blot analyses of indicated proteins in HeLa/GFP-LC3 cells treated with NC or ATG7 siRNA for 72 h as in a-c. e-g, Representative western blot detection (e) and quantitation (f, g) of indicated proteins in lysates (prepared with Triton X-100 lysis buffer) of HeLa cells mock-infected or infected with SIN or HSV-1ΔBBD (MOI = 10 and 5, respectively; 7 h) with the presence or absence of Baf A1 (100 nM) for 2 h (from 5 hours post infection [hpi] to 7 hpi). Bars in f and g represent mean ± s.d. of LC3-II/LC3-I ratios (f) and p62/actin ratios (g) of three independent experiments, respectively. h, i, Representative western blot detection (h) and quantitation (i) of p62 and actin in lysates (prepared with SDS lysis buffer) of HeLa cells mock-infected or infected with SIN or HSV-1ΔBBD (MOI = 10 and 5, respectively; 7 h). Bars in i represent mean ± s.d. of p62/actin ratios of three independent experiments. j, Quantitation of GFP-LC3 puncta in HeLa/GFP-LC3 cells treated with NC or ATG13 siRNA for 72 h and then mock-infected or infected with SIN or HSV-1ΔBBD (MOI = 10 and 5, respectively; 4.5 h). k, Western blot analyses of indicated proteins in HeLa/GFP-LC3 cells treated with NC or ATG13 siRNA for 72 h as in j. l, Quantitation of GFP-LC3 puncta in HeLa/GFP-LC3 cells mock-infected or infected with SIN or HSV-1ΔBBD (MOI = 10 and 5, respectively; 4.5 h) and treated with PIK-III (5 μM), Baf A1 (100 nM) or DMSO control for 1 h (from 3.5 hpi to 4.5 hpi). Bars in j and l represent mean ± s.d. of triplicate samples (100-150 cells analyzed per sample). Similar results were observed in three independent experiments. Unpaired two-tailed t-tests were used to compare means of Baf A1- versus DMSO-treated cells, those of ATG13 siRNA- versus NC-treated cells, and those of PIK-III- versus DMSO-treated cells. One-way ANOVA with Dunnett’s test for multiple comparisons was used to compare means of SIN or HSV-1ΔBBD infection versus mock infection. For gel source data, see Supplementary Fig. 1.
Extended Data Fig. 2.
Extended Data Fig. 2.. Schematic summary, statistical analyses and functional enrichment analyses of genome-wide siRNA screens.
a, Flowchart summary of primary and deconvolution siRNA screens in HeLa/GFP-LC3 cells. Three filters were applied in the primary siRNA screens: (1) absence of cytotoxicity of siRNA pools in transfected cells; (2) lack of effect of siRNA pools on numbers of GFP-LC3 puncta in mock-infected cells (basal autophagy); and (3) significant reduction of numbers of GFP-LC3 puncta in cells infected with either SIN or HSV-1ΔBBD (virus-induced autophagy). In the deconvolution siRNA screens, positive hits were defined as those genes with two or more individual siRNA oligonucleotides from siRNA pools that reproduced the phenotype of the siRNA pools. b-d, Ranked distribution of median scores for each siRNA pool in primary siRNA screens. Dots shown in graphs denote median scores of GFP-LC3 puncta in mock-infected cells (b), SIN-infected cells (c) and HSV-1ΔBBD-infected cells (d). e, A representative receiver operating characteristic (ROC) curve of quality control plates for primary and deconvolution screens. The ROC mean ± s.d. of all the quality control plates was 0.97 ± 0.03, which indicates accuracy and specificity in the identification of cellular factors that regulate numbers of GFP-LC3 puncta. f, Scatter plot of median scores of 216 confirmed hits from the deconvolution siRNA screens (open circles) and 40 negative on-plate controls (open triangles). Scores are medians from triplicate assay plates of four individual siRNA oligonucleotides per gene. The 216 confirmed hits and 40 negative on-plate controls fall into two distinct clusters. g, Gene list from deconvolution screens for virus-induced autophagy during infection with Sindbis virus (S) and HSV-1ΔBBD (H). Numbers denote number of individual siRNA oligonucleotides that scored positive in each screen. Green, genes with 2 or more positive siRNA oligonucleotides (confirmed hits); magenta, genes with <2 positive siRNA oligonucleotides (non-confirmed hits). h, Enrichment analyses of gene sets including molecular function, biological process, cellular component and protein domain categories (terms) from DAVID Bioinformatics Resources. There were 174 terms (open triangles) that contain at least two confirmed hits and have hypergeometric test P-values less than 0.05; fourteen of these terms exhibited false discovery rate (FDR) adjusted P-values less than 0.05. The enrichment score was defined as −log10 (hypergeometric test P-value). i, Fourteen highly enriched terms plotted as a network graph. Each node represents a gene set from a variety of categories (indicated in brackets) as follows: G, GOTERM; I, INTERPRO; P, PIR_SUPERFAMILY, U, UP_SEQ_FEATURE. The size of each node corresponds to the number of confirmed siRNA hits and the color intensity is scaled according to the enrichment score. The thickness and color intensity of lines connecting two nodes correspond to the extent of overlapping genes between two gene sets. See Fig. 1a and Supplementary Tables 1 to 5 for further details.
Extended Data Fig. 3.
Extended Data Fig. 3.. Impaired autophagy induction by acid-mediated bypass of endocytic viral entry, confirmation of indicated gene knockdown in HeLa cells, and requirement for SNX5 in autophagy induced by diverse viruses.
a, b, Representative fluorescent micrographs (a) and quantitation (b) of GFP-LC3 puncta in HeLa/GFP-LC3 cells that were either mock-infected or infected with SIN or HSV-1ΔBBD (MOI = 50 and 25, respectively; 4.5 h) in the presence (pH 5.4) or absence (pH 7.4) of an acidic pulse (that induces viral entry at the plasma membrane) after viral attachment. Arrows in a denote representative GFP-LC3 puncta that would be scored as positive in b. Scale bars, 20 μm. Bars in b represent mean ± s.d. of triplicate samples (100-150 cells analyzed per sample). c, d, Viral entry efficiency in HeLa/GFP-LC3 cells treated similarly as in a and b. Bars in c and d represent mean ± s.d. of SIN minus-strand RNA levels (c) and HSV-1 immediate early gene ICP27 mRNA levels (d) of triplicate samples at indicated time points, respectively. e, Representative fluorescent micrographs of GFP-LC3 puncta in HeLa/GFP-LC3 cells that were treated with indicated siRNAs (72 h) and then either mock-infected or infected with indicated virus for 4.5 h (MOI = 10 for SIN, Zika virus, WNV, CHIKV and IAV; MOI = 5 for HSV-1ΔBBD; and MOI = 20 for poliovirus and CVB3). Scale bars, 20 μm. Arrows in e denote representative GFP-LC3 puncta that would be scored as positive in Fig. 1b. f-i, Confirmation of gene knockdown in indicated siRNA-treated HeLa/GFP-LC3 cells (72 h) by western blot analyses of indicated proteins (f-h) or quantitative real-time PCR of SNX32 (i) for the experiment shown in Fig. 1b. Bars in i represent mean ± s.d. of triplicate samples. j, Western blot detection of SNX5 and actin in wild-type HeLa/GFP-LC3 cells (WT), HeLa SNX5KO/GFP-LC3 cells (KO), and two clones of reconstituted HeLa SNX5KO/GFP-LC3/SNX5 cells used in the experiment shown in k. In b, one-way ANOVA with Dunnett’s test for multiple comparisons was used to compare means of SIN or HSV-1ΔBBD infection versus mock infection. In b-d, unpaired two-tailed t-tests were used to compare means of pH7.4 versus pH5.4 conditions. For e-h, j, similar results were observed in three independent experiments. In i, an unpaired two-tailed t-test was used to compare means of NC versus SNX32 knockdown. k, GFP-LC3 puncta in reconstituted HeLa SNX5KO/GFP-LC3 cells mock-infected or infected with SIN or HSV-1ΔBBD (MOI = 10 and 5, respectively; 4.5 h). Bars represent mean ± s.d. of three independent replicates (100-150 cells per sample). P-values, one-way ANOVA with Dunnetťs test for multiple comparisons. For gel source data, see Supplementary Fig. 1.
Extended Data Fig. 4.
Extended Data Fig. 4.. SNX5 is dispensable for general autophagy or non-canonical forms of autophagy that require LC3 recruitment to endolysosomal or phagosomal compartments in HeLa cells.
a, b, Representative fluorescent micrographs (a) and quantitation (b) of GFP-LC3 puncta in HeLa/GFP-LC3 cells that were treated with indicated siRNA (72 h) and then cultured in normal medium (1 h), starvation medium (EBSS; 1 h), or normal medium containing torin 1 (250 nM; 1 h). Scale bars, 20 μm. Arrows denote representative autophagosomes that would be scored as positive in b. c, Quantitation of GFP-LC3 puncta in wild-type HeLa/GFP-LC3 cells (WT), HeLa SNX5KO/GFP-LC3 cells (KO), and two clones of reconstituted HeLa SNX5KO/GFP-LC3/SNX5 cells that were cultured in normal medium (1 h), starvation medium (EBSS; 1 h), or normal medium containing torin 1 (250 nM; 1 h). d, e, Representative fluorescent micrographs (d) and quantitation (e) of wild-type HeLa/GFP-LC3 cells and HeLa SNX5KO/GFP-LC3 cells bearing Group A Streptococcus-containing autophagosome-like vacuoles (GcAVs) at 2 h post bacterial infection (MOI = 100) with Group A Streptococcus strain JRS4 and the isogenic mutant JRS4ΔSLO (which does not induce formation of GcAVs due to defective bacterial escape from endosomes). Cellular and bacterial DNA was stained with DAPI. Boxed areas are magnified by four-fold to show micrographs of indicated channels and representative GcAVs (white puncta). Scale bars, 20 μm. f, g, Representative fluorescent micrographs (f) and quantitation (g) of wild-type HeLa/GFP-LC3 cells and HeLa SNX5KO/GFP-LC3 cells undergoing non-canonical autophagy after being cultured in either normal medium or hypotonic medium for 1 h. Boxed areas are magnified by two-fold to show micrographs of individual channels. Scale bars, 20 μm. h, i, Representative differential interference contrast (DIC) microscopy and fluorescence microscopy micrographs (h) and quantitation (i) of monensin-driven LC3-associated phagocytosis (LAP) of latex beads in wild-type HeLa/GFP-LC3 cells and HeLa SNX5KO/GFP-LC3 cells that were treated with monensin (100M) and polybead microspheres (3 μm in diameter) for 1 h. Boxed areas are magnified by nine-fold to show micrographs of DIC channel and GFP channel. Scale bars, 20 μm. In b, c, e, g and i, bars represent mean ± s.d. of triplicate samples (100-150 cells analyzed per sample). P-values were determined with one-way ANOVA with Dunnett’s test for multiple comparisons (b and c) or unpaired two-tailed t-test (e, g and i). For a, d, f, and h, similar results were observed in three independent experiments.
Extended Data Fig. 5.
Extended Data Fig. 5.. SNX5 is not required for retromer function and endolysosomal function in HeLa cells.
a, b, Representative fluorescent micrographs (a) and quantitation (b) of GLUT1 colocalized with the lysosomal marker LAMP1 in HeLa cells treated with indicated siRNA (72 h). Colocalized GLUT1 and LAMP1 puncta (yellow) represent lysosomal localization of mis-sorted GLUT1 which increases when retromer function is defective. Scale bars, 20 μm. Bars in b represent mean ± s.d. of Manders’ overlap coefficient of GLUT1 and LAMP1 of four replicates. c-f, Confirmation of gene knockdown in indicated siRNA-treated HeLa cells (72 h) for experiments shown in a and b by western blot analyses of indicated proteins (c-e) or quantitative real-time PCR of SNX32 (f). Bars in f represent mean ± s.d. of triplicate samples. Similar results were observed in three independent experiments. g, Western blot detection of SNX5 and actin in HeLa SNX5KO cells and parental wild-type (WT) HeLa cells. h, i, Quantitation of remaining protein levels of internalized plasma membrane-anchored transferrin receptor (TfnR) in WT and SNX5KO HeLa cells during fast (h) and slow (i) endocytic recycling processes. j, k, Representative western blot analysis (j) and densitometry analysis (k) of epidermal growth factor receptor (EGFR) and actin in WT and SNX5KO HeLa cells at indicated chase time after treating with EGF (100 ng/mL). Symbols in h, i and k represent mean ± s.d. of three independent experiments. P-values were determined with one-way ANOVA with Dunnett’s test for multiple comparisons (b), unpaired two-tailed t-test (f) or repeated measures ANOVA (h, i and k). For a, c-e, g, and j, similar results were observed in three independent experiments. For gel source data, see Supplementary Fig. 1.
Extended Data Fig. 6.
Extended Data Fig. 6.. SNX5 restricts viral infection in HeLa cells and primary mouse embryonic fibroblasts (MEFs) via an autophagy-dependent mechanism.
a-d, Viral infectivity assay in WT and SNX5KO HeLa cells infected with indicated virus. e-h, Viral multi-step growth curves (MOI = 0.01) of WT and SNX5KO HeLa cells infected with indicated virus. i-l, Viral multi-step growth curves (MOI = 0.01) of Snx5+/+ and Snx5−/− primary MEFs infected with indicated virus. m, n, Viral infectivity assay in WT and SNX5KO HeLa cells infected with autophagy-suppressive viral strains, SIN.dnAtg5 and HSV-1ΔBBD-MR. o-r, Viral multi-step growth curves (MOI = 0.01) of WT and SNX5KO HeLa cells (o, p) and Snx5+/+ and Snx5−/− primary MEFs (q, r) infected with SIN.dnAtg5 (o, q) and HSV-1ΔBBD-MR (p, r). In a-d, m and n, bars represent mean ± s.d. of the number of viral plaques formed in cell monolayers of three replicates. In e-l and o-r, symbols represent mean ± s.d. of viral titer of three replicates. s, t, Viral entry efficiency in WT and SNX5KO HeLa cells that were infected with SIN (MOI = 50) or HSV-1ΔBBD (MOI = 25). Bars in s and t represent mean ± s.d. of SIN minus-strand RNA levels (s) and HSV-1 immediate early gene ICP27 mRNA levels (t) of triplicate samples at indicated time point, respectively. u, v, Quantitative real-time PCR analyses of relative mRNA levels of interferon beta (IFN-β; u) and the interferon-stimulated gene (ISG) interferon induced protein with tetratricopeptide repeats 1 (IFIT1; v) in WT and SNX5KO HeLa cells that were mock-infected or infected with SIN or HSV-1ΔBBD (MOI = 10 and 5, respectively; 4.5 h). w, Quantitative real-time PCR analyses of relative mRNA levels of SNX5 in WT HeLa cells that were infected similarly as in u and v. In u-w, bars represent mean ± s.d. of three replicates. P-values were determined with unpaired two-tailed t-test (a-d, m, n, s and t), repeated measures ANOVA (e-l and o-r) or one-way ANOVA with Dunnett’s test for multiple comparisons (u-w). Similar results were observed in three independent experiments.
Extended Data Fig. 7.
Extended Data Fig. 7.. CNS viral titers, neuronal cell death and animal survival of virally-infected Snx5+/+ and Snx5−/− littermate mice.
a-c, CNS viral titers (a) and neuronal cell death (b, c) in seven-day-old Snx5+/+ (n = 8) and Snx5−/− (n = 8) littermate mice at indicated time point after infection via intracerebral (i.c.) inoculation with SIN strain dsTE12Q (1,000 pfu/mouse). d-f, CNS viral titers (d) and neuronal cell death (e, f) in eight- to ten-week-old Snx5+/+ (n = 8) and Snx5−/− (n = 8) littermate mice at indicated time point after infection via i.c. inoculation with HSV-1ΔBBD (50,000 pfu/mouse). In b and e, shown are representative micrographs of TUNEL staining of mouse brain sections from cerebral cortex (b) or basal ganglia (e) at indicated time point. Scale bars, 100 μm. Arrowheads denote representative TUNEL-positive foci that would be scored as positive in c and f. In a, c, d and f, each data point represents an individual mouse and black horizontal lines represent median values. g, Kaplan-Meier survival curve of eight- to ten-week-old Snx5+/+ and Snx5−/− littermate mice infected i.c. with the autophagy-suppressive strain HSV-1ΔBBD-MR (500 pfu/mouse). Results represent combined survival data for three independent infection experiments. Similar results were observed in each independent infection. P-values were determined with unpaired two-tailed t-test (a, c, d and f) or two-sided log-rank test (g).
Extended Data Fig. 8.
Extended Data Fig. 8.. Autophagy inhibition by PIK-III in baseline conditions, starvation and mTOR inhibition; western blot analysis of bacterially-purified SNX5 proteins; and bioinformatic analyses of SNX5 amino-acid sequences (related to Fig. 2).
a-c, Representative western blots (a) and densitometry analyses (b, c) of indicated proteins in WT HeLa cells cultured in normal media in the presence or absence of PIK-III (5 μM) for 1 h. Bars in b and c represent mean ± s.d. of total LC3/actin ratios (b) and p62/actin ratios (c) of three replicates. d, e, Representative fluorescent micrographs (d) and quantitation (e) of GFP-LC3 puncta in HeLa/GFP-LC3 cells that were cultured in normal medium (1 h), starvation medium (EBSS; 1 h), or normal medium containing torin 1 (250 nM; 1 h) in the presence or absence of PIK-III (5 μM; 1 h) and Baf A1 (100 nM; 1h). Scale bars, 20 μm. Arrows denote representative autophagosomes that would be scored as positive in e. Bars in e represent mean ± s.d. of three replicates (100-150 cells analyzed per sample). In b, c and e, unpaired two-tailed t-test was used to compare means of PIK-III- versus DMSO-treated cells. In e, one-way ANOVA with Dunnett’s test for multiple comparisons was used to compare means of starvation or torin 1 treatment versus normal condition. f, Western blot analysis of His-tagged SUMO, SUMO-SNX5 or SUMO-SNX5 EEE that were used in the experiments shown in Fig. 2c–i. For gel source data, see Supplementary Fig. 1. For a, d, and f, similar results were observed in three independent experiments. g, Amino acid sequence alignment of human SNX5 amino acids 298-361 (within the BAR domain) with the homologous regions of Snx5 proteins from eight other vertebrate animals using Cluster Omega (https://www.ebi.ac.uk/Tools/msa/clustalo/). Grey box highlights a highly conserved region across nine vertebrate SNX5 homologs. h, Amino acid sequence alignment of human retromer-related sorting nexins. Black arrowheads denote three positively charged residues (K429, K430 and R431) in human SNX1 for which triple mutations to glutamic acid residues (SNX1 EEE) lead to the inability of SNX1 to associate to membranes and induce membrane remodeling. In g and h, red dots indicate the residues of a positively charged stretch (K328, R330 and K332) in human SNX5 that corresponds to amino acids K429, K430, and R431 in SNX1. The three residues in SNX5 (K328, R330 and K332) were substituted with glutamic acid residues to generate the SNX5 EEE mutant used in this study. Hyphens (-) denote gaps in the indicated sequence identified by sequence alignment. Asterisks (*) indicate positions with a fully conserved residue; colons (:) indicate conserved positions between groups of strongly similar properties (scoring > 0.5 in the Gonnet PAM 250 matrix); periods (.) indicate conserved positions between groups of weakly similar properties (scoring equal to or < 0.5 in the Gonnet PAM 250 matrix). Magenta cylinders represent predicted discontinued alpha helixes using the University College London (UCL) PSIPRED Protein Sequence Analysis Workbench (http://bioinf.cs.ucl.ac.uk/psipred/). Solid line indicates a turn conformation in the tip region of the SNX1 and SNX5 BAR domains.
Extended Data Fig. 9.
Extended Data Fig. 9.. SNX5 is required for formation of PI3P probe puncta and WIPI2 puncta during viral infection, but not in baseline conditions, or upon autophagy induction by starvation or mTOR inhibition.
a-d, Representative fluorescent micrographs (a, c) and quantitation (b, d) of PI3P probe staining (a, b) or WIPI2 immunostaining (c, d) in indicated HeLa cells that were either mock-infected or infected with SIN or HSV-1ΔBBD (MOI = 10 and 5, respectively; 4 h). e-h, Representative fluorescent micrographs (e, g) and quantitation (f, h) of PI3P probe staining (e, f) or WIPI2 immunostaining (g, h) in indicated HeLa cells cultured in normal medium (1 h), starvation medium (EBSS; 1 h), or normal medium containing torin 1 (250 nM; 1 h). Scale bars, 20 μm. In a, c, e and g, arrows denote representative PI3P probe puncta or WIPI2 puncta that would be scored as positive in b, d, f and h. In c and g, representative cells are outlined by dashed white lines and boxed areas are magnified by sixteen-fold in the insets. In b, d, f and h, bars represent mean ± s.d. of three replicates (100-150 cells analyzed per sample). In b, d, f and h, P-values were determined by one-way ANOVA with Dunnett’s test for multiple comparisons. i, Western blot analyses of SNX5 and actin in parental wild-type HeLa cells (WT) and HeLa SNX5KO cells (KO) reconstituted with either empty vector (WT + vector and KO + vector), wild-type SNX5 (KO + SNX5) or SNX5 EEE mutant (KO + SNX5 EEE). For a, c, e, g, and i, similar results were observed in three independent experiments. For gel source data, see Supplementary Fig. 1.
Extended Data Fig. 10.
Extended Data Fig. 10.. SNX5 is not required for virus-induced endosomal localization of PI3KC3-C1 complexes, and PI3KC3 is required for virus-induced formation of PI3P probe puncta and WIPI2 puncta in HeLa cells.
a, Representative fluorescent micrographs of indicated immunostaining in parental wild-type and SNX5KO HeLa cells that were either mock-infected or infected with SIN and HSV-1ΔBBD (MOI = 10 and 5, respectively; 2 h). Scale bars, 20 μm. Boxed areas are magnified by four-fold in the insets. b-e, Representative fluorescent micrographs (b and d) and quantitation (c and e) of PI3P probe staining (b, c) or WIPI2 immunostaining (d, e) in HeLa cells that were either mock-infected or infected with SIN or HSV-1ΔBBD (MOI = 10 and 5, respectively; 4 h) and treated for 1 h with PIK-III (5 μM) or DMSO control prior to fixation (from 3 hpi to 4 hpi). Scale bars, 20 μm. Arrows in b and d denote representative PI3P probe puncta and WIPI2 puncta that would be scored as positive in c and e, respectively. In d, representative cells are outlined by dashed white lines and boxed areas are magnified by sixteen-fold in the insets. Bars in c and e represent mean ± s.d. of three replicates (100-150 cells analyzed per sample). In c and e, unpaired two-tailed t-test was used to compare means of PIK-III- versus DMSO-treated cells, and one-way ANOVA with Dunnett’s test for multiple comparisons was used to compare means of SIN or HSV-1ΔBBD infection versus mock infection. For a, b, and d, similar results were observed in three independent experiments.
Fig. 1.
Fig. 1.. SNX5 is required for virus-induced autophagy in vitro and antiviral host defense in vivo.
a, Confirmed hits from deconvolution siRNA screens grouped according to their requirement for SIN-induced autophagy, HSV-1ΔBBD-induced autophagy, or both. b, GFP-LC3 puncta in HeLa/GFP-LC3 cells treated with indicated siRNAs (72 h) and mock-infected or infected with indicated virus for 4.5 h. MOI = 5 for HSV-1ΔBBD; 10 for SIN, Zika virus, WNV, CHIKV and IAV; and 20 for poliovirus and CVB3. Bars represent mean ± s.d. of three independent replicates (100-150 cells per sample). P-values, one-way ANOVA with Dunnetťs test for multiple comparisons. c, Survival of Snx5+/+ and Snx5−/− mice infected with SIN (strain dsTE12Q, 1,000 pfu i.c., 7-day-old mice), SIN.dnAtg5 (1,000 pfu i.c., 7-day-old mice), HSV-1ΔBBD (50,000 pfu i.c., 8 to 10-week-old mice), HSV-1ΔBBD-MR (50,000 pfu i.c., 8 to 10-week-old mice), WNV (1 pfu i.c., 5.5-day-old mice) or CHIKV (100,000 pfu s.c., 7-day-old mice). Results represent combined data for at least three independent experiments per virus; similar results obtained for each infection. P-values, log-rank test (two-sided).
Fig. 2.
Fig. 2.. SNX5 interacts with PI3KC3-C1 complex and augments its lipid kinase activity.
a, b, Western blots showing co-immunoprecipitation of endogenous PI3KC3 complex proteins with SNX5 (a) or beclin 1 (b) in HeLa cells treated with DMSO or PIK-III (5 μM, 1 h). IP, immunoprecipitates; WCL, whole cell lysates. c, d, Coomassie blue staining of His-tagged SUMO, SUMO-SNX5 or SUMO-SNX5 EEE (c) or PI3KC3 complexes purified from HEK293F cells co-transfected with plasmids expressing beclin 1, VPS34, VPS15 and either ATG14 (PI3KC3-C1) or UVRAG (PI3KC3-C2) (d). e, Western blot of His-tagged proteins in eluates from in vitro binding with PI3KC3 complexes. Similar results for a-e were observed in three independent experiments. f, Relative PI3KC3-C1 activity in an in vitro lipid kinase assay using either PI or PI+ LUVETs +/− PIK-III (0.5 mM). Bars represent mean ± s.d., n=4 biologically independent samples. P-values, unpaired two-tailed t-tests. PI3KC3-C1 has higher activity on smaller PI+ LUVETs (P = 2.1e-8; two-way ANOVA). g, Relative PI3KC3-C1 activity (normalized to 0 nM SUMO) in an in vitro lipid kinase assay using PI+ LUVETs with indicated SUMO-fusion protein. Symbols represent mean ± s.d., n=4 biologically independent samples. The dose-dependent SUMO-SNX5-mediated increase in lipid kinase activity is greater on larger LUVETs (P = 0.000035; linear regression with three-way interaction term). h, i, Representative cryo-EM micrographs (h) and violin plots of the radius of curvature for vertex points (i) of larger PI+ LUVETs incubated for 30 min with buffer alone or indicated proteins (>150 liposomes per sample). Scale bar, 60 nm. P-values, one-way ANOVA with Dunnetťs test for multiple comparisons. See Supplementary Fig. 1 for gel source data.
Fig. 3.
Fig. 3.. SNX5 is required for virus-induced endosomal generation of PI3P.
a, b, Representative fluorescent micrographs (a) and quantitation (b) of WIPI2+ (green) and EEA1+ (red) puncta in indicated cells. Scale bars, 20 μm. Arrows denote representative WIPI2+EEA1+ puncta (white) that would score positive in b. Insets, 4X magnification of boxed areas. Error bars, mean ± s.d. (three replicates, 100-150 cells each). c-e, Representative fluorescent micrographs (c) and quantitation (d, e) of SNX5 endosomal localization in SIN.mCherry-E2-infected HeLa cells (MOI = 10, 1 h). Scale bars, 20 μm. Boxed areas are magnified 9X (right) to show SNX5 (green), E2 (red) and EEA1 (magenta) and SNX5+E2+EEA1+ colocalization (yellow). Arrows and arrowheads denote representative SNX5E2EEA1+ and SNX5+E2+EEA1+ endosomes, respectively. Bars in d represent mean ± s.d. of Manders’ overlap coefficient of SNX5 and E2+EEA1+ or E2EEA1+ colocalization (n=10, >40 cells per replicate). e, Violin plots of percentage of overlapping SNX5+ and E2+EEA1+ or E2EEA1+ puncta (n=137 cells). f, g, Representative fluorescent micrographs (f) and quantitation (g) of endosomal WIPI2 puncta in indicated cells. Scale bars, 20 μm. Boxed areas are magnified 4X (right) to show WIPI2 (green), E2 (red) and EEA1 (magenta) and WIPI2+E2+EEA1+ colocalization (yellow). Yellow puncta represent WIPI2+E2+EEA1+ puncta that would score positive in g. Bars in g represent mean ± s.d. (n=3, 100-150 cells per replicate). P-values, one-way ANOVA with Dunnetťs test for multiple comparisons (b, g) or unpaired two-tailed t-test (d, e). Similar results obtained from three independent experiments.

Comment in

  • Viral surveillance by SNX5.
    Strzyz P. Strzyz P. Nat Rev Mol Cell Biol. 2021 Feb;22(2):71. doi: 10.1038/s41580-020-00325-7. Nat Rev Mol Cell Biol. 2021. PMID: 33398165 No abstract available.

References

    1. Levine B, Mizushima N & Virgin HW Autophagy in immunity and inflammation. Nature 469, 323–335 (2011). - PMC - PubMed
    1. Dong X & Levine B Autophagy and viruses: adversaries or allies? J Innate Immun 5, 480–493 (2013). - PMC - PubMed
    1. Merino-Trigo A et al. Sorting nexin 5 is localized to a subdomain of the early endosomes and is recruited to the plasma membrane following EGF stimulation. J Cell Sci 117, 6413–6424 (2004). - PubMed
    1. Wassmer T et al. A loss-of-function screen reveals SNX5 and SNX6 as potential components of the mammalian retromer. J Cell Sci 120, 45–54 (2007). - PubMed
    1. Orvedahl A et al. HSV-1 ICP34.5 confers neurovirulence by targeting the Beclin 1 autophagy protein. Cell Host Microbe 1, 23–35 (2007). - PubMed

Additional References

    1. van Weering JR et al. Molecular basis for SNX-BAR-mediated assembly of distinct endosomal sorting tubules. EMBO J 31, 4466–4480 (2012). - PMC - PubMed
    1. Durkin ME, Qian X, Popescu NC & Lowy DR Isolation of mouse embryo fibroblasts. Bio Protoc 3, e908 (2013). - PMC - PubMed
    1. Dowdle WE et al. Selective VPS34 inhibitor blocks autophagy and uncovers a role for NCOA4 in ferritin degradation and iron homeostasis in vivo. Nat Cell Biol 16, 1069–1079 (2014). - PubMed
    1. Thoreen CC et al. An ATP-competitive mammalian target of rapamycin inhibitor reveals rapamycin-resistant functions of mTORC1. J Biol Chem 284, 8023–8032 (2009). - PMC - PubMed
    1. Gobeil PA & Leib DA Herpes simplex virus gamma34.5 interferes with autophagosome maturation and antigen presentation in dendritic cells. MBio 3, e00267–00212 (2012). - PMC - PubMed

Publication types

MeSH terms