. 2020 Nov 19:14:586043.
doi: 10.3389/fncir.2020.586043. eCollection 2020.

Single-Cell Visualization Deep in Brain Structures by Gene Transfer

Affiliations

Single-Cell Visualization Deep in Brain Structures by Gene Transfer

Sayaka Sugiyama et al. Front Neural Circuits. .

Abstract

A projection neuron targets multiple regions beyond the functional brain area. In order to map neuronal connectivity in a massive neural network, a means for visualizing the entire morphology of a single neuron is needed. Progress has facilitated single-neuron analysis in the cerebral cortex, but individual neurons in deep brain structures remain difficult to visualize. To this end, we developed an in vivo single-cell electroporation method for juvenile and adult brains that can be performed under a standard stereomicroscope. This technique involves rapid gene transfection and allows the visualization of dendritic and axonal morphologies of individual neurons located deep in brain structures. The transfection efficiency was enhanced by directly injecting the expression vector encoding green fluorescent protein instead of monitoring cell attachment to the electrode tip. We obtained similar transfection efficiencies in both young adult (≥P40) and juvenile mice (P21-30). By tracing the axons of thalamocortical neurons, we identified a specific subtype of neuron distinguished by its projection pattern. Additionally, transfected mOrange-tagged vesicle-associated membrane protein 2-a presynaptic protein-was strongly localized in terminal boutons of thalamocortical neurons. Thus, our in vivo single-cell gene transfer system offers rapid single-neuron analysis deep in brain. Our approach combines observation of neuronal morphology with functional analysis of genes of interest, which can be useful for monitoring changes in neuronal activity corresponding to specific behaviors in living animals.

Keywords: lateral pulvinar; overexpression; postnatal development; presynaptic protein; single-cell electroporation; thalamus; visual cortex.


Figures

FIGURE 1
FIGURE 1
Schematic illustration of electroporation and electrodes system. (A) Electroporation setup modified from the embryonic system. A sharp glass electrode containing the DNA solution was connected to the negative terminal of the electroporator and inserted into the target region. Tweezer-type electrode was connected into the positive terminal of the electroporator and placed outside the skull. (B) Electroporation setup modified from single-cell electroporation. A sharp glass capillary (negative electrode) was inserted into the target region and a ground electrode was placed over the contralateral hole in the skull. The glass capillary and ground electrode were connected to the headstage.
FIGURE 2
FIGURE 2
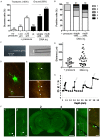
Gene delivery to deep brain neuron by single-cell electroporation. (A) Electroporation efficiency under different conditions. Percentage of GFP-expressing sites per penetration site (1 penetration site per target area) is shown; in the case of multiple-site injection, the percentage of GFP-expressing areas per target area (3 penetration tracts per target area) is shown. Total number of penetration sites (or total number of target areas for multiple-site injection) is given above each bar. + pressure, electroporation under weak pressure; DNA injection, electroporation after injecting DNA under strong pressure; R, electroporation by monitoring tip and cleft resistance. (B) The number of GFP-expressing cells per GFP-positive site is shown; in the case of multiple-site injection, the number of GFP-expressing cells per GFP-positive target region is shown. The box color (white to black) indicates the number of GFP-expressing cells. Total number of GFP-positive sites (or total number of GFP-positive regions for multiple-site injection) is given above each bar. (C) A sharp glass electrode with a 5-mm length of shank and 50-μm tip diameter prepared by cutting the glass tip. (D,E) GFP-expressing cells 2 days after electroporation. Most of transfected cells showed intense green fluorescence (D), but we found damaged cells (arrowheads in panel E) with weak GFP and poor processes near the penetration sites (asterisks). The penetration sites exhibited green and red autofluorescence. (F) Whole brain slice including two penetration tracts (arrows) and GFP-expressing cells (arrowheads) at both sides. Autofluorescence was detected along the penetration tracts (2 and 3, higher magnification view of areas indicated by arrows; 1, view of a serial section at a 100 μm distance from panel 2, 3’, higher magnification view of areas indicated in panel 3 with green and red fluorescence) (G) Distance of GFP-expressing cells from the penetration tracts. GFP-expressing cells were detected far from penetration sites after strong pressure DNA injection than after weak air pressure (“+ pressure”) (p = 0.0115, t-test with Welch’s correction; p < 0.05, χ2-test). (H) Relationship between tip and cleft resistance (R) and depth of the electrode from the pia mater. As resistance increased, square pulses were delivered at the points indicated by the lightning shape. Scale bars, 1 mm for panel (F); 100 μm for panels (D,E,F1–3’).
FIGURE 3
FIGURE 3
Dendrite morphology of single cells labeled by postnatal electroporation. (A–E) Cell body and dendrites of GFP-expressing cells in the LGN (A, neuron; B, glia), DG (C), VTA (D), and V1 (E). Dendritic spines were clearly visible in the granule cell (C, inset). The VTA of the midbrain was identified based on TH immunoreactivity (D, red). Scale bars, 20 μm. (F) Transfection efficiency in the midbrain and V1. The percentage of GFP-expressing sites per penetration site after single-site DNA injection and electroporation is shown. Total number of penetration sites is given above each bar.
FIGURE 4
FIGURE 4
Axonal projection of an LGN neuron. (A–C) Axonal projection of an LGN neuron to V1 and thalamic Rt (inset in C). The neuron had a dense axonal arbor in layer IV (B). Another dim ascending axon (arrowheads) was observed from the internal capsule (ic) to V1 (C’, brightness adjustment view of panel C), but in patches in layer IV of V1 (C”, higher magnification view of areas indicated in panel C’). Scale bars, 1 mm for panel (A); 200 μm for panels (B,C,C’); 100 μm for panel (C”).
FIGURE 5
FIGURE 5
Axonal projection of an LP neuron. (A–C) Main targets of an LP neuron, including V1 and V2 as well as extravisual areas such as the caudate putamen (CPu). The LP neuron located in the laterorostral region of the LP (LPLR) had dense axonal arbor in layers I and V of V1 and layer IV of V2 (B). Scale bars, 1 mm for panel (A); 200 μm for panels (B,C).
FIGURE 6
FIGURE 6
Localized distribution of presynaptic proteins in vivo. (A–C) Distribution of GFP (green) and VAMP2-mOrange (red) in a single neuron of the laterorostral region of the LP (LPLR). VAMP2 fusion protein was expressed at a low level in a few dendrites (A) but accumulated in the thalamocortical axon (B), particularly in terminal boutons in layer I of V2 (C, higher magnification view of areas indicated in panel B). (D,E) Localization of GFP and VAMP2-mOrange within a DG granule cell. As in the LPLR neuron, VAMP2 fusion protein was densely distributed in the axon (E) but sparse in the dendrites (D). GCL, granule cell layer; ML, molecular layer. Scale bars, 50 μm for panels (A,D,E); 25 μm for panels (B,C).

Similar articles

Cited by

References

    1. Ahmari S. E., Buchanan J., Smith S. J. (2000). Assembly of presynaptic active zones from cytoplasmic transport packets. Nat. Neurosci. 3 445–451. 10.1038/74814 - DOI - PubMed
    1. Andermann M. L., Kerlin A. M., Roumis D. K., Glickfeld L. L., Reid R. C. (2011). Functional specialization of mouse higher visual cortical areas. Neuron 72 1025–1039. 10.1016/j.neuron.2011.11.013 - DOI - PMC - PubMed
    1. Bennett C., Gale S. D., Garrett M. E., Newton M. L., Callaway E. M., Murphy G. J., et al. (2019). Higher-Order thalamic circuits channel parallel streams of visual information in mice. Neuron 102 477–492.e52 10.1016/j.neuron.2019.02.010 - DOI - PMC - PubMed
    1. Bock D. D., Lee W. C., Kerlin A. M., Andermann M. L., Hood G., Wetzel A. W., et al. (2011). Network anatomy and in vivo physiology of visual cortical neurons. Nature 471 177–182. 10.1038/nature09802 - DOI - PMC - PubMed
    1. Cai D., Cohen K. B., Luo T., Lichtman J. W., Sanes J. R. (2013). Improved tools for the brainbow toolbox. Nat. Methods 10 540–547. 10.1038/nmeth.2450 - DOI - PMC - PubMed

Publication types

Substances

LinkOut - more resources