. 2020 Nov 19:14:604718.
doi: 10.3389/fnsys.2020.604718. eCollection 2020.

Mixture Coding and Segmentation in the Anterior Piriform Cortex

Affiliations

Mixture Coding and Segmentation in the Anterior Piriform Cortex

Sapir Penker et al. Front Syst Neurosci. .

Abstract

Coding of odorous stimuli has been mostly studied using single isolated stimuli. However, a single sniff of air in a natural environment is likely to introduce airborne chemicals emitted by multiple objects into the nose. The olfactory system is therefore faced with the task of segmenting odor mixtures to identify objects in the presence of rich and often unpredictable backgrounds. The piriform cortex is thought to be the site of object recognition and scene segmentation, yet the nature of its responses to odorant mixtures is largely unknown. In this study, we asked two related questions. (1) How are mixtures represented in the piriform cortex? And (2) Can the identity of individual mixture components be read out from mixture representations in the piriform cortex? To answer these questions, we recorded single unit activity in the piriform cortex of naïve mice while sequentially presenting single odorants and their mixtures. We find that a normalization model explains mixture responses well, both at the single neuron, and at the population level. Additionally, we show that mixture components can be identified from piriform cortical activity by pooling responses of a small population of neurons-in many cases a single neuron is sufficient. These results indicate that piriform cortical representations are well suited to perform figure-background segmentation without the need for learning.

Keywords: figure-background; normalization; odor; olfaction; smell.


Figures

FIGURE 1
FIGURE 1
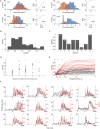
Mixture responses in piriform cortex. (A) Schematic of experimental setup. (B) Odor presentation calibration. The PID signal for mixtures plotted vs. the linear sum of PID signals for mixture components, indicating that mixture stimuli are a linear sum of the single component stimuli. Dot color indicates mixture size. (C) A sagittal section of a brain that was injected with a 10 kDa rhodamine at the same coordinates used for recordings. Arrow marks the injection site in the anterior piriform cortex. Scale bar – 1 mm. (D) Example raw data (respiration and electrophysiology), raster plot, and PSTH in response to a mixture of 2 odorants (od 3–5). Red line denotes the time of PSTH alignment (first inhalation onset). (E) An example stimulus set. All combinations of 4 odorants. Green-filled and empty squares denote odor on and off, respectively. PSTHs on the right are the responses of the same cell as in D to all stimuli. Red lines show the time of the first inhalation onset. (F) Histogram of baseline firing rates. (G) Fraction of spikes as a function of respiratory phase shown for 3 example cells. Red line shows a cosine fit. (H) Histogram of preferred baseline firing phase. (I) Histogram of change in firing rate in response to odor stimulation. (J) Histogram of response latencies. (K) Tuning width histograms. Above: Histogram of the number of significant single odorant responses in each cell. Below: Histogram of the number of significant responses to any of the 15 stimuli in each cell. Only cells that responded to at least one stimulus are shown. (L) Fraction of significant responses as a function of the number of odorants in the mixture. Error bars show the 95% confidence interval. (M) Observed responses (firing rate) vs. the linear sum of individual odorant responses. Responses of all cell-mixture pairs are shown. Dashed line is the unity line. (N) Histogram of the differences between observed and linearly predicted mixture responses.
FIGURE 2
FIGURE 2
A normalization model for mixture responses of individual piriform neurons. (A1–4) Examples from 4 cells showing the relationship between the linearly predicted and observed responses. The size of the symbol indicates the number of odorants in the mixture. Red line shows the fit to Eq. 1. Dashed line is the unity line. (B) Histogram of the coefficients of determination (R2) of the fits to Eq. 1 obtained from all cells. (C) The coefficients of determination plotted against the slope of a linear fit between the observed and linearly predicted responses. (D–F) Spike width (D), baseline firing rate (E), and preferred respiratory phase (F), plotted against the coefficient of determination obtained in the fit to Eq. 1.
FIGURE 3
FIGURE 3
Population coding of mixture responses. (A) Projections of single odorant (colored) and respective mixture responses (black) onto the first 2 principal components explaining 19 and 11 percent of the variance, respectively. Shown are examples for mixtures of 2, 3, and 4 odorants. (B) PCA projections of the same mixture responses as in (A) (black) and 3 corresponding predicted responses. Blue—max, Green—mean, Red—normalization. (C–F) PCA projections of all 11 mixture responses (black) and their corresponding predicted responses (colored). (C) Linear prediction. (D) Max prediction. (E) Mean prediction. (F) Normalization prediction. (G) Model errors, calculated as the Euclidean distance between the observed and predicted mixture responses as a function of time. Colors as in (B–F) shown are mean ± SEM. (H) Mean model error distance during odor presentation for all model-mixture pairs. Dots representing the same mixture are connected with lines. Colored dots show the mean. Asterisks reflect statistical significance (p < 0.01). (I) Normalization model error for the 11 mixtures (red), and all pairwise inter-stimulus distances (gray). *Denote p < 0.01 Wilcoxon signed rank test.
FIGURE 4
FIGURE 4
Detection of target odorants with single neurons. (A) The ROC analysis of 4 example cells. Firing rate histograms are shown on left (blue—all mixtures including a particular odorant, orange—all mixtures excluding the odorant). Panels on the right show hit rate (HitR) vs. false alarm rate (FAR) as the decision boundary is shifted (numbers indicate the area under the curve). (B) Histogram of the area under the ROC curve. The highest value for each neuron (across the 4 odorants) is included. (C) The maximal area under the curve obtained for each odorant. The number of neurons tested with each odorant is indicated. (D) The area under the ROC curve for each cell is plotted against the number of single odors that elicited a significant response. The area under the curve is shown for the best discriminated odor. (E) The area under the curve for each cell (with its best odor) as a function of the duration of response integration. Low performing cells (never reaching performance of 0.8) are shown in gray, high performing cells are shown in red. (F) The area under the curve using a sliding 200 ms integration window as a function of the time of integration along the response (red) superimposed with the PSTH in response to the detected odorant (black). Twelve high performing neurons are shown. *Denote p < 0.01 Wilcoxon signed rank test.
FIGURE 5
FIGURE 5
Detection of target odorants with pseudo-populations. In all panels black lines show the average performance for each odorant, and the color-shaded areas show the standard error of the mean. The different colors represent the four different odorants (blue—od1, red—od3, yellow—od5, purple—od7). (A) Performance of the linear classifiers as a function of the number of odorants in the mixture. (B) Performance of the classifiers as a function of the number of neurons used as input. (C) Performance of the classifiers as a function of the duration of the response integration window. (D) Performance of the classifiers as a function of temporal resolution.

References

    1. Abaffy T., Matsunami H., Luetje C. W. (2006). Functional analysis of a mammalian odorant receptor subfamily. J. Neurochem. 97 1506–1518. 10.1111/j.1471-4159.2006.03859.x - DOI - PMC - PubMed
    1. Ackels T., Jordan R., Schaefer A. T., Fukunaga I. (2020). Respiration-locking of olfactory receptor and projection neurons in the mouse olfactory bulb and its modulation by brain state. Front. Cell. Neurosci. 14:220 10.3389/fncel.2020.00220 - DOI - PMC - PubMed
    1. Araneda R. C., Kini A. D., Firestein S. (2000). The molecular receptive range of an odorant receptor. Nat. Neurosci. 3 1248–1255. 10.1038/81774 - DOI - PubMed
    1. Arevian A. C., Kapoor V., Urban N. N. (2008). Activity-dependent gating of lateral inhibition in the mouse olfactory bulb. Nat. Neurosci. 11 80–87. 10.1038/nn2030 - DOI - PMC - PubMed
    1. Aungst J. L., Heyward P. M., Puche A. C., Karnup S. V., Hayar A., Szabo G., et al. (2003). Centre–surround inhibition among olfactory bulb glomeruli. Nature 426 623–629. 10.1038/nature02185 - DOI - PubMed

LinkOut - more resources