. 2020 Nov 30:11:593492.
doi: 10.3389/fphar.2020.593492. eCollection 2020.

Pharmacological Programming of Endosomal Signaling Activated by Small Molecule Ligands of the Follicle Stimulating Hormone Receptor

Affiliations

Pharmacological Programming of Endosomal Signaling Activated by Small Molecule Ligands of the Follicle Stimulating Hormone Receptor

Silvia Sposini et al. Front Pharmacol. .

Abstract

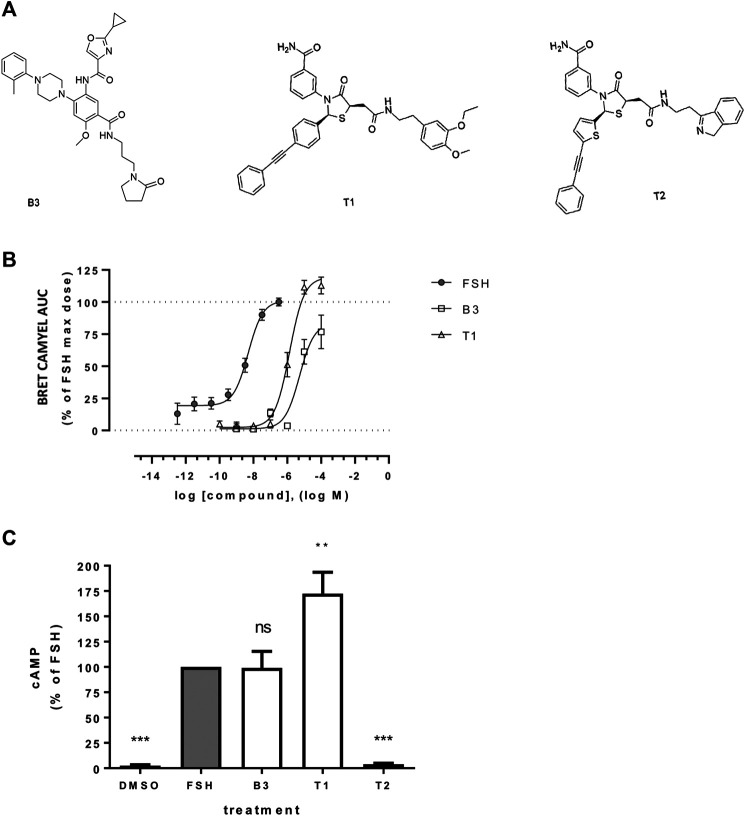
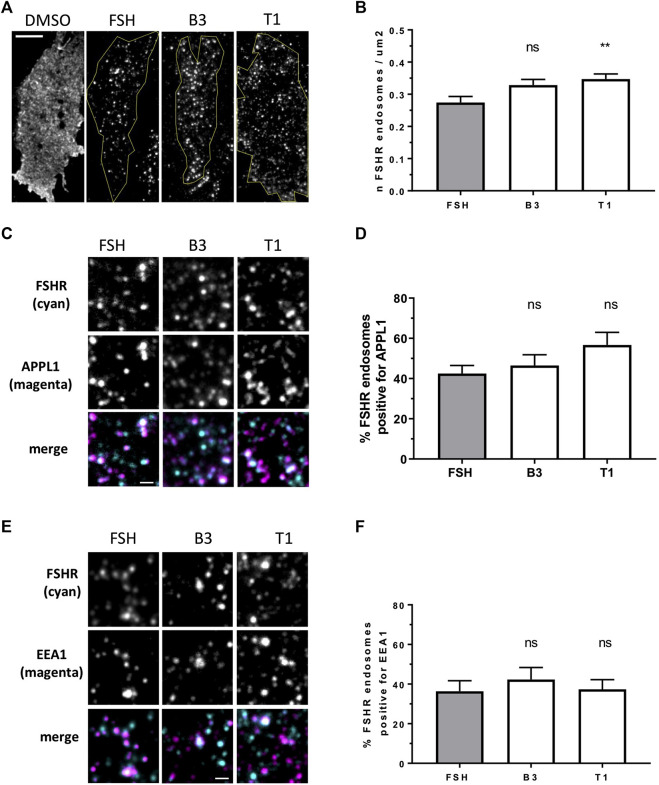
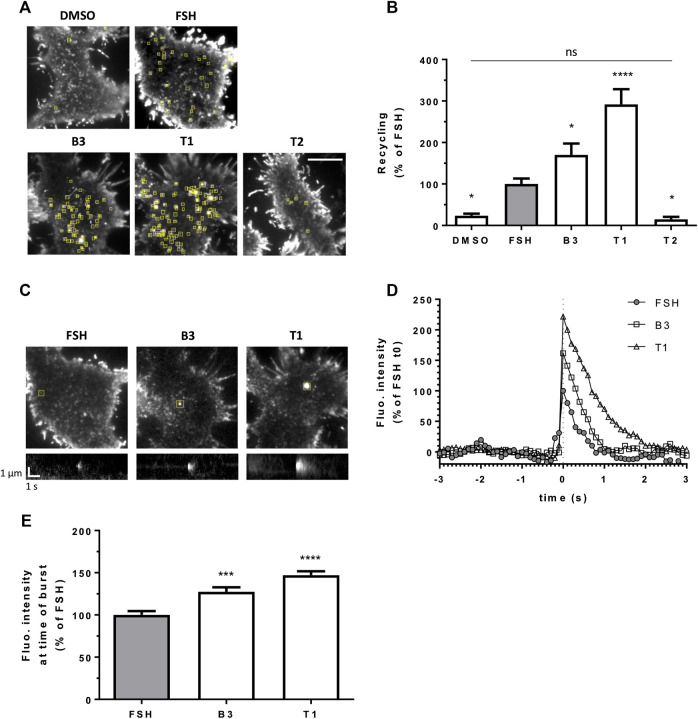
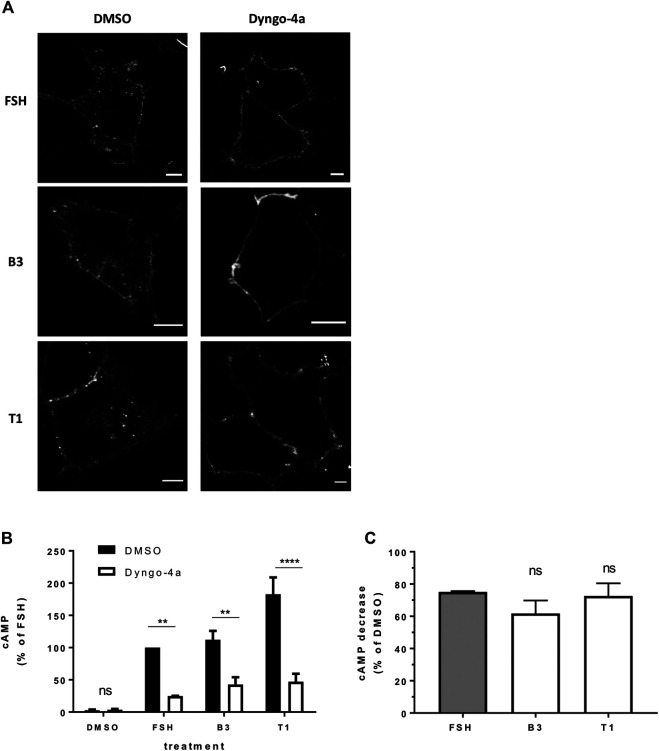
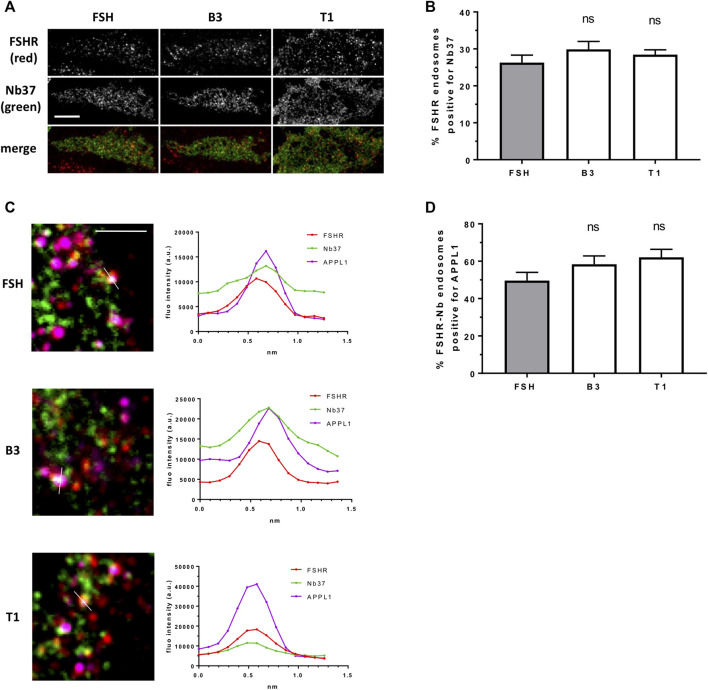
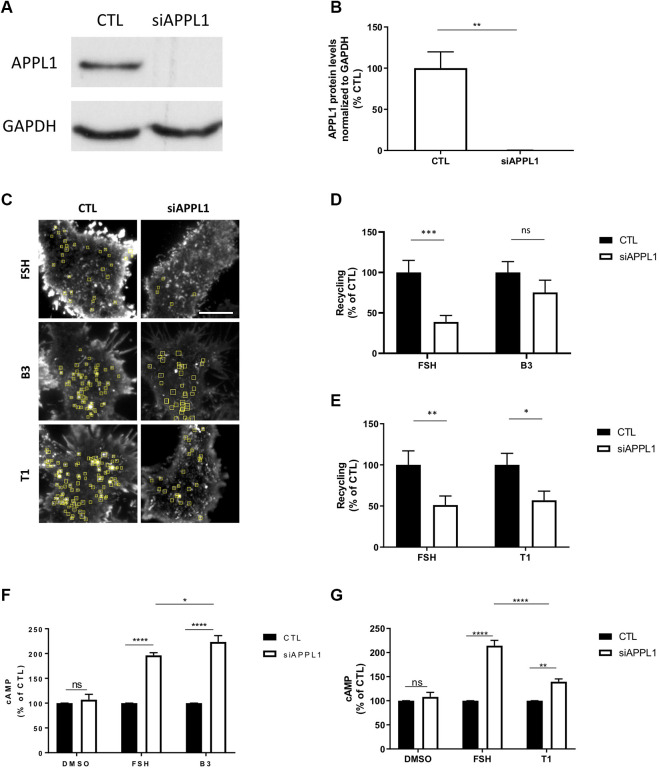
Follicle-stimulating hormone receptor (FSHR) is a G protein-coupled receptor (GPCR) with pivotal roles in reproduction. One key mechanism dictating the signal activity of GPCRs is membrane trafficking. After binding its hormone FSH, FSHR undergoes internalization to very early endosomes (VEEs) for its acute signaling and sorting to a rapid recycling pathway. The VEE is a heterogeneous compartment containing the Adaptor Protein Phosphotyrosine Interacting with Pleckstrin homology Domain and Leucine Zipper 1 (APPL1) with distinct functions in regulating endosomal Gαs/cAMP signaling and rapid recycling. Low molecular weight (LMW) allosteric FSHR ligands were developed for use in assisted reproductive technology yet could also provide novel pharmacological tools to study FSHR. Given the critical nature of receptor internalization and endosomal signaling for FSHR activity, we assessed whether these compounds exhibit differential abilities to alter receptor endosomal trafficking and signaling within the VEE. Two chemically distinct LMW agonists (benzamide, termed B3 and thiazolidinone, termed T1) were employed. T1 was able to induce a greater level of cAMP than FSH and B3. As cAMP signaling drives gonadotrophin hormone receptor recycling, rapid exocytic events were evaluated at single event resolution. Strikingly, T1 was able to induce a 3-fold increase in recycling events compared to FSH and two-fold more compared to B3. As T1-induced internalization was only marginally greater, the dramatic increase in recycling and cAMP signaling may be due to additional mechanisms. All compounds exhibited a similar requirement for receptor internalization to increase cAMP and proportion of FSHR endosomes with active Gαs, suggesting regulation of cAMP signaling induced by T1 may be altered. APPL1 plays a central role for GPCRs targeted to the VEE, and indeed, loss of APPL1 inhibited FSH-induced recycling and increased endosomal cAMP signaling. While T1-induced FSHR recycling was APPL1-dependent, its elevated cAMP signaling was only partially increased following APPL1 knockdown. Unexpectedly, B3 altered the dependence of FSHR to APPL1 in an opposing manner, whereby its endosomal signaling was negatively regulated by APPL1, while B3-induced FSHR recycling was APPL1-independent. Overall, FSHR allosteric compounds have the potential to re-program FSHR activity via altering engagement with VEE machinery and also suggests that these two distinct functions of APPL1 can potentially be selected pharmacologically.

Keywords: APPL1; G protein coupled receptor; allosteric ligand; endosome; follicle-stimulating hormone receptor.


Conflict of interest statement

HY, SP, and SN were employees of TocopheRx when reagents were shared. Author SN is employed by the company Mitobridge Inc. Author HY is employed by the company Canwell Pharma. The remaining authors declare that the research was conducted in the absence of any commercial or financial relationships that could be construed as a potential conflict of interest.

Figures

FIGURE 1
FIGURE 1
Effect of LMW allosteric compounds of FSHR to activate cAMP signaling (A) Chemical structures of compounds used in this study: the benzamide B3 and the thiazolidinone derivates T1 and T2. (B) Intracellular cAMP levels measured in cells transiently transfected with the cAMP BRET sensor CAMYEL and FSHR stimulated with increasing concentrations of FSH, B3 or T1. For each concentration considered, the area under the curve (AUC) was extrapolated from the signal recorded following 20 min stimulation and plotted as concentration/activity curves. Concentrations of FSH were −12.5 to −6.5 log M while B3 and T1 were −10 to −4 log M, at half-log dilutions. Data were normalized considering FSH maximal response as 100%. n = 6 independent experiments. (C) Intracellular levels of cAMP measured via HTRF in cells expressing FLAG-FSHR and stimulation with either DMSO, FSH (10 nM), B3, T1 or T2 (10 μM) for 5 min. n = 4 independent experiments; One-way ANOVA: **p < 0.01, ***p < 0.001.
FIGURE 2
FIGURE 2
LMW agonists do not alter the endosomal organization of FSHR (A) Representative TIR-FM images of FLAG-FSHR expressing HEK 293 cells treated with either DMSO, FSH (10 nM), B3 or T1 (10 μM) for 5 min. Scale bar = 10 μm. (B) Quantification of FSHR endosomes in stimulated cells from (A); n = 24 cells/condition collected across three independent experiments. One-way ANOVA: **p < 0.01. (C) TIR-FM images of FLAG-FSHR (cyan) and endogenous APPL1 (magenta) in cells stimulated with either FSH (10 nM), B3 or T1 (10 μM) for 5 min. Scale bar = 1 μm. (D) Quantification of FSHR endosomes positive for APPL1 from (C); n = 10–12 cells/condition collected across three independent experiments. (E) TIR-FM images of FSHR (cyan) and endogenous EEA1 (magenta) in cells stimulated with either FSH (10 nM), B3 or T1 (10 μM) for 5 min. Scale bar = 1 μm. (F) Quantification of FSHR endosomes positive for EEA1 from (E); n = 11–12 cells/condition collected across three independent experiments.
FIGURE 3
FIGURE 3
LMW agonists of FSHR induce a greater exocytic rate than FSH. (A) Maximum intensity projections from SEP-FSHR expressing HEK 293 cells imaged live by TIR-FM before and after 5-min stimulation with either DMSO, FSH (10 nM), B3, T1 or T2 (10 μM). Yellow squares indicate exocytic events detected in the corresponding TIR-FM movies (Supplementary Movies S1–S5). Scale bar = 10 μm. (B) Quantification of the number of FSHR exocytic events from (A); n = 7–11 cells/condition collected across at least three independent experiments. One-way ANOVA: *p < 0.05, ****p < 0.0001. (C) Images (top) and kymographs (bottom) of representative FSHR exocytic events (yellow squares) detected after 5-min stimulation with either FSH (10 nM), B3 or T1 (10 μM). (D) Fluorescence intensity of the representative FSHR exocytic events shown in (C). Data represent average fluorescence values within an ROI drawn around each event measured 3 s (30 frames) before and after event burst (t0) minus background fluorescence (= fluorescence measured in the ROI during the 30 frames before event burst (t0) was averaged and subtracted from fluorescence values at each frame); values were normalized considering FSH fluorescence at t0 = 100%. (E) Fluorescence intensity at time of burst of n = 212, 326, and 328 exocytic events from 11, 9 and 9 cells treated with FSH, B3 and T1, respectively, from (B); values represent maximum intensity fluorescence minus background fluorescence in each ROI at time of event burst; values were normalized considering FSH = 100%; Kruskal-Wallis test: ***p < 0.001, ****p < 0.0001.
FIGURE 4
FIGURE 4
FSHR requires receptor internalization to induce cAMP signaling in response to either FSH or LMW agonists. (A) Confocal images of FLAG-FSHR stably expressing HEK 293 cells pre-treated with either DMSO or Dyngo-4a (30 μM, 30 min) and stimulated with FSH (10 nM), B3 (10 μM) or T1 (10 μM). Scale bar = 5 μm. (B) Intracellular levels of cAMP measured in cells via HTRF expressing FLAG-FSHR pre-treated with either DMSO or Dyngo-4a (30 μM, 30 min) and stimulation either DMSO, FSH (10 nM, 5 min), B3 or T1 (10 μM, 5 min). Data are expressed as cAMP levels normalized to FSH treatment (DMSO). Two-way ANOVA: **p < 0.01, ****p < 0.0001. (C) Percentage decrease in cAMP levels following Dyngo-4a pre-treatment calculated from (B). n = 3 independent experiments.
FIGURE 5
FIGURE 5
LMW compounds induce Gαs activation from FSHR endosomes. (A) TIR-FM images of FLAG-FSHR (red) expressing cells transfected with Nb37-GFP (green) treated with either FSH (10 nM), B3 or T1 (10 μM) for 5 min. Scale bar = 10 μm. (B) Quantification of FSHR endosomes from (A); n = 24 cells/condition in three independent experiments. (C) TIR-FM images (top) of FLAG-FSHR (red), Nb37-GFP (green) and endogenous APPL1 (magenta) in cells stimulated with either FSH, B3 or T1 for 5 min. Scale bar = 3 μm. Line scan analysis of fluorescence intensity (bottom) is shown for one endosome per condition showing FSHR-Nb37-APPL1 colocalization (representative of 233, 302, 316 endosomes for FSH, B1, T3, respectively). (D) Quantification of FSHR-Nb37 endosomes positive for APPL1 after 5-min stimulation with either FSH, B3 or T1; n = 11–12 cells/condition from (C) from three independent experiments.
FIGURE 6
FIGURE 6
LMW compounds differentially affect APPL1-regulated FSHR recycling and cAMP signaling. (A) Western blot showing total cellular levels of APPL1 from cells treated with scramble (CTL) or APPL1 siRNA (siAPPL1). GAPDH was used as a loading control. (B) Quantification of APPL1 protein levels normalized to GAPDH protein levels from (A), and expressed as % of scramble, n = 3 independent experiments, t-test: **p < 0.01. (C) Maximum intensity projections from SEP-FSHR expressing cells imaged live by TIR-FM following transfection with either scramble (CTL) or APPL1 siRNA (siAPPL1) and stimulated with either FSH (10 nM), B3 or T1 (10 μM) for 5–20 min. Scale bar = 5 μm. (D–E) Quantification of the number of FSHR recycling events. n = 21–24 cells per condition collected across four independent experiments for (D) and n = 13–18 cells per condition collected across three independent experiments for (E). Two-way ANOVA: *p > 0.05, **p < 0.01, ***p < 0.001. (F,G) Intracellular levels of cAMP measured in cells stably expressing FLAG-FSHR following transfection with either scramble (CTL) or APPL1 siRNA (siAPPL1). Cells were stimulated with either DMSO, FSH (10 nM) or B3 (10 μM) (F) or DMSO, FSH (10 nM) or T1 (10 μM) (G) for 5 min. n = 5 (F) or 3 (G) independent experiments. Two-way ANOVA: *p < 0.05, **p < 0.001 ****p < 0.0001.

References

    1. Anderson R. C., Newton C. L., Millar R. P. (2018). Small molecule follicle-stimulating hormone receptor agonists and antagonists. Front. Endocrinol. 9, 757 10.3389/fendo.2018.00757. - DOI - PMC - PubMed
    1. Arey B. J., Yanofsky S. D., Claudia Pérez M., Holmes C. P., Wrobel J., Gopalsamy A., et al. (2008). Differing pharmacological activities of thiazolidinone analogs at the FSH receptor. Biochem. Biophys. Res. Commun. 368, 723–728. 10.1016/j.bbrc.2008.01.119. - DOI - PubMed
    1. Ayoub M. A., Landomiel F., Gallay N., Jegot G., Poupon A., Crepieux P., et al. (2015). Assessing gonadotropin receptor function by resonance energy transfer-based assays. Front. Endocrinol. 6, 130 10.3389/fendo.2015.00130. - DOI - PMC - PubMed
    1. Bowman S. L., Puthenveedu M. A. (2015). Postendocytic sorting of adrenergic and opioid receptors. Prog Mol Biol Transl Sci 132, 189–206. 10.1016/bs.pmbts.2015.03.005. - DOI - PMC - PubMed
    1. Caengprasath N., Gonzalez-Abuin N., Shchepinova M., Ma Y., Inoue A., Tate E. W., et al. (2020). Internalization-dependent free fatty acid receptor 2 signaling is essential for propionate-induced anorectic gut hormone release. iScience. 23, 101449 10.1016/j.isci.2020.101449 - DOI - PMC - PubMed