. 2020 Nov 27:11:565957.
doi: 10.3389/fneur.2020.565957. eCollection 2020.

Extensive Healthy Donor Age/Gender Adjustments and Propensity Score Matching Reveal Physiology of Multiple Sclerosis Through Immunophenotyping

Affiliations

Extensive Healthy Donor Age/Gender Adjustments and Propensity Score Matching Reveal Physiology of Multiple Sclerosis Through Immunophenotyping

Paavali A Hannikainen et al. Front Neurol. .

Abstract

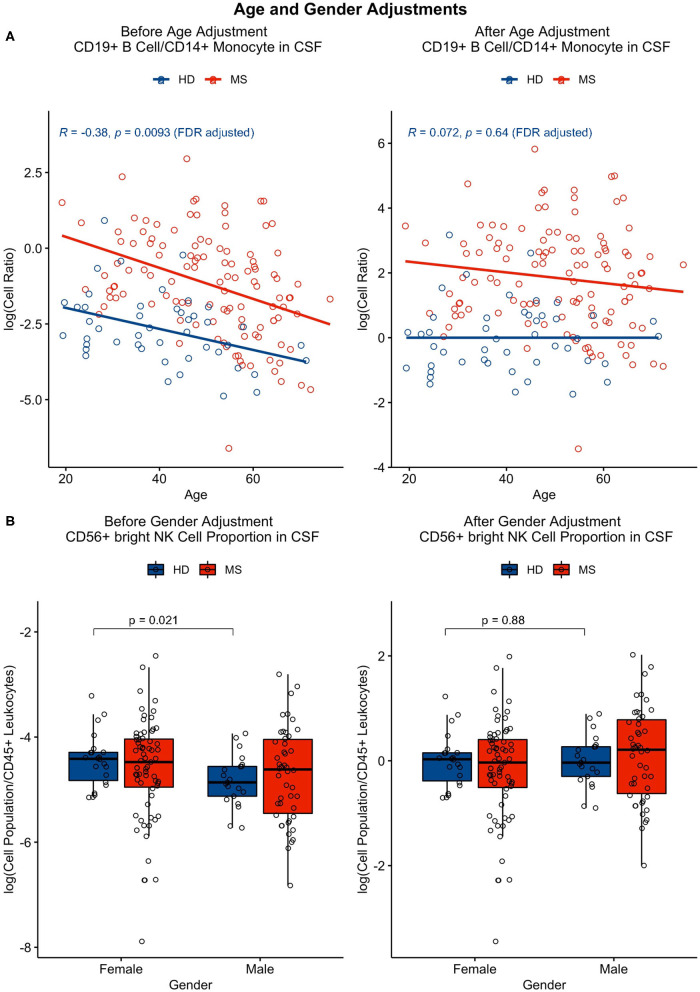
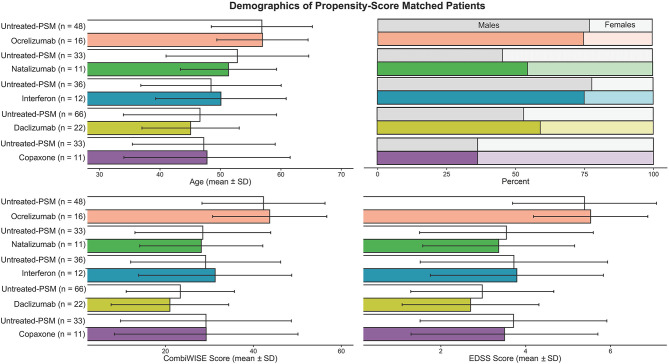
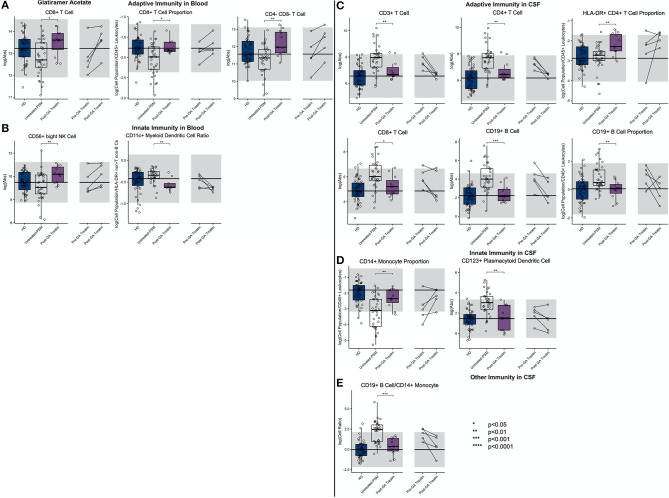
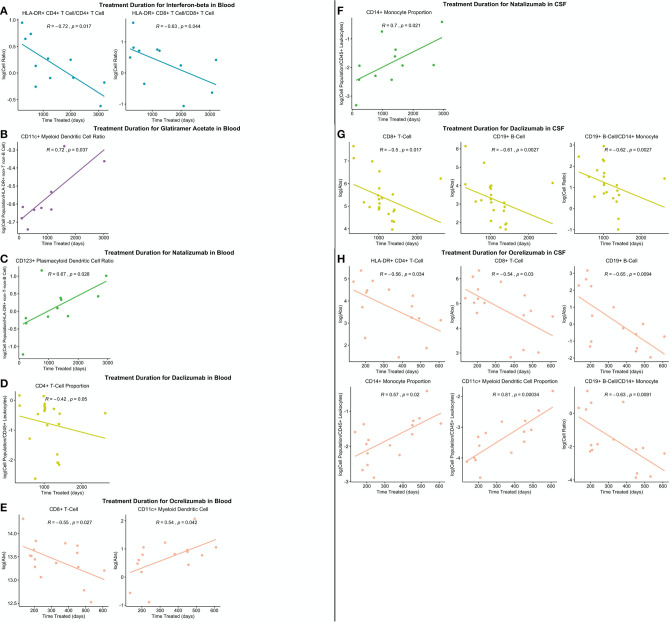
Quantifying cell subpopulations in biological fluids aids in diagnosis and understanding of the mechanisms of injury. Although much has been learned from cerebrospinal fluid (CSF) flow cytometry in neuroimmunological disorders, such as multiple sclerosis (MS), previous studies did not contain enough healthy donors (HD) to derive age- and gender-related normative data and sufficient heterogeneity of other inflammatory neurological disease (OIND) controls to identify MS specific changes. The goals of this blinded training and validation study of MS patients and embedded controls, representing 1,240 prospectively acquired paired CSF/blood samples from 588 subjects was (1) to define physiological age-/gender-related changes in CSF cells, (2) to define/validate cellular abnormalities in blood and CSF of untreated MS through disease duration (DD) and determine which are MS-specific, and (3) to compare effect(s) of low-efficacy (i.e., interferon-beta [IFN-beta] and glatiramer acetate [GA]) and high-efficacy drugs (i.e., natalizumab, daclizumab, and ocrelizumab) on MS-related cellular abnormalities using propensity score matching. Physiological gender differences are less pronounced in the CSF compared to blood, and age-related changes suggest decreased immunosurveillance of CNS by activated HLA-DR+T cells associated with natural aging. Results from patient samples support the concept of MS being immunologically single disease evolving in time. Initially, peripherally activated innate and adaptive immune cells migrate into CSF to form MS lesions. With progression, T cells (CD8+ > CD4+), NK cells, and myeloid dendritic cells are depleted from blood as they continue to accumulate, together with B cells, in the CSF and migrate to CNS tissue, forming compartmentalized inflammation. All MS drugs inhibit non-physiological accumulation of immune cells in the CSF. Although low-efficacy drugs tend to normalize it, high-efficacy drugs overshoot some aspects of CSF physiology, suggesting impairment of CNS immunosurveillance. Comparable inhibition of MS-related CSF abnormalities advocates changes within CNS parenchyma responsible for differences in drug efficacy on MS disability progression. Video summarizing all results may become useful educational tool.

Keywords: age; cerebrospinal fluid; flow cytometry; gender; immunophenotyping; multiple sclerosis; propensity score matching.


Conflict of interest statement

BB is co-inventor on several NIH patents related to daclizumab therapy for MS, and as such, has received patent royalty payments from NIH. The remaining authors declare that the research was conducted in the absence of any commercial or financial relationships that could be construed as a potential conflict of interest.

Figures

Figure 1
Figure 1
Immune cells were first classified by CD45 expression with histogram gating, followed by gating into singlets with size-based gating [forward scatter area (FSC-A) vs. forward scatter height (FSC-H)]. Granulocytes were distinguished from CD45+ leukocytes with size-based gating as well [FSC-A vs. side scatter area (SSC-A)]. Monocytes were distinguished CD45+ leukocytes using CD14 expression. Leukocyte subpopulations were then identified by subtracting CD14+ monocytes from CD45+ leukocytes and categorized by lack or expression of CD19 or CD3 into adaptive and innate immunity. CD19 expressing cells were confirmed to be CD19+ B cells by gating using of HLA-DR. T cells were identified using CD3 expression with further division into CD4-expressing T cells and CD8-expressing T cells. Activated or HLA-DR-expressing CD4+ T cells and CD8+ T cells were also identified in the same gate by placing HLA-DR in the x-axis and CD8 in the y-axis. Cells lacking CD19 and CD3 expression were categorized into innate immunity and further subdivided by HLA-DR expression. HLA-DR expressing cells as part of innate immunity were divided into dendritic cell populations with myeloid dendritic cells identified using CD11c and plasmacytoid dendritic cells using CD123. HLA-DR negative cells were, on the other hand, identified into NK cell populations by using CD56. CD56+ NK cells were then divided into CD56dim and CD56bright cells using CD56 expression as a guide. Innate lymphoid cells were identified from cells lacking CD3 vs. CD19, CD11c vs. CD123, and Ckit vs. CD56.
Figure 2
Figure 2
(A) Features that correlated significantly (p ≤ 0.05) with age in HDs (in blue) were adjusted using linear regression. This adjustment was applied to all patient cohorts, including the MS patient cohort (as shown in red). (B) Features that had significant gender differences (p ≤ 0.05) were adjusted as well with application of this adjustment to all cohorts by subtracting one gender category as group medians.
Figure 3
Figure 3
To compare features in untreated and treated MS patients, propensity score matching was performed to allow for appropriate comparisons in features while accounting for differences in age, gender, and disability. Each matched untreated and treated patient group means and ± SD were graphed. For each drug-treated MS patient group, the algorithm picked out from 118 untreated MS patients a cohort of untreated MS patients that is three times larger than the treated group, while also making sure age, gender, and CombiWISE were as close to the treated group as possible.
Figure 4
Figure 4
Features that validated in the independent validation cohort in blood during comparison of HDs to RRMS and PMS patients were graphed. HDs, NINDs, OINDs, RRMS, and PMS cohorts for each significant feature were graphed. An unpaired t-test was completed to compare each cohort to HDs with adjustment for multiple comparisons. *p < 0.05, **0.01 < p < 0.005, ***p < 0.001, ****p < 0.0001. The HD median for each feature was also graphed horizontally and gray shading added representing ± 2 SDs of each feature in HD cohort. (A) Features in adaptive immunity. (B) Features in innate immunity. (C) Features that validated were correlated with disease duration and statistically significant features graphed (p ≤ 0.05). MS subtypes were color coded to show heterogeneity of cohorts in each significant feature with blue representing RRMS, red representing PPMS, and orange representing SPMS patients.
Figure 5
Figure 5
Features that validated in the independent validation cohort in CSF during comparison of HDs to RRMS and PMS patients were graphed. HDs, NINDs, OINDs, RRMS, and PMS cohorts for each significant feature were graphed. An unpaired t-test was completed to compare each cohort to HDs with adjustment for multiple comparisons. *p < 0.05, **0.01 < p < 0.005, ***p < 0.001, ****p < 0.0001. The HD median for each feature was also graphed horizontally and gray shading added representing ± 2 SDs of each feature in HD cohort. (A) Features in adaptive immunity. (B) Features in innate immunity. (C) Features in other immunity. (D) Features that validated were correlated with disease duration and statistically significant features graphed (p ≤ 0.05). MS subtypes were color coded to show heterogeneity of cohorts in each significant feature with blue representing RRMS, red representing PPMS, and orange representing SPMS patients.
Figure 6
Figure 6
An unpaired t-test with adjustment for multiple comparisons was performed for features during comparison of 36 propensity score matched (PSM) untreated MS patients and 12 IFN-beta treated MS patients in blood and CSF. All significant markers were graphed and supplemented with HD cohort and data from 4 longitudinal patients with paired pretreatment and post-treatment data. *p < 0.05, **0.01 < p < 0.005, ***p < 0.001, ****p < 0.0001. HD median for each feature was also graphed horizontally and gray shading added representing ± 2 SDs of each feature in HD cohort. (A) Features in adaptive immunity in blood. (B) Features in innate immunity in blood. (C) Features in adaptive immunity in CSF. (D) Features in innate immunity in CSF.
Figure 7
Figure 7
An unpaired t-test with adjustment for multiple comparisons was performed for features during comparison of 33 propensity score matched (PSM) untreated MS patients and 11 GA-treated MS patients in blood and CSF. All significant markers were graphed and supplemented with the HD cohort and data from 5 longitudinal patients with paired pretreatment and post-treatment data. *p < 0.05, **0.01 < p < 0.005, ***p < 0.001, ****p < 0.0001. The HD median for each feature was also graphed horizontally and gray shading added representing ± 2 SDs of each feature in the HD cohort. (A) Features in adaptive immunity in blood. (B) Features in innate immunity in blood. (C) Features in adaptive immunity in CSF. (D) Features in innate immunity in CSF. (E) Features in other immunity in CSF.
Figure 8
Figure 8
An unpaired t-test with adjustment for multiple comparisons was performed for features during comparison of 33 PSM untreated MS patients and 11 natalizumab treated MS patients in blood and CSF. All significant markers were graphed and supplemented with the HD cohort and data from 3 longitudinal patients with paired pretreatment and post-treatment data. *p < 0.05, **0.01 < p < 0.005, ***p < 0.001, ****p < 0.0001. The HD median for each feature was also graphed horizontally and gray shading added representing ± 2 SDs of each feature in the HD cohort. (A) Features in adaptive immunity in blood. (B) Features in innate immunity in blood. (C) Features in other immunity in blood. (D) Features in adaptive immunity in CSF. (E) Features in innate immunity in CSF. (F) Features in other immunity in CSF.
Figure 9
Figure 9
An unpaired t-test with adjustment for multiple comparisons was performed for features during comparison of 66 PSM untreated MS patients and 22 daclizumab-treated MS patients in blood and CSF. All significant markers were graphed and supplemented with the HD cohort and data from 4 longitudinal patients with paired pretreatment and post-treatment data. *p < 0.05, **0.01 < p < 0.005, ***p < 0.001, ****p < 0.0001. The HD median for each feature was also graphed horizontally and gray shading added representing ± 2 SDs of each feature in the HD cohort. (A) Features in adaptive immunity in blood. (B) Features in innate immunity in blood. (C) Features in other immunity in blood. (D) Features in adaptive immunity in CSF. (E) Features in innate immunity in CSF. (F) Features in other immunity in CSF.
Figure 10
Figure 10
An unpaired t-test with adjustment for multiple comparisons was performed for features during comparison of 48 PSM untreated MS patients and 16 ocrelizumab-treated MS patients in blood and CSF. All significant markers were graphed and supplemented with the HD cohort and data from 6 longitudinal patients with paired pretreatment and post-treatment data. *p < 0.05, **0.01 < p < 0.005, ***p < 0.001, ****p < 0.0001. The HD median for each feature was also graphed horizontally and gray shading added representing ± 2 SDs of each feature in the HD cohort. (A) Features in adaptive immunity in blood. (B) Features in innate immunity in blood. (C) Features in other immunity in blood. (D) Features in adaptive immunity in CSF. (E) Features in innate immunity in CSF. (F) Features in other immunity in CSF.
Figure 11
Figure 11
All significantly different features between PSM untreated and treated patients were correlated with treatment duration in treated patients and significant correlations graphed (p ≤ 0.05). (A) Significant correlations in IFN-beta treated patient blood. (B) Significant correlations in GA-treated patient blood. (C) Significant correlations in natalizumab-treated patient blood. (D) Significant correlations in daclizumab-treated patient blood. (E) Significant correlations in ocrelizumab-treated patient blood. (F) Significant correlations in natalizumab-treated patient CSF. (G) Significant correlations in daclizumab-treated patient CSF. (H) Significant correlations in ocrelizumab-treated patient CSF.

Similar articles

Cited by

References

    1. Höftberger R. Neuroimmunology: an expanding frontier in autoimmunity. Front Immunol. (2015) 6:206. 10.3389/fimmu.2015.00206 - DOI - PMC - PubMed
    1. Gastaldi M, Zardini E, Scaranzin S, Uccelli A, Andreetta F, Baggi F, et al. . Autoantibody diagnostics in neuroimmunology: experience from the 2018 Italian neuroimmunology association external quality assessment program. Front Neurol. (2020) 10:1385. 10.3389/fneur.2019.01385 - DOI - PMC - PubMed
    1. Han S, Lin YC, Wu T, Salgado AD, Mexhitaj I, Wuest SC, et al. . Comprehensive immunophenotyping of cerebrospinal fluid cells in patients with neuroimmunological diseases. J Immunol. (2014) 192:1551–63. 10.4049/jimmunol.1302884 - DOI - PMC - PubMed
    1. Stüve O, Marra CM, Bar-Or A, Niino M, Cravens PD, Cepok S. Altered CD4+/CD8+ T-cell ratios in cerebrospinal fluid of natalizumab-treated patients with multiple sclerosis. Arch Neurol. (2006) 63:1383–7. 10.1001/archneur.63.10.1383 - DOI - PubMed
    1. Eggers EL, Michel BA, Wu H, Wang SZ, Bevan CJ, Abounasr A, et al. . Clonal relationships of CSF B cells in treatment-naive multiple sclerosis patients. JCI insight. (2017) 2:e92724. 10.1172/jci.insight.92724 - DOI - PMC - PubMed