. 2020 Nov 23:11:594928.
doi: 10.3389/fmicb.2020.594928. eCollection 2020.

Analysis of Indian SARS-CoV-2 Genomes Reveals Prevalence of D614G Mutation in Spike Protein Predicting an Increase in Interaction With TMPRSS2 and Virus Infectivity

Collaborators, Affiliations

Analysis of Indian SARS-CoV-2 Genomes Reveals Prevalence of D614G Mutation in Spike Protein Predicting an Increase in Interaction With TMPRSS2 and Virus Infectivity

Sunil Raghav et al. Front Microbiol. .

Abstract

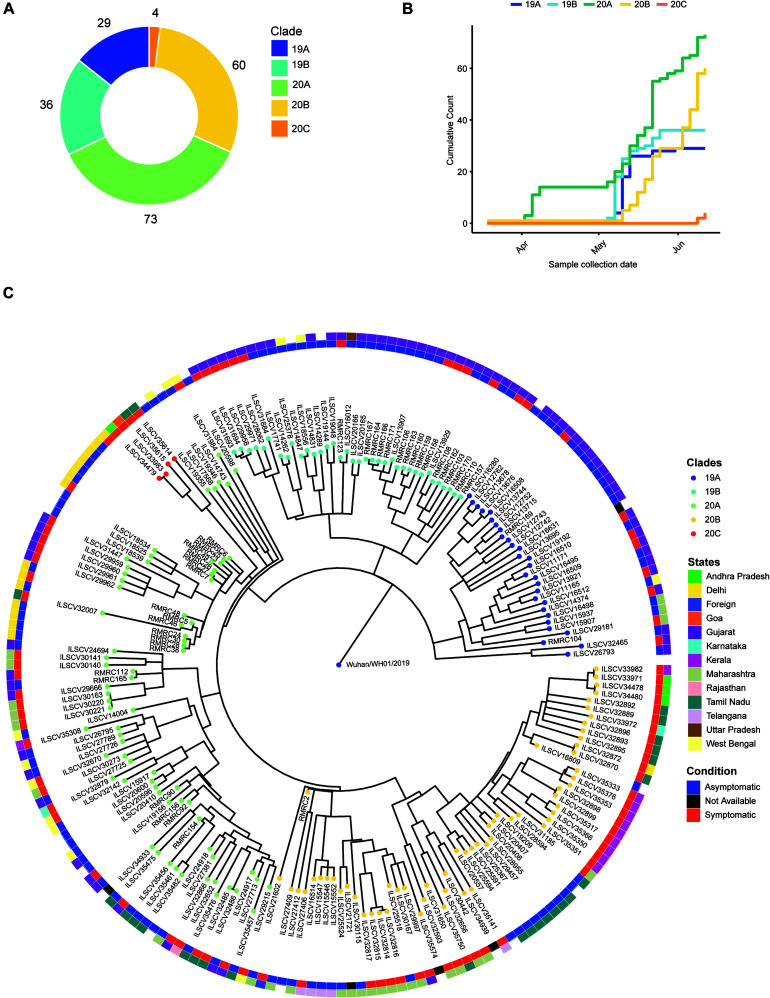
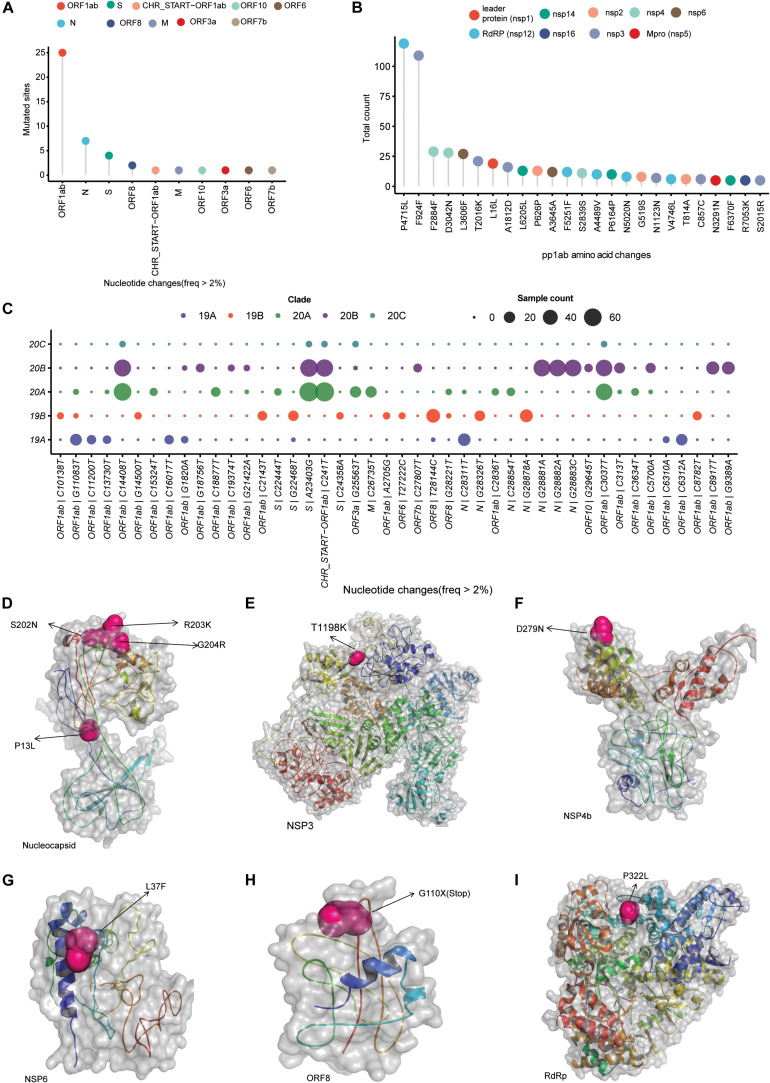
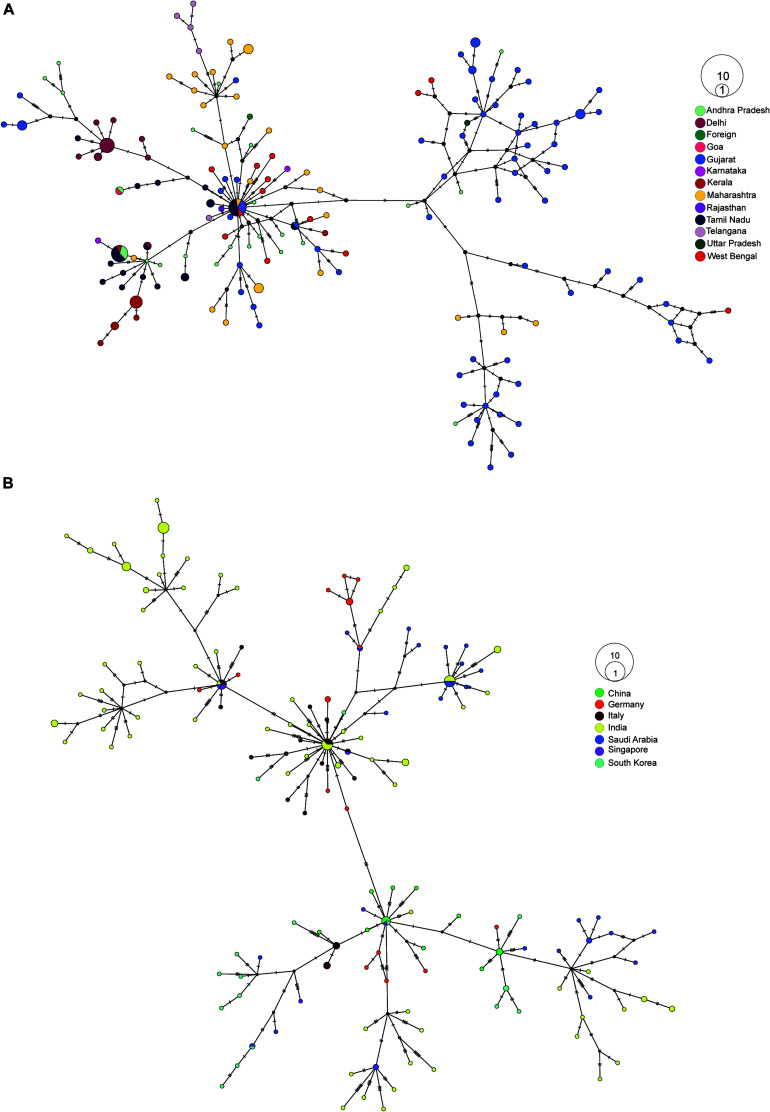
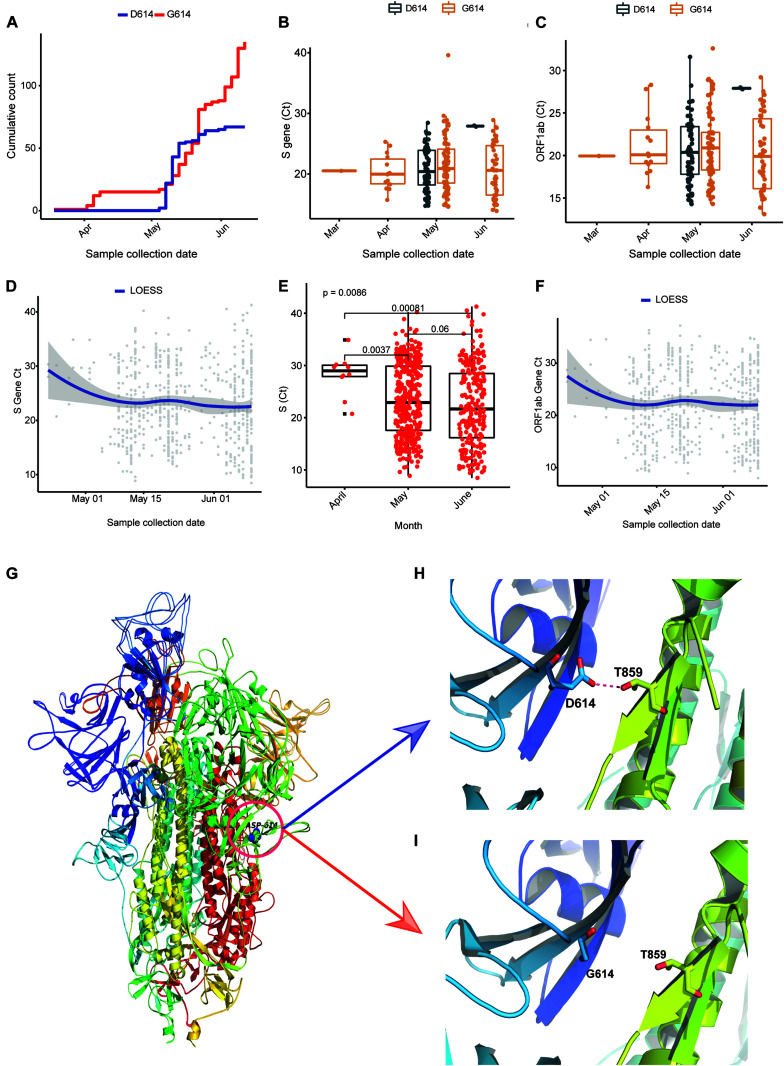
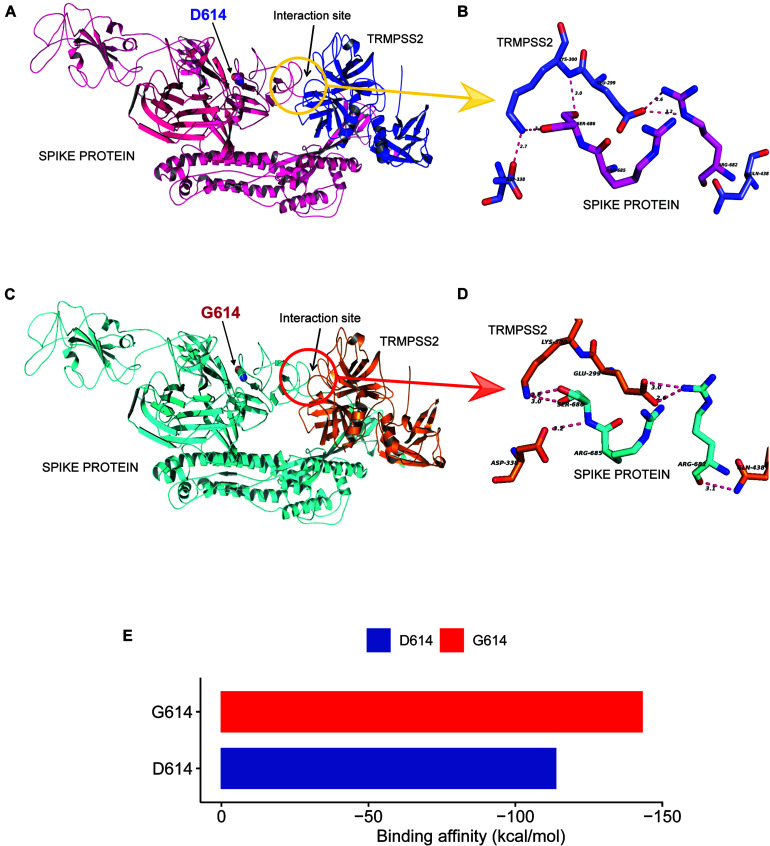
Coronavirus disease 2019 (COVID-19), caused by the severe acute respiratory syndrome coronavirus 2 (SARS-CoV-2) virus, has emerged as a global pandemic worldwide. In this study, we used ARTIC primers-based amplicon sequencing to profile 225 SARS-CoV-2 genomes from India. Phylogenetic analysis of 202 high-quality assemblies identified the presence of all the five reported clades 19A, 19B, 20A, 20B, and 20C in the population. The analyses revealed Europe and Southeast Asia as two major routes for introduction of the disease in India followed by local transmission. Interestingly, the19B clade was found to be more prevalent in our sequenced genomes (17%) compared to other genomes reported so far from India. Haplotype network analysis showed evolution of 19A and 19B clades in parallel from predominantly Gujarat state in India, suggesting it to be one of the major routes of disease transmission in India during the months of March and April, whereas 20B and 20C appeared to evolve from 20A. At the same time, 20A and 20B clades depicted prevalence of four common mutations 241 C > T in 5' UTR, P4715L, F942F along with D614G in the Spike protein. D614G mutation has been reported to increase virus shedding and infectivity. Our molecular modeling and docking analysis identified that D614G mutation resulted in enhanced affinity of Spike S1-S2 hinge region with TMPRSS2 protease, possibly the reason for increased shedding of S1 domain in G614 as compared to D614. Moreover, we also observed an increased concordance of G614 mutation with the viral load, as evident from decreased Ct value of Spike and the ORF1ab gene.

Keywords: COVID-19; D614G; India; SARS-CoV-2; phylogeny; protein-protein interaction; viral RNA sequencing.


Figures

FIGURE 1
FIGURE 1
Phylogenetic analysis of the SARS-Cov genomes and their distribution into different Nextstrain defined new clades. (A) A donut chart representing the sequenced sample (n = 202) distribution across the clades (clade nomenclature obtained using Nextstrain). (B) Cumulative count of clades plotted against sample collection date showing abundance of clades with time. (C) Time tree (1,000 bootstraps) of the sequenced samples (n = 202) generated using Nextstrain time-tree pipeline overlaid with clinical status (condition, inner circle) of the patients during sample collection, place of migration (state, outer circle), and clade information (clades).
FIGURE 2
FIGURE 2
SARS-CoV-2 clade distribution and their prevalent mutation profiles. (A) Dot plot representing the number of single-nucleotide mutation (occurred in more than 2% of the samples) present in different genomic segments of SARS-CoV-2 genome. (B) The ORF1ab region codes for a polypeptide are later cleaved to several mature peptides. The dot plot represents the amino acid changes (location of amino acid acids as per location in polypeptide sequence) in the mature peptides of ORF1ab. (C) Clade-wise occurrence of nucleotide mutations with presence in more than 2% of sequenced samples (n = 202). Color of the dots represents the clade and size of the dots represents number of the samples showing presence of the single-nucleotide variant. (D–I) The mutation sites on the modeled structures of the SARS-CoV-2 proteins. The mutation site(s) of the NSP3, NSP4b, NSP6, RdRP, and nucleocapsid proteins are marked as sphere, while the rest of the structure is shown in cartoon representation.
FIGURE 3
FIGURE 3
Haplotype network analysis of SARS-CoV-2 sequences. (A) Haplotype network of 202 SARS-CoV-2 whole-genome sequences from our dataset colored by their respective place of migration. (B) Haplotype network of 100 high-coverage SARS-CoV-2 genomes obtained from GISAID (China 15, Germany 23, Italy 25, Saudi Arabia 23, Singapore 14, South Korea 17) combined with 170 samples sequenced from Odisha with less than <5% N’s present in consensus sequence.
FIGURE 4
FIGURE 4
D614G in Spike gene increases infectivity portrayed by Ct values as a surrogate for viral load. (A) Cumulative count of the occurrence of D and G in 614 position of Spike protein in sequenced genomes (n = 202). (B,C) Ct value distribution of S gene and ORF1ab for the sequenced genomes (n = 202). (D–F) Ct value distribution of S gene and ORF1ab in all the positive samples tested at Institute of Life Sciences until June 17, 2020. (G–I) The superimposed 3D structures G614 mutant and wild-type Spike protein. (G) The mutant site is highlighted with a circle at 614 position. (H) The hydrogen bond (D614-T859) shown as dotted line between Spike S1 and S2 domain in wild type. (I) The hydrogen bond is lost as a result of D614G mutation.
FIGURE 5
FIGURE 5
D614G change in Spike protein enhanced TMPRSS2 protease interaction that might be responsible for increased virus infectivity. (A–D) The docking study of TMPRSS2 with the wild-type (D614) and mutant (G614) Spike protein. The interaction site and the mutation position (614) is marked with an arrow. The hydrogen bond interactions are shown in pink dotted lines with distance marked in Å. (A) The overview of the docking site location on WT Spike protein, (B) the interactions between TMPRSS2 and wild type, (C) the overview of the docking site location on WT Spike protein, (D) the interactions between TMPRSS2 and mutant Spike protein, and (E) the average binding energy (kcal/mol) values for the top poses selected from five different clusters.

References

    1. Andrews S. (2010). FastQC: A Quality Control Tool for High Throughput Sequence Data [Online]. Available online at: http://www.bioinformatics.babraham.ac.uk/projects/fastqc/
    1. Banu S., Jolly B., Mukherjee P., Singh P., Khan S., Zaveri L., et al. (2020). A distinct phylogenetic cluster of Indian SARS-CoV-2 isolates. Open Forum Infect. Dis. 7 ofaa434 10.1093/ofid/ofaa434 - DOI - PMC - PubMed
    1. Boratyn G. M., Schäffer A. A., Agarwala R., Altschul S. F., Lipman D. J., Madden T. L., et al. (2012). Domain enhanced lookup time accelerated BLAST. Biol. Direct. 7:12. 10.1186/1745-6150-7-12 - DOI - PMC - PubMed
    1. Cingolani P., Platts A., Wang le L., Coon M., Nguyen T., Wang L., et al. (2012). A program for annotating and predicting the effects of single nucleotide polymorphisms, SnpEff: SNPs in the genome of Drosophila melanogaster strain w1118; iso-2; iso-3. Fly 6 80–92. 10.4161/fly.19695 - DOI - PMC - PubMed
    1. Ferron F., Subissi L., Silveira, De Morais A. T., Le N. T. T., Sevajol M., et al. (2018). Structural and molecular basis of mismatch correction and ribavirin excision from coronavirus RNA. Proc. Natl. Acad. Sci. U.S.A. 115 E162–E171. - PMC - PubMed