Multicenter Study
. 2020 Oct 20:11:578505.
doi: 10.3389/fimmu.2020.578505. eCollection 2020.

Preparing for Life: Plasma Proteome Changes and Immune System Development During the First Week of Human Life

Affiliations
Multicenter Study

Preparing for Life: Plasma Proteome Changes and Immune System Development During the First Week of Human Life

Tue Bjerg Bennike et al. Front Immunol. .

Abstract

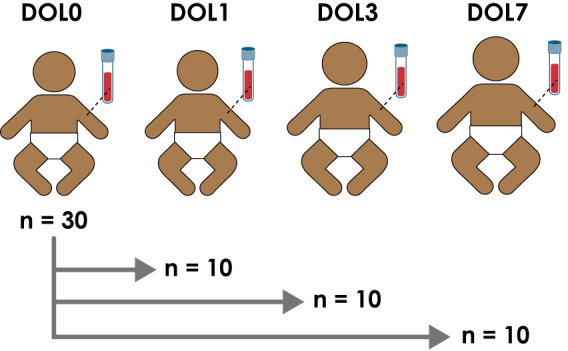
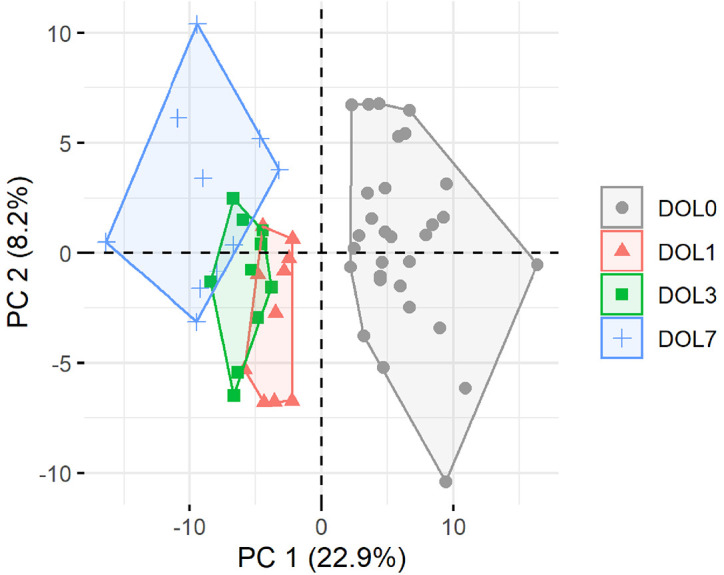
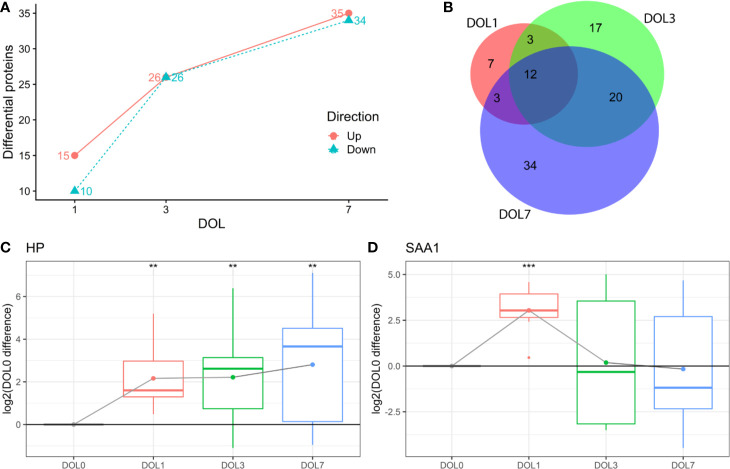
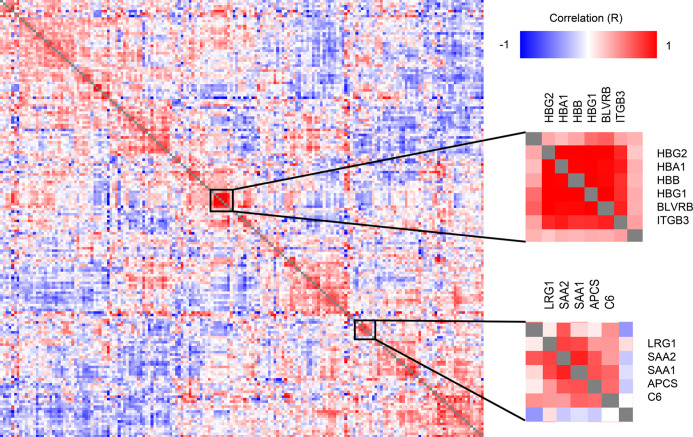
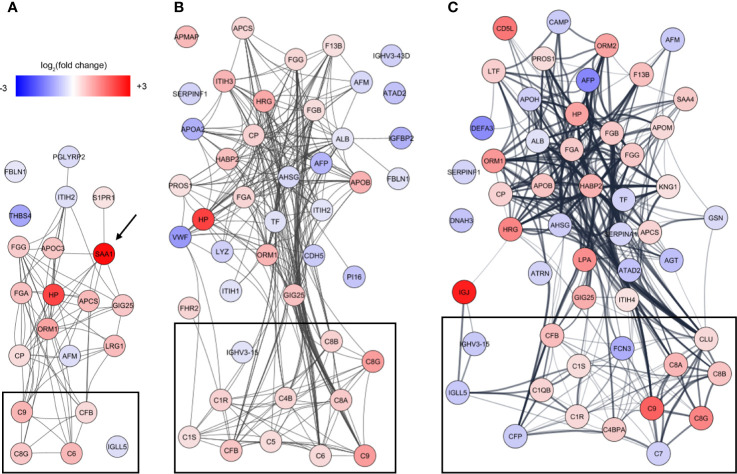
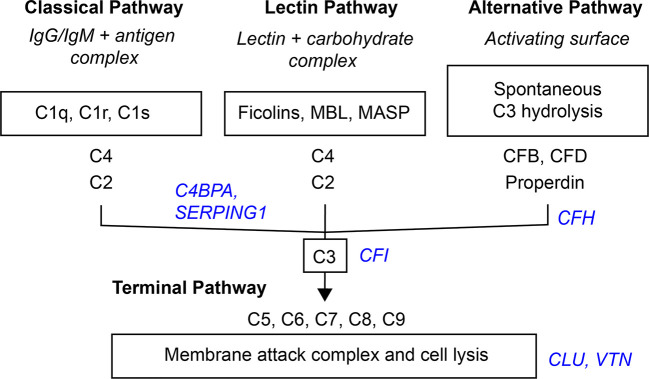
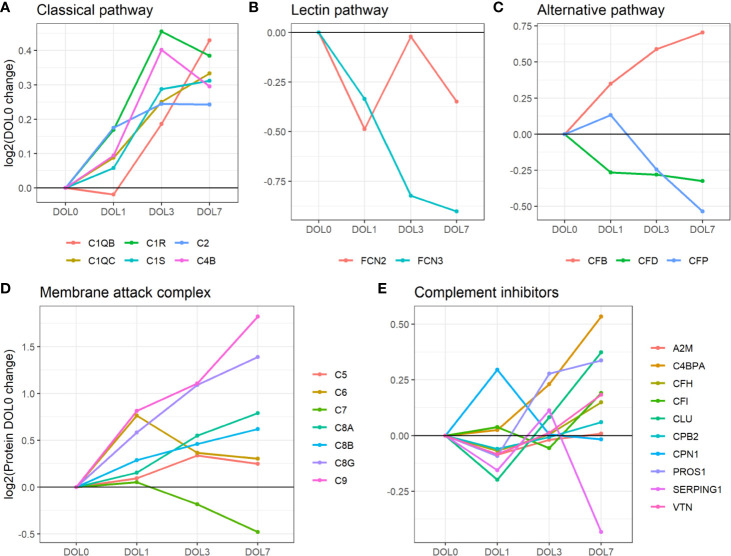
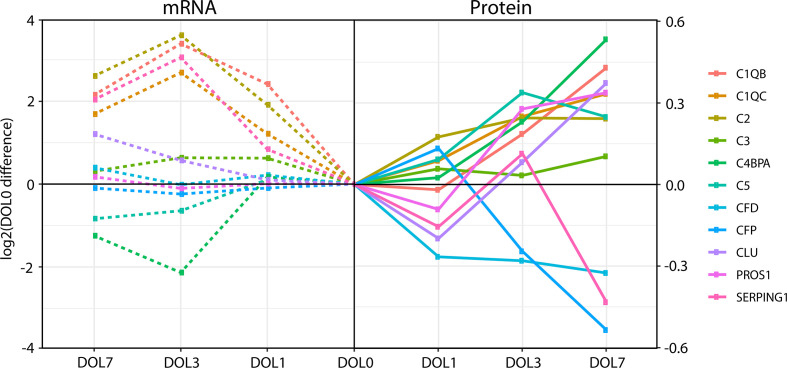
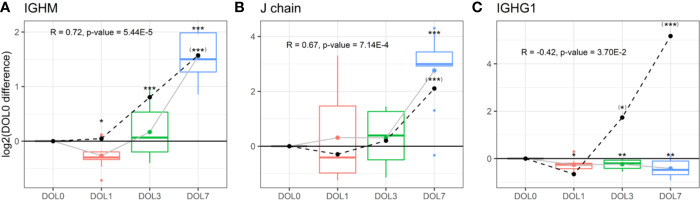
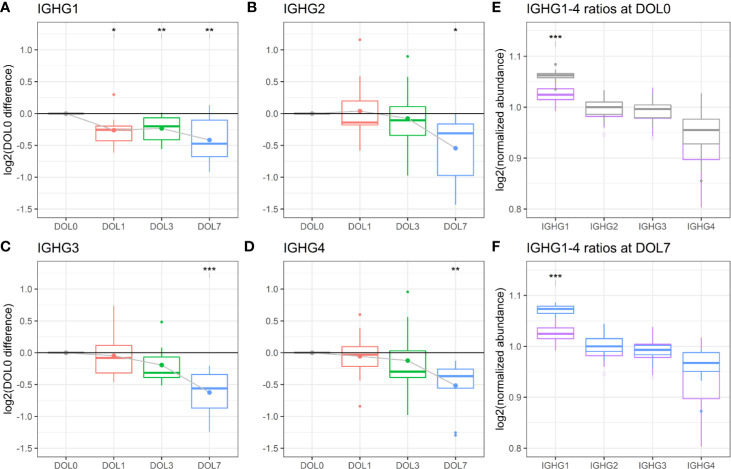
Neonates have heightened susceptibility to infections. The biological mechanisms are incompletely understood but thought to be related to age-specific adaptations in immunity due to resource constraints during immune system development and growth. We present here an extended analysis of our proteomics study of peripheral blood-plasma from a study of healthy full-term newborns delivered vaginally, collected at the day of birth and on day of life (DOL) 1, 3, or 7, to cover the first week of life. The plasma proteome was characterized by LC-MS using our established 96-well plate format plasma proteomics platform. We found increasing acute phase proteins and a reduction of respective inhibitors on DOL1. Focusing on the complement system, we found increased plasma concentrations of all major components of the classical complement pathway and the membrane attack complex (MAC) from birth onward, except C7 which seems to have near adult levels at birth. In contrast, components of the lectin and alternative complement pathways mainly decreased. A comparison to whole blood messenger RNA (mRNA) levels enabled characterization of mRNA and protein levels in parallel, and for 23 of the 30 monitored complement proteins, the whole blood transcript information by itself was not reflective of the plasma protein levels or dynamics during the first week of life. Analysis of immunoglobulin (Ig) mRNA and protein levels revealed that IgM levels and synthesis increased, while the plasma concentrations of maternally transferred IgG1-4 decreased in accordance with their in vivo half-lives. The neonatal plasma ratio of IgG1 to IgG2-4 was increased compared to adult values, demonstrating a highly efficient IgG1 transplacental transfer process. Partial compensation for maternal IgG degradation was achieved by endogenous synthesis of the IgG1 subtype which increased with DOL. The findings were validated in a geographically distinct cohort, demonstrating a consistent developmental trajectory of the newborn's immune system over the first week of human life across continents. Our findings indicate that the classical complement pathway is central for newborn immunity and our approach to characterize the plasma proteome in parallel with the transcriptome will provide crucial insight in immune ontogeny and inform new approaches to prevent and treat diseases.

Keywords: complement; immunoglobulin; inhibitors; innate immune system; membrane attack complex (MAC); ontogeny; proteomics; terminal complement complex (SC5b-9).


Figures

Figure 1
Figure 1
Study design and number of enrolled newborns in the main cohort enrolled in The Gambia.
Figure 2
Figure 2
Principal component analysis (PCA) plot of all quantifiable proteins separates samples by day of life (DOL). PC, principal component. Explained variance given in percentages.
Figure 3
Figure 3
Differentially abundant plasma proteins (q-value < 0.05) compared to day of life (DOL) 0. (A) We identified a robust trajectory of differentially expressed proteins over the first week of life. (B) Overlap of regulated proteins. Protein regulations of (C) Haptoglobin (HP). (D) Serum amyloid A1 (SAA1) normalized to DOL0, with mean abundance difference indicated by dots connected with a line. q-value * <0.05, **: <0.01, ***: <0.001.
Figure 4
Figure 4
Clustered Pearson’s protein-protein correlation matrix of protein changes during the first week of life, of all quantifiable proteins (on the x- and y-axis) which allows for identifying proteins with similar trajectories across all samples. Several clusters of correlating proteins were identified, including a cluster centered around hemoglobin and an acute phase response cluster including SAA1 and SAA2.
Figure 5
Figure 5
Analysis of protein-protein interactions of the differentiating proteins at (A) DOL1, (B) DOL3, and (C) DOL7 compared to DOL0 (at birth). SAA1 which was regulated at DOL1 only is indicated with an arrow, and lines indicate interacting proteins. Proteins tagged as complement system in Gene Ontology are indicated with black boxes without further curation.
Figure 6
Figure 6
Simplified scheme of the three activation- and terminal complement pathway. Inhibitors in blue italic.
Figure 7
Figure 7
Average change of complement proteins grouped by their function across the first week of life compared to DOL0. (A) classical pathway, (B) lectin pathway, and (C) alternative pathway. (D) Membrane attack complex (MAC) proteins, (E) complement inhibitors. Pathway activations from Gene Ontology without further curation.
Figure 8
Figure 8
Divergence of complement plasma protein and whole blood messenger RNA (mRNA) levels, as compared to DOL0, of the 11 complement proteins with detected whole blood mRNA.
Figure 9
Figure 9
Protein and messenger RNA (mRNA) levels (dotted line) of (A) IgM, (B) J chain, (C) IgG1 across the first week of life compared to DOL0, with mean abundance difference indicated by dots connected by lines. Protein to RNA correlation and p-value given. Statistics compared to DOL0: q-value protein (mRNA) <0.05: *(*), <0.01: **(**), <0.001: ***(***).
Figure 10
Figure 10
Protein levels of (A–D) IgG1-4 across the first week of life as compared to DOL0, with mean abundance difference indicated by dots connected by solid line. (E) Comparison of the ratios of IgG1-4 normalized to IgG2 between adult-levels (purple) and newborn-levels at DOL0 (gray), or (F) DOL7 (blue). Statistics A–D (E, F): q-value <0.05: *, <0.01: **, <0.001: ***.

References

    1. Zhang X, Zhivaki D, Lo-Man R. Unique aspects of the perinatal immune system. Nat Rev Immunol (2017) 17(8):495–507. 10.1038/nri.2017.54 - DOI - PubMed
    1. Kollmann TR, Kampmann B, Mazmanian SK, Marchant A, Levy O. Protecting the Newborn and Young Infant from Infectious Diseases: Lessons from Immune Ontogeny. Immunity (2017) 21 46(3):350–63. 10.1016/j.immuni.2017.03.009 - DOI - PubMed
    1. Balbus JM, Barouki R, Birnbaum LS, Etzel RA, Gluckman SPD, Grandjean P, et al. Early-life prevention of non-communicable diseases. Lancet (2013) 381:3–4. 10.1016/S0140-6736(12)61609-2 - DOI - PMC - PubMed
    1. Zinkernagel RM. Maternal antibodies, childhood infections, and autoimmune diseases. N Engl J Med (2001) 345(18):1331–5. 10.1056/NEJMra012493 - DOI - PubMed
    1. McGreal EP, Hearne K, Spiller OB. Off to a slow start: Under-development of the complement system in term newborns is more substantial following premature birth. Immunobiology (2012) 217(2):176–86. 10.1016/j.imbio.2011.07.027 - DOI - PubMed

Publication types