. 2020 Nov 27:11:590121.
doi: 10.3389/fimmu.2020.590121. eCollection 2020.

Maturation of Monocyte-Derived DCs Leads to Increased Cellular Stiffness, Higher Membrane Fluidity, and Changed Lipid Composition

Affiliations

Maturation of Monocyte-Derived DCs Leads to Increased Cellular Stiffness, Higher Membrane Fluidity, and Changed Lipid Composition

Jennifer J Lühr et al. Front Immunol. .

Abstract

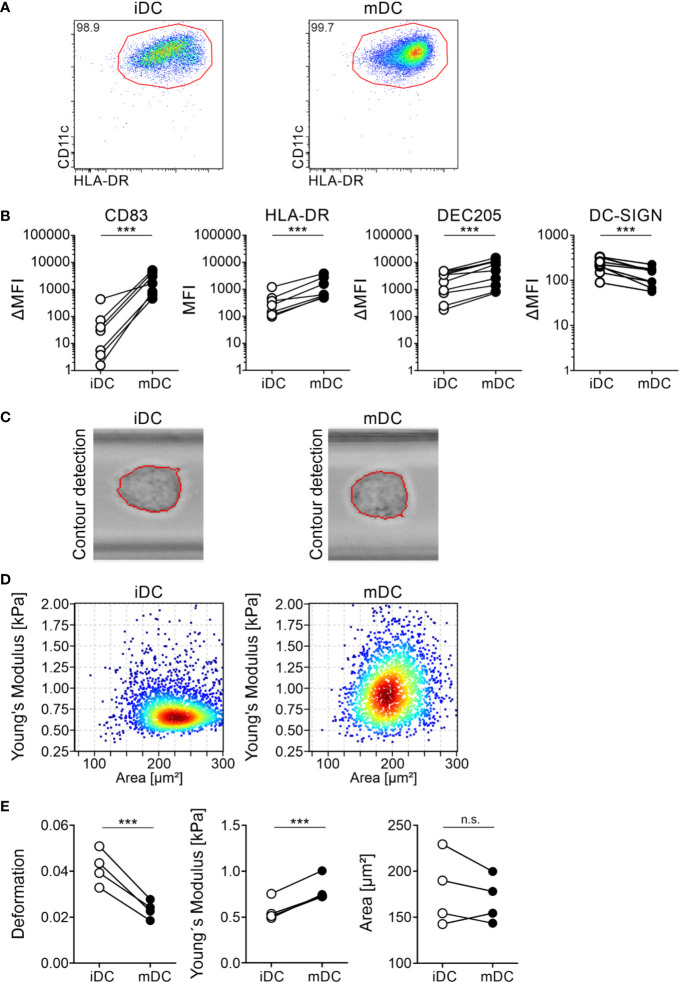
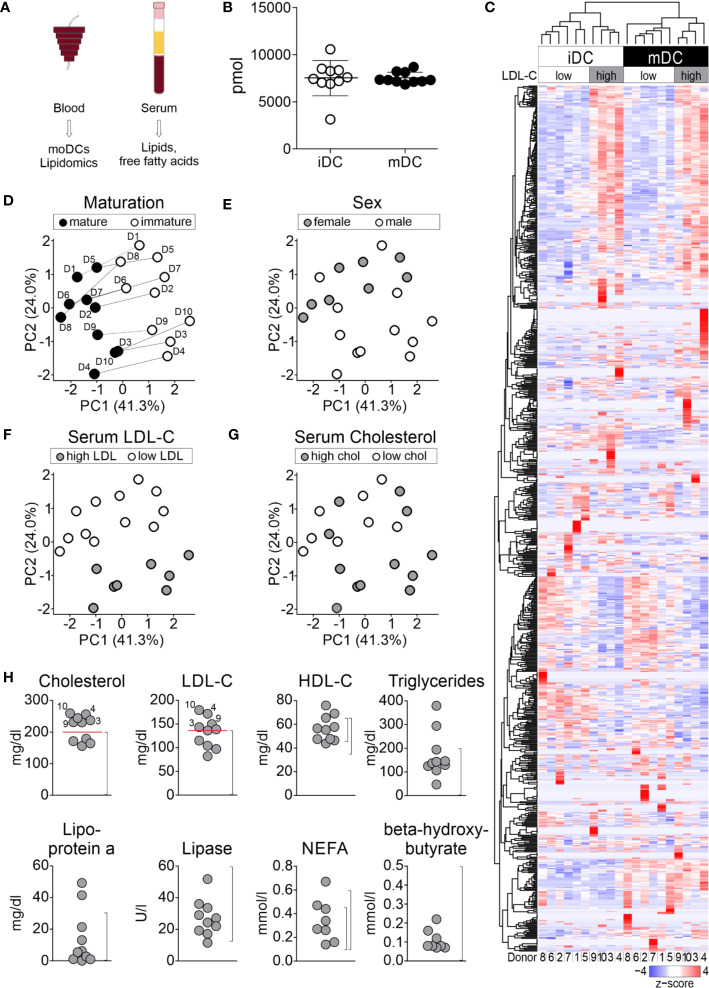
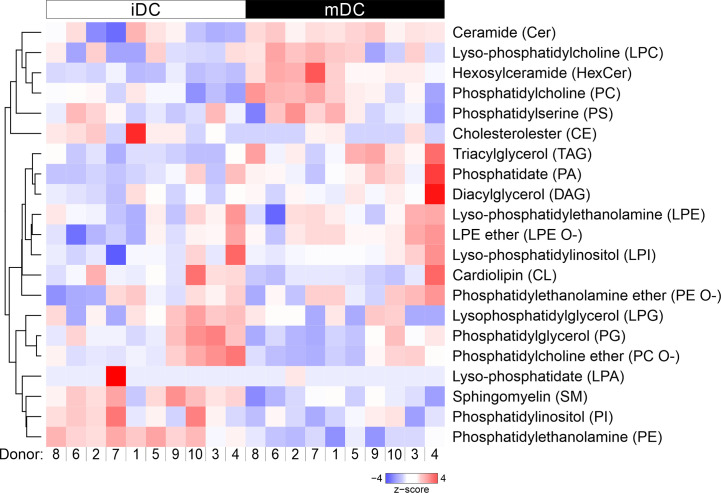
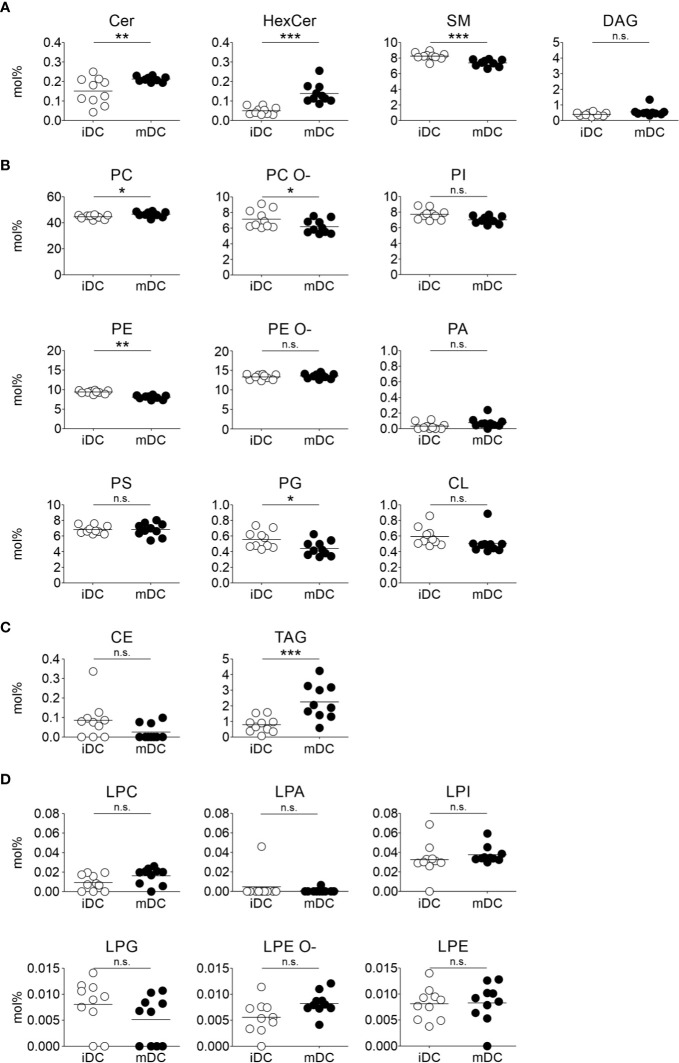
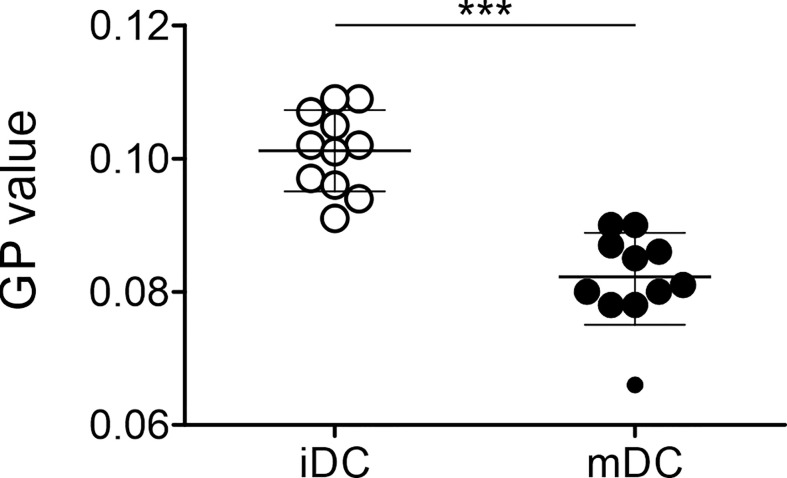
Dendritic cells (DCs) are professional antigen-presenting cells of the immune system. Upon sensing pathogenic material in their environment, DCs start to mature, which includes cellular processes, such as antigen uptake, processing and presentation, as well as upregulation of costimulatory molecules and cytokine secretion. During maturation, DCs detach from peripheral tissues, migrate to the nearest lymph node, and find their way into the correct position in the net of the lymph node microenvironment to meet and interact with the respective T cells. We hypothesize that the maturation of DCs is well prepared and optimized leading to processes that alter various cellular characteristics from mechanics and metabolism to membrane properties. Here, we investigated the mechanical properties of monocyte-derived dendritic cells (moDCs) using real-time deformability cytometry to measure cytoskeletal changes and found that mature moDCs were stiffer compared to immature moDCs. These cellular changes likely play an important role in the processes of cell migration and T cell activation. As lipids constitute the building blocks of the plasma membrane, which, during maturation, need to adapt to the environment for migration and DC-T cell interaction, we performed an unbiased high-throughput lipidomics screening to identify the lipidome of moDCs. These analyses revealed that the overall lipid composition was significantly changed during moDC maturation, even implying an increase of storage lipids and differences of the relative abundance of membrane lipids upon maturation. Further, metadata analyses demonstrated that lipid changes were associated with the serum low-density lipoprotein (LDL) and cholesterol levels in the blood of the donors. Finally, using lipid packing imaging we found that the membrane of mature moDCs revealed a higher fluidity compared to immature moDCs. This comprehensive and quantitative characterization of maturation associated changes in moDCs sets the stage for improving their use in clinical application.

Keywords: cell mechanics; cellular stiffness; cholesterol; lipidomics; lipids; low-density lipoprotein; maturation; monocyte-derived dendritic cells.


Conflict of interest statement

The authors declare that the research was conducted in the absence of any commercial or financial relationships that could be construed as a potential conflict of interest.

Figures

Figure 1
Figure 1
Differential protein surface expression and cell mechanics of immature and mature moDCs. moDCs were generated from monocytes of healthy donors within seven days in cell culture in the presence of GM-CSF and IL-4. On day 6 half of the cells were activated using a maturation cocktail consisting of PGE2, TNFα, IL-1β, and IL-6. On day 7 immature (iDC) and mature (mDC) moDCs were harvested and 5 × 10⁵ cells were stained for FACS analysis with the antibodies CD11c-PE/Cy7 (1:100), HLA-DR-BV605 (1:100), CD83-A647 (1:100), and CD86-PE (1:100), or respective isotype controls. Cells were recorded using BD LSRFortessa and analyzed using FlowJo software. (A) Gating of double positive CD11c+HLA-DR+ immature and mature moDCs. Depicted is the gating of one representative donor. (B) Paired scatter plots of expression of activation markers CD83 and HLA-DR on immature and mature moDCs as well as the DC markers DEC205 and DC-SIGN. Median fluorescence intensity ΔMFI results of the MFI of antibodies against CLRs minus MFI of the corresponding isotype controls. Statistical significances were calculated using paired t-test (n≥10). Not significant (n.s.) p>0.05, *p<0.05, **p ≤ 0.01, ***p ≤ 0.001. (C–E) Real-time fluorescence deformability cytometry of immature (iDC) and mature (mDC) moDCs. moDCs were generated as described before. On day 7, immature and mature moDCs were harvested and 1 × 10⁶ cells were stained for real-time fluorescence deformability cytometry analysis with the antibodies CD83-PE (1:100) and HLA-DR-FITC (1:50). Real-time fluorescence deformability cytometry of immature and mature moDCs from one representative donor (n = 4). (C) Phase-contrast images of one representative immature and mature cell with contour detection showing deformation of moDCs. (D) Young’s modulus with (elastic modulus E) of immature and mature moDCs of the same representative donor as in (C). (E) Paired scatter plots of deformation, Young’s modulus and cell size (area) of all donors. Statistical significances were calculated using linear mixed model (n = 4). Not significant (n.s.) p>0.05, *p<0.05, **p ≤ 0.01, ***p ≤ 0.001.
Figure 2
Figure 2
Lipid analyses of moDCs. moDCs were generated as described before. Immature and mature moDCs of ten healthy blood donors were sorted by flow cytometry and shotgun lipidomics analysis of 1.2 × 10⁵ to 2.3 × 10⁵ cells using mass spectrometry was performed by Lipotype Dresden. (A) Workflow for lipid analyses. (B) Global lipid content of immature and mature moDCs of all donors. The total amount of lipids was calculated by summing the pmol values of the individual lipids belonging to each donor. Values represent the mean of ten biological replicates. (C) 830 different lipids were detected, which make up the dendrogram on the left hand side of graph. Each column represents one sample: white indicates immature moDCs, while black depicts mature moDCs. The lipid amounts of cells have been normalized and scaled to a minimum of −4 and maximum of 4. Hierarchical clustering was performed using average linkage, where the distance between clusters has been calculated using Pearson’s correlation coefficient ρ (d=(1-ρ)/2). Principal component analysis (PCA) for identification of (D) maturation, (E) sex, (F) serum LDL-C, and (G) serum cholesterol-dependent lipid composition of moDCs. Lipid species mol% values per sample were used as input data and further analyzed using R software. Shown are the two principal components (PCs) that had the highest contribution to the variance within the data set. PC1: 41.3%, PC2: 24.0%. (H) Analysis of lipids and fatty acids for determination of overall serum lipid profile. Dot plots of serum lipid levels from blood donors for cholesterol (normal rage (NR): <200 mg/dl), low-density lipoprotein (LDL-C, NR: <140 mg/dl), high-density lipoprotein (HDL-C, NR female: 45–65 mg/dl, NR male: 35–65 mg/dl), triglycerides (NR: <200 mg/dl), lipoprotein a (NR: 0–30 mg/dl), lipase (NR: 13–60 U/L), non-esterified amino acids (NEFA, NR female: 0.10–0.45 mmol/L, NR male: 0.10–0.60 mmol/L), and β-hydroxybutyrate (NR: <0.5 mmol/L). Normal ranges for each lipid or fatty acid are indicated in brackets. Analyzed donors n = 10 (same donors as for lipidomics).
Figure 3
Figure 3
Hierarchical clustering of lipid classes. Mass spectrometric analysis of total lipid composition of immature and mature moDCs was conducted. Here, lipid species were grouped into 20 different lipid classes, which resulted in the dendrogram on the left hand side. Each column represents one sample: white indicates immature moDCs, whereas black depicts mature moDCs. The order of donors follows the clustering from Figure 2C. The lipid amounts of cells have been normalized and scaled to a minimum of −4 and maximum of 4. Hierarchical clustering of lipid classes was performed using average linkage, where the distance between clusters has been calculated using Pearson’s correlation coefficient ρ (d=(1-ρ)/2).
Figure 4
Figure 4
Lipid class changes upon maturation of moDCs. Mass spectrometric analysis of total lipid composition of immature and mature moDCs was carried out. Scatter plots demonstrate lipid class amounts for immature and mature moDCs of all donors. The amount of a lipid class (mol%) is calculated by summing the pmol values of the individual lipids belonging to each class. The class amount was then normalized to total lipid content. Horizontal lines represent mean values of the biological replicates. Content of membrane lipids is divided in (A) sphingolipids and glycerolipids, and (B) glycerophospholipids. (C) Lipid content of storage lipids and (D) messenger lipids in immature and mature moDCs. Statistical significances were calculated using ANOVA (n≥10). Not significant (n.s.) p > 0.05, *p < 0.05, **p ≤ 0.01, ***p ≤ 0.001.
Figure 5
Figure 5
Differential lipid order of plasma membrane of immature and mature moDCs. Lipid packing imaging of immature and mature moDCs was performed. Therefore, cells were spiked with a final concentration of 0.4 μM with Di-4-ANEPPDHQ. The spectral imaging was performed using a Zeiss LSM780 confocal microscope equipped with a 32-channel GaAsP detector array. Fluorescence excitation of Di-4-ANEPPDHQ was set to 488 nm and the lambda detection range was set between 500 and 700 nm. The values of the 32 channels were analyzed within the ImageJ plug-in “Stacks-T functions-Intensity vs. Time Monitor”. To calculate generalized polarization (GP) values, the wavelengths λ = 650 nm as maximum wavelength in disordered membraned (red shifted) and λ = 560 nm as maximum wavelength in the gel phase (blue shifted) were used as described previously (77, 78). GP =I560I650I560+I650Statistical significances were calculated using paired t-test (n ≥ 10). Not significant (n.s.) p > 0.05, *p < 0.05, **p ≤ 0.01, ***p ≤ 0.001.

References

    1. Banchereau J, Steinman R. Dendritic Cells and and the control of immunity. Nature (1998) 392(6673):245–52. 10.1038/32588 - DOI - PubMed
    1. Steinman RM, Banchereau J. Taking dendritic cells into medicine. Nature (2007) 449(7161):419–26. 10.1038/nature06175 - DOI - PubMed
    1. Heidkamp GF, Sander J, Lehmann CHK, Heger L, Eissing N, Baranska A, et al. Human lymphoid organ dendritic cell identity is predominantly dictated by ontogeny, not tissue microenvironment. Sci Immunol (2016) 1(6):eaai7677. 10.1126/sciimmunol.aai7677 - DOI - PubMed
    1. Steinman R, Inaba K. Immunogenicity: role of dendritic cells. BioEssays (1989) 10(5):145–52. 10.1002/bies.950100503 - DOI - PubMed
    1. Dalod M, Chelbi R, Malissen B, Lawrence T. Dendritic cell maturation: functional specialization through signaling specificity and transcriptional programming. EMBO J (2014) 33(10):1104–16. 10.1002/embj.201488027 - DOI - PMC - PubMed

Publication types