. 2020 Nov 20:11:489357.
doi: 10.3389/fgene.2020.489357. eCollection 2020.

Cascabel: A Scalable and Versatile Amplicon Sequence Data Analysis Pipeline Delivering Reproducible and Documented Results

Affiliations

Cascabel: A Scalable and Versatile Amplicon Sequence Data Analysis Pipeline Delivering Reproducible and Documented Results

Alejandro Abdala Asbun et al. Front Genet. .

Abstract

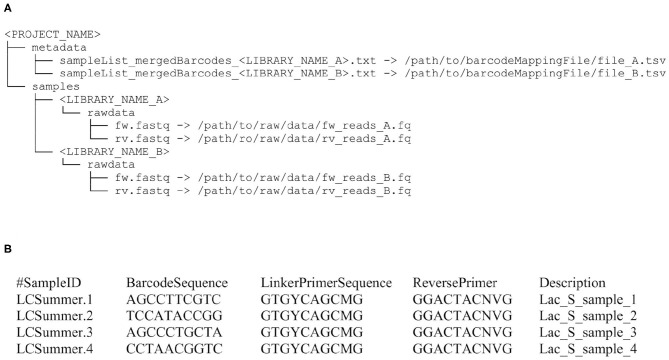
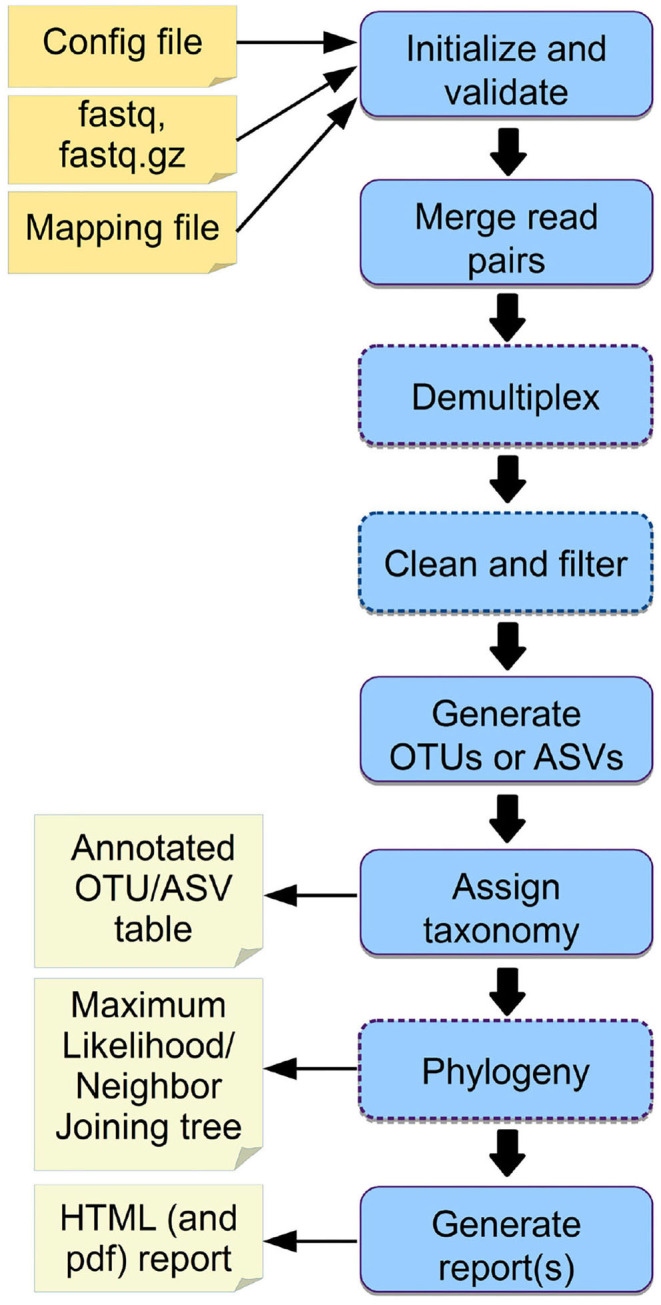
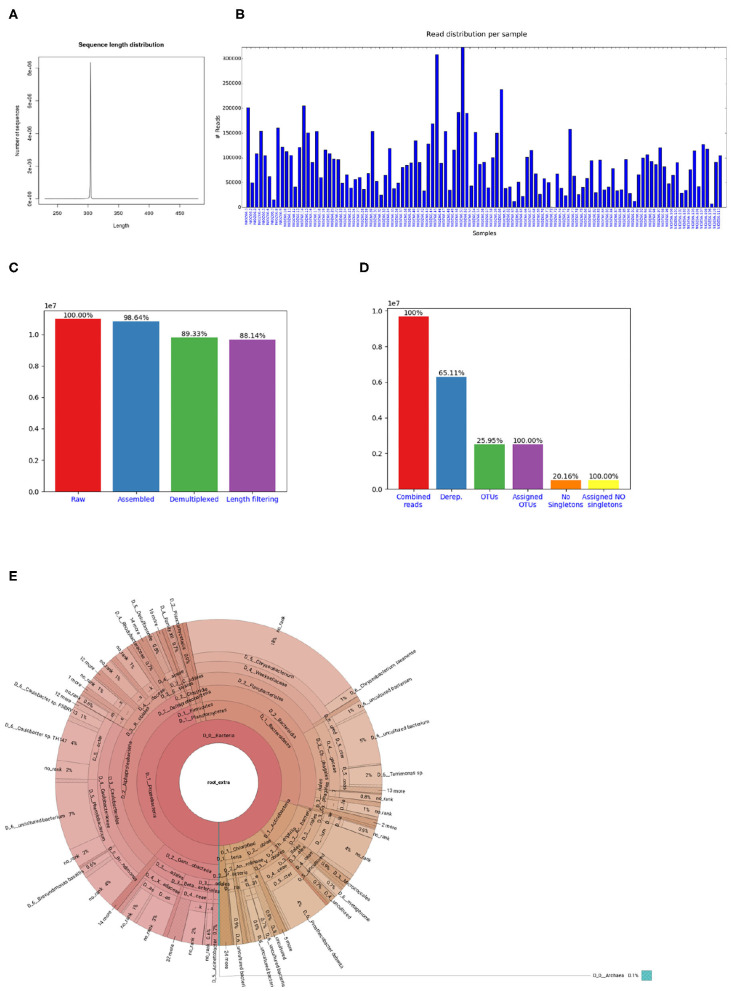
Marker gene sequencing of the rRNA operon (16S, 18S, ITS) or cytochrome c oxidase I (CO1) is a popular means to assess microbial communities of the environment, microbiomes associated with plants and animals, as well as communities of multicellular organisms via environmental DNA sequencing. Since this technique is based on sequencing a single gene, or even only parts of a single gene rather than the entire genome, the number of reads needed per sample to assess the microbial community structure is lower than that required for metagenome sequencing. This makes marker gene sequencing affordable to nearly any laboratory. Despite the relative ease and cost-efficiency of data generation, analyzing the resulting sequence data requires computational skills that may go beyond the standard repertoire of a current molecular biologist/ecologist. We have developed Cascabel, a scalable, flexible, and easy-to-use amplicon sequence data analysis pipeline, which uses Snakemake and a combination of existing and newly developed solutions for its computational steps. Cascabel takes the raw data as input and delivers a table of operational taxonomic units (OTUs) or Amplicon Sequence Variants (ASVs) in BIOM and text format and representative sequences. Cascabel is a highly versatile software that allows users to customize several steps of the pipeline, such as selecting from a set of OTU clustering methods or performing ASV analysis. In addition, we designed Cascabel to run in any linux/unix computing environment from desktop computers to computing servers making use of parallel processing if possible. The analyses and results are fully reproducible and documented in an HTML and optional pdf report. Cascabel is freely available at Github: https://github.com/AlejandroAb/CASCABEL.

Keywords: 16S/18S rRNA gene; Illumina; amplicon sequencing; community profiling; microbiome; pipeline; snakemake.


Figures

Figure 1
Figure 1
Input file structure for Cascabel. (A) This input file structure is generated from the file paths provided in the config file when the dataset consists of a single sequencing library. For multiple libraries, it is created from a text file specifying the individual libraries or by the helper script initSample.sh. (B) Example of a barcode mapping file for four samples. Barcode and primer sequences are listed in 5′-3′ direction and have been abbreviated.
Figure 2
Figure 2
Overview of Cascabel. The workflow indicates input files (config file, sequence data in fastq format, barcode mapping file), mandatory and optional steps of the pipeline (blue boxes) as well as the main output files. The boxes of optional steps have dashed borders. “Clean and filter” refers to removing primers/adapters and chimeras. Table 1 shows a detailed summary of the steps, available tools and output files.
Figure 3
Figure 3
Figures shown in Cascabel reports. (A) Smoothed sequence length distribution after merging reads, for one library. The plot is meant to help making a sensible choice for sequence length filtering. (B) Number of sequences per sample. This histogram is part of the OTU report (including all libraries). (C) Number of sequences after individual pre-processing steps. “Assembled” refers to the number of raw read pairs which could be merged based on their overlap. “Demultiplexed” refers to the number of raw reads which could be assembled and assigned to a sample, and “Length filtering” indicates the number of raw reads passing the previous and the sequence length criteria. This plot is part of the library report. (D) Number of sequences after individual steps after potentially combining several libraries (total number of reads) and generating OTUs. “Derep.” indicates the number of dereplicated reads and their percentage relative to the total combined reads. “OTUs” is the total number of OTUs and the percentage is relative to the number of combined reads. “Assigned OTUs” is the number and percentage of OTUs with a taxonomic assignment. “No singletons” refers to the number and percentage of OTUs excluding singleton OTUs, and “Assigned NO singletons” is the number and percentage of singleton-free OTUs with a taxonomic assignation. The plot is part of the OTU report. (E) Krona chart for one sample. The krona charts are interactive and can be viewed with a web browser. Colors indicate the taxonomic groups to which the OTU was assigned. Each ring of the pie chart represents a different taxonomic level. An example of a full library report is shown in Supplementary Datasheet 3, and an OTU report is provided in Supplementary Datasheet 4.

References

    1. Afgan E., Baker D., Batut B., van den Beek M., Bouvier D., Cech M., et al. (2018). The Galaxy platform for accessible, reproducible and collaborative biomedical analyses: 2018 update. Nucleic Acids Res. 46, W537–W544. 10.1093/nar/gky379 - DOI - PMC - PubMed
    1. Altschul S., Gish W., Miller W., Myers E., Lipman D. (1990). Basic local alignment search tool. J. Mol. Biol. 215, 403–410. 10.1016/S0022-2836(05)80360-2 - DOI - PubMed
    1. Amato A., Kooistra W. H. C. F., Ghiron J. H. L., Mann D. G., Pröschold T., Montresor M. (2007). Reproductive isolation among sympatric cryptic species in marine diatoms. Protist 158, 193–207. 10.1016/j.protis.2006.10.001 - DOI - PubMed
    1. Amir A., McDonald D., Navas-Molina J. A., Kopylova E., Morton J. T., Zech Xu Z., et al. . (2017). Deblur rapidly resolves single-nucleotide community sequence patterns. mSystems 2:e00191-16. 10.1128/mSystems.00191-16 - DOI - PMC - PubMed
    1. Andrews S. (2010). FastQC: A Quality Control Tool for High Throughput Sequence Data. Available online at: http://www.bioinformatics.babraham.ac.uk/projects/fastqc

LinkOut - more resources