. 2020 Dec;16(12):1232-1237.
doi: 10.1038/s41567-020-0978-6. Epub 2020 Aug 10.

Universal scaling laws rule explosive growth in human cancers

Affiliations

Universal scaling laws rule explosive growth in human cancers

Víctor M Pérez-García et al. Nat Phys. 2020 Dec.

Abstract

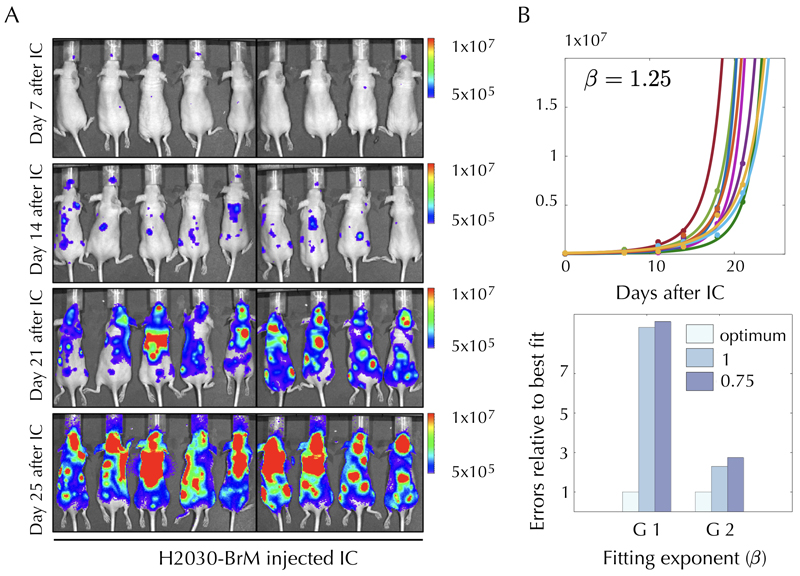
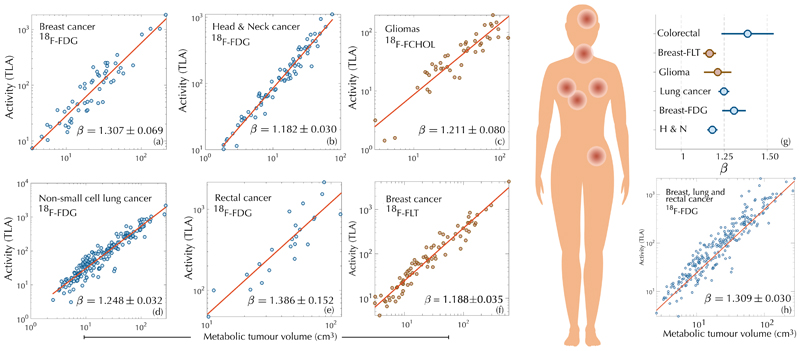
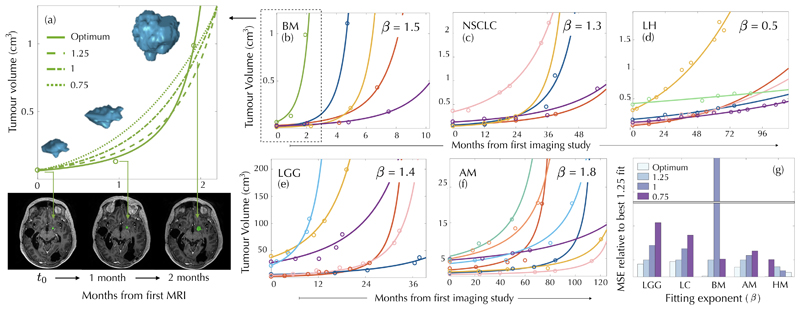
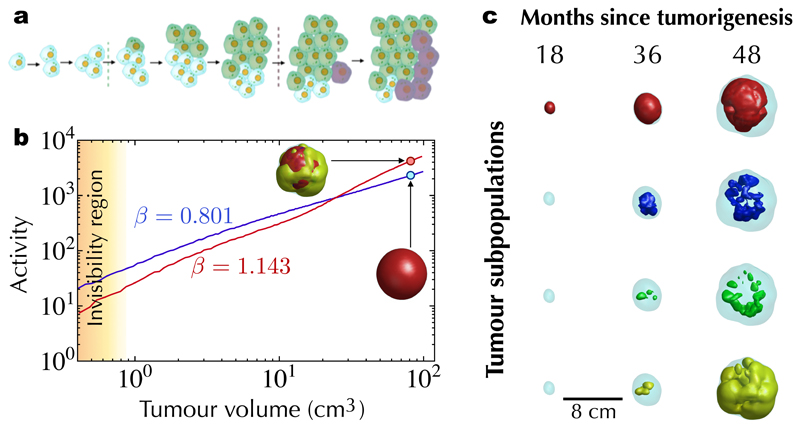
Most physical and other natural systems are complex entities composed of a large number of interacting individual elements. It is a surprising fact that they often obey the so-called scaling laws relating an observable quantity with a measure of the size of the system. Here we describe the discovery of universal superlinear metabolic scaling laws in human cancers. This dependence underpins increasing tumour aggressiveness, due to evolutionary dynamics, which leads to an explosive growth as the disease progresses. We validated this dynamic using longitudinal volumetric data of different histologies from large cohorts of cancer patients. To explain our observations we put forward increasingly-complex biologically-inspired mathematical models that captured the key processes governing tumor growth. Our models predicted that the emergence of superlinear allometric scaling laws is an inherently three-dimensional phenomenon. Moreover, the scaling laws thereby identified allowed us to define a set of metabolic metrics with prognostic value, thus providing added clinical utility to the base findings.


Conflict of interest statement

Competing interests The authors declare no competing interests.

Figures

Extended Data Fig. 1
Extended Data Fig. 1. Two human cancer animal models display superlinear growth dynamics
Two human cancer animal models display superlinear growth dynamics. Group 1 (G1) data correspond to untreated nude mice injected with the human lung adenocarcinoma brain tropic model H2030-BrM (see methods). Group data (G2) correspond to primary glioma cells (L0627) expressing the luciferase reporter gene injected into the brain of nude mice (see methods). Bioluminiscence images for G1 for some mice are shown in panel A. Total tumour mass growth curves for G1 showed superlinear dynamics with best fitting exponent $\beta$ = 1.25 (for G2 it was $\beta$ = 1.3). (B, upper panel). Errors relative to best fit were found to be substantially smaller with the optimal superlinear fits than for both the linear and sublinear fits (exponents 1 and 0.75 respectively) (B, lower panel).
Figure 1
Figure 1. A superlinear scaling law governs glucose uptake and proliferation in human cancers
Log-log plots of 18F-FDG uptake (TLA) versus metabolic tumour volume on diagnostic PET for breast cancer, head & neck cancer, non-small-cell lung cancer and rectal cancer display superlinear (β > 1) allometric scaling laws. Diagnostic PET with proliferation radiotracers, either 18F-FLT for breast cancer or 18F-FCHOL for glioma, shows the same dependence pointing to the use of glucose mostly as a resource for biosynthesis. The fitted exponents cluster around β = 5/4. Joint records of patients imaged in the same institution with identical protocol (breast-FDG, lung and rectal cancers), show that a common scaling law governs the dynamics. Error bars in (g) correspond to the standard error in the fitted parameter β obtained using fitlm.
Figure 2
Figure 2. Explosive longitudinal volumetric dynamics of untreated malignant human tumours
Longitudinal volumetric data for cancer patients with untreated brain metastases (BM), low grade gliomas (LGG), non-small-cell lung carcinomas (NSCLC), atypical meningiomas (AM) and lung hamartomas (LH). Solid curves show the fits with the optimal exponents (values provided in each subplot) giving the smallest mean square errors. The longitudinal 3D reconstruction of a BM and representative axial slices highlighting tumour location at three time points are displayed in the left panel together with the fitting curves obtained for different exponents. Mean square errors (MSE) for the five datasets and exponents 3/4, 1, 5/4 (taken as a reference) in comparison with the optimal exponent, are depicted in the lower right subplot.
Figure 3
Figure 3. Stochastic mesoscale models with evolutionary dynamics lead to superlinear scaling laws in silico.
a, Schematic representation of the evolutionary dynamics included in the mesoscale tumour growth simulator model. Random time-local discrete events accounting for either mutations and/or phenotypic changes provide a competitive advantage to newly arising subpopulations. b, When a single tumour population is present, it grows continuously and displays a sublinear scaling law (blue line). In contrast, the evolutionary dynamics of a heterogeneous tumour (here consisting of four subpopulations, see SI section S3) yielded superlinear growth dynamics (red line). c, Isosurfaces of four interacting cell subpopulations at different points in time showing the dynamics of dominance by the most aggressive cells (higher indices correspond to more aggressive clones as described by the model parameters).
Figure 4
Figure 4. Scaling laws allow for cancer patient classification into prognostic groups
Patient tumours were classified as hyperactive (TLA > aV5/4; DSL > 0) or hypoactive (TLA < αV5/4; DSL < 0) using the metabolic scaling law as a reference. Survival differences between groups were compared using Kaplan-Meier analysis and the c-index. Shown are Kaplan-Meier survival curves and the best c-index values obtained for: (a) Gliomas (p =0.001, c-index = 0.832, α = -0.24867). (b) Head and Neck cancer (p =0.05, c-index = 1.0, a = -0.0041776). (c) Stage III and IV resectable lung cancer patients (p=0.09, c-index = 0.742, α = -0.40334). (d) Breast cancer (p =0.019, c-index = 0.849, α =-0.65034).

References

    1. Kleiber M. Body size and metabolism. Hilgardia. 1932;6:315–351.
    1. West G. Scale: The Universal Laws of Growth InnovationSustainabilityand the Pace of Life in OrganismsCitiesEconomies and Companies. Penguin Press; New York: 2017.
    1. West GB, Brown JH, Enquist BJ. A general model for the origin of allometric scaling laws in biology. Science. 1997;276:122–126. - PubMed
    1. Savage VM, et al. The predominance of quarter-power scaling in biology. Funct Ecol. 2004;18:257–282.
    1. Reich PB, Tjoelker MG, Machado JL, Oleksyn J. Universal scaling of respiratory metabolismsize and nitrogen in plants. Nature. 2006;439:457–461. - PubMed