. 2020 Nov 24:8:586179.
doi: 10.3389/fcell.2020.586179. eCollection 2020.

NAD+ Metabolism Regulates Preadipocyte Differentiation by Enhancing α-Ketoglutarate-Mediated Histone H3K9 Demethylation at the PPARγ Promoter

Affiliations

NAD+ Metabolism Regulates Preadipocyte Differentiation by Enhancing α-Ketoglutarate-Mediated Histone H3K9 Demethylation at the PPARγ Promoter

Keisuke Okabe et al. Front Cell Dev Biol. .

Abstract

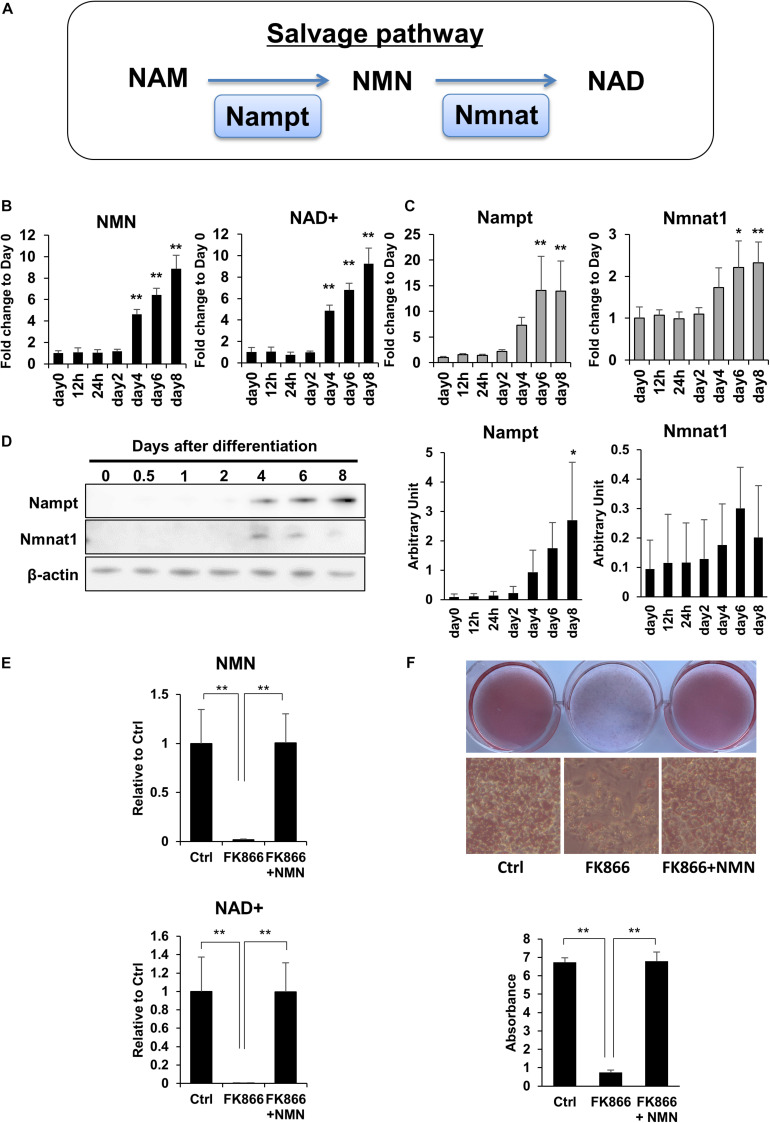
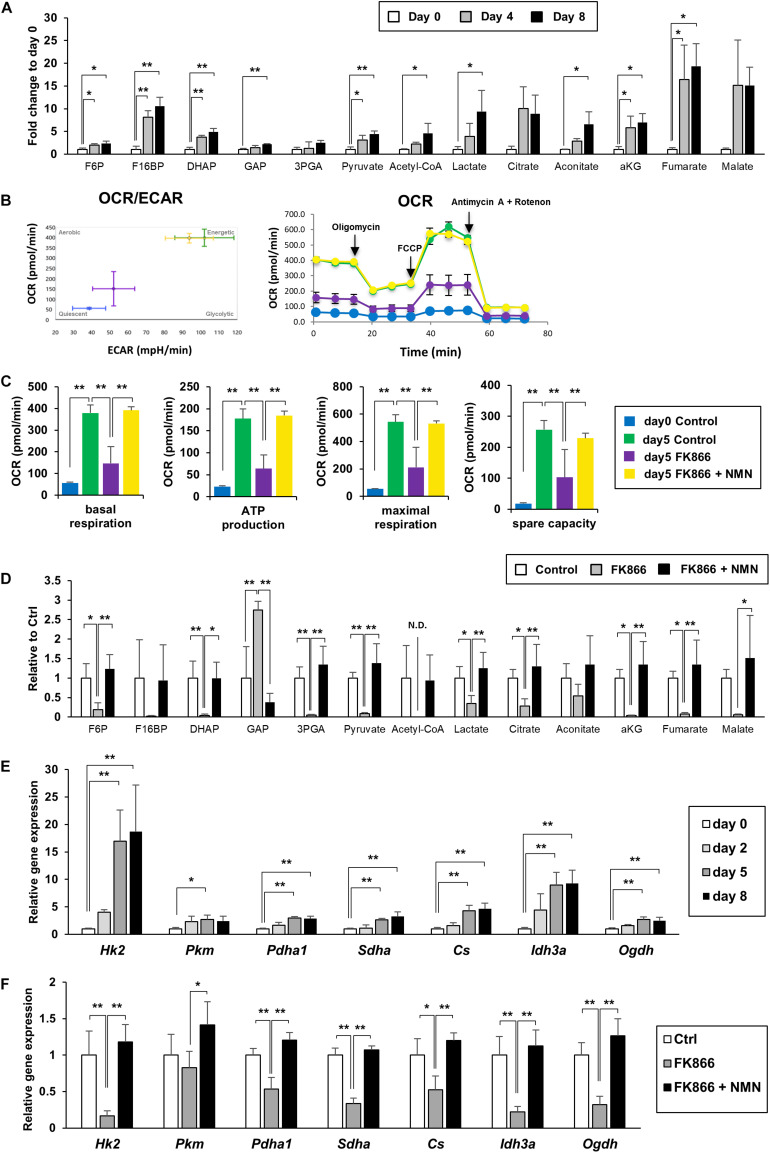
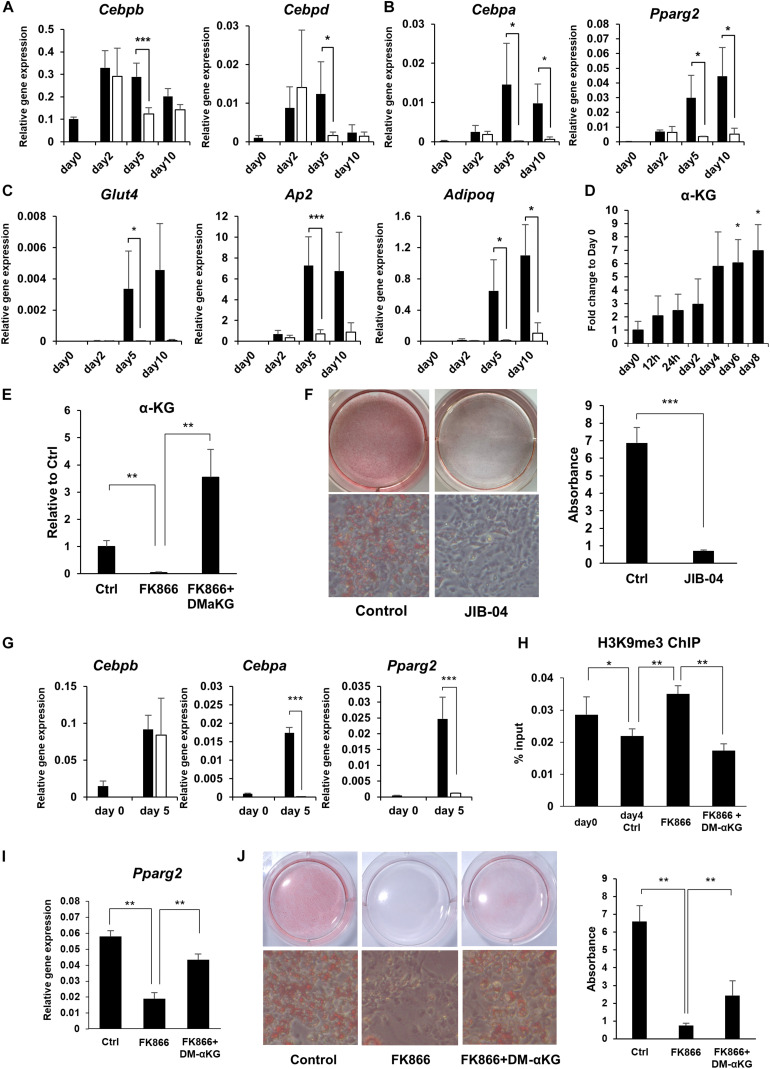
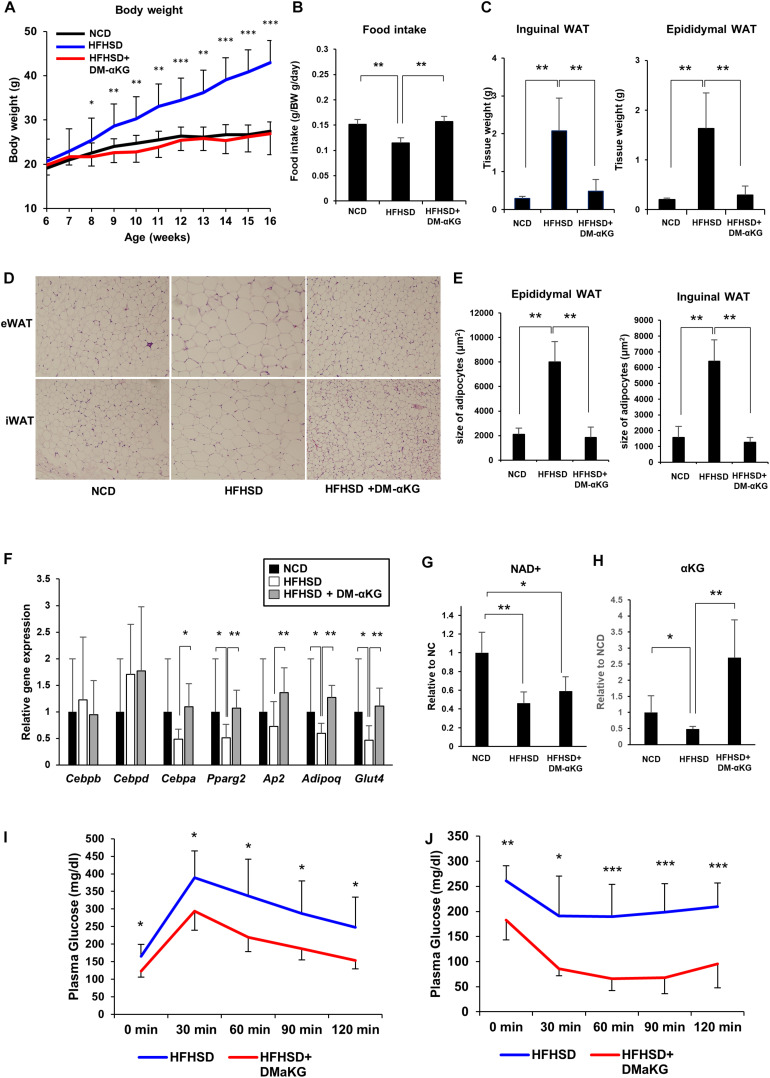
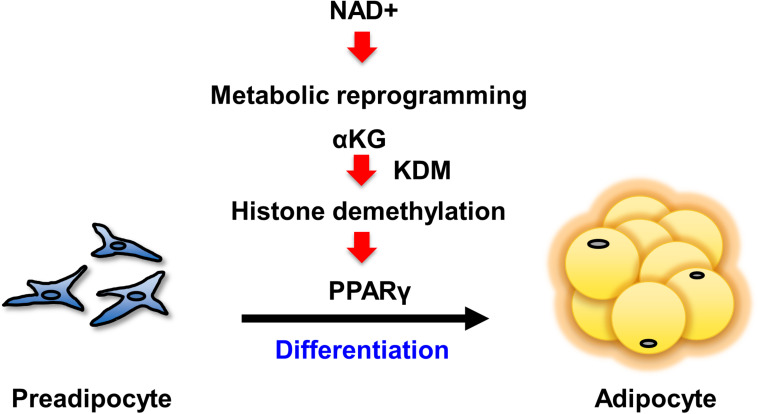
Obesity has become a serious problem in public health worldwide, causing numerous metabolic diseases. Once the differentiation to mature adipocytes is disrupted, adipocyte hypertrophy and ectopic lipid accumulation leads to the inflammation in adipose tissue and systemic metabolic disorders. Intracellular metabolic state is known to change during cell differentiation and it affects the cell fate or the differentiation through epigenetic mechanism. Although the mechanism of preadipocyte differentiation has been well established, it is unknown how metabolic state changes and how it affects the differentiation in predipocyte differentiation. Nicotinamide adenine dinucleotide (NAD+) plays crucial roles in energy metabolism as a coenzyme in multiple redox reactions in major catabolic pathways and as a substrate of sirtuins or poly(ADP-ribose)polymerases. NAD+ is mainly synthesized from salvage pathway mediated by two enzymes, Nampt and Nmnat. The manipulation to NAD+ metabolism causes metabolic change in each tissue and changes in systemic metabolism. However, the role of NAD+ and Nampt in adipocyte differentiation remains unknown. In this study, we employed liquid chromatography-mass spectrometry (LC-MS)- and gas chromatography-mass spectrometry (GC-MS)-based targeted metabolomics to elucidate the metabolic reprogramming events that occur during 3T3-L1 preadipocyte differentiation. We found that the tricarboxylic acid (TCA) cycle was enhanced, which correlated with upregulated NAD+ synthesis. Additionally, increased alpha-ketoglutarate (αKG) contributed to histone H3K9 demethylation in the promoter region of PPARγ, leading to its transcriptional activation. Thus, we concluded that NAD+-centered metabolic reprogramming is necessary for the differentiation of 3T3-L1 preadipocytes.

Keywords: NAD+; adipocyte; alpha-ketoglutarate; demethylation; differentiation; metabolomics; nampt; preadipocyte.


Figures

FIGURE 1
FIGURE 1
Upregulation of NAD+ biosynthesis in the salvage pathway is required for 3T3-L1 preadipocyte differentiation. (A) Schematic of NAD synthesis in the salvage pathway. (B) Intracellular levels of NMN and NAD+ were measured with LC-MS during the differentiation of 3T3-L1 cells (n = 3). Data are represented as mean ± SD. (C) Relative expression levels of enzymes in the NAD+ synthetic pathway during the differentiation of 3T3-L1 cells (n = 3). Data are represented as mean ± SD. (D) Western blotting for enzymes in the NAD+ synthetic pathway during the differentiation of 3T3-L1 cells. The representative image from three independent experiments. The signals of Nampt and Nmnat1 were quantified and adjusted with those of β-actin (n = 3). (E) 3T3-L1 cells were treated with 100 nM FK866 or 100 nM FK866 and 100 μM NMN during differentiation. Intracellular levels of NMN and NAD+ were measured on day 4 after inducing differentiation (n = 4). Data are represented as mean ± SD. (F) Oil Red-O staining of differentiated 3T3-L1 cells treated with 100 nM FK866 or 100 nM FK866 and 100 μM NMN on day 8 after inducing differentiation. The lipid accumulation was quantified as absorbance. (n = 4) Ctrl represents control. *p < 0.05, **p < 0.01.
FIGURE 2
FIGURE 2
Upregulation of NAD+ synthesis promotes energy metabolism during 3T3-L1 preadipocyte differentiation. (A) Metabolites of glycolysis and the TCA cycle in 3T3-L1 cells were measured with LC-MS or GC-MS during the differentiation (n = 3). Data are represented as mean ± SD. Each abbreviation represents as follows, F6P: Fructose 6-phosphate, F16BP: Fructose 1,6-bisphosphate, DHAP: Dihydroxyacetone phosphate, GAP: Glyceraldehyde 3-phosphate, 3PGA: 3-phosphoglycerate, aKG: alpha-ketoglutarate. (B,C) Oxygen comsumption rate (OCR) and extracellular acidification rate (ECAR) were measured with flux analyzer on day 5 during the differentiation of 3T3-L1 cells treated with 100 nM FK866 or 100 nM FK866 and 100 μM NMN (B). Basal respiration, ATP production, maximal respiration, and spare capacity were calcurated from the difference of OCR, injecting Oligomycin, FCCP, and Antimycin A + Rotenon (C). (n = 6) Data are represented as mean ± SD. (D) Metabolites of glycolysis and the TCA cycle on day 4 during the differentiation of 3T3-L1 cells treated with 100 nM FK866 (n = 4) or 100 nM FK866 and 100 μM NMN. Data are represented as mean ± SD. (E) Relative expression levels of enzymes in glycolysis and the TCA cycle during the differentiation of 3T3-L1 cells. (n = 4) Data are represented as mean ± SD. (F) Relative expression levels of enzymes in glycolysis and the TCA cycle on day 5 of the differentiation of 3T3-L1 cells treated with 100 nM FK866 or 100 nM FK866 and 100 μM NMN (n = 4). Data are represented as mean ± SD. *p < 0.05, **p < 0.01.
FIGURE 3
FIGURE 3
NAD+ biosynthesis in the salvage pathway regulates adipogenic gene expression. (A–C) Relative expression levels of genes related to adipogenesis during the differentiation of 3T3-L1 cells treated with 100 nM FK866 (n = 3). Data are represented as mean ± SD. The black bars represent control and the white bars represent FK866. (D) α-KG levels during the differentiation of 3T3-L1 cells measured with GC-MS (n = 3). Data are represented as mean ± SD. (E) α-KG levels on day 5 of differentiation of 3T3-L1 cells treated with 100 nM FK866 or 100 nM FK866 and 5 mM dimethyl alpha-ketoglutarate (DM-αKG) (n = 4). Data are represented as mean ± SD. (F) 3T3-L1 cells treated with JIB-04 were stained with Oil Red-O on day 8 of differentiation. The lipid accumulation was quantified as absorbance. (n = 5) Data are represented as mean ± SD. (G) Relative gene expression levels of 3T3-L1 cells treated with JIB-04 during differentiation (n = 4). Data are represented as mean ± SD. The black bars represent control and the white bars represent JIB-04. (H) H3K9me3 in the promoter region of Pparg was measured with ChIP-qPCR on day 4 during the differentiation of 3T3-L1 cells treated with 100 nM FK866 or 100 nM FK866 and 5 mM DM-αKG (n = 5). Data are represented as mean ± SD. (I) Relative gene expression levels of 3T3-L1 cells treated with 100 nM FK866 or 100 nM FK866, and 5 mM DM-αKG on day 4 of differentiation (n = 5). Data are represented as mean ± SD. (J) Oil Red-O staining of 3T3-L1 cells treated with 100 nM FK866 or with 100 nM FK866 and 5 mM DM-αKG on day 8 of differentiation. The lipid accumulation was quantified as absorbance. (n = 4). Ctrl represents control. *p < 0.05, **p < 0.01, ***p < 0.005.
FIGURE 4
FIGURE 4
DM-αKG supplementation prevents diet-induced obesity in mice by promoting appropriate adipogenesis. (A) Body weight of C57BL/6J mice fed a normal chow diet (NCD) or high fat high sucrose diet (HFHSD) (n = 4–6). 1.5% dimethyl α-ketoglutarate (DM-αKG) was supplemented in the drinking water. Data are represented as mean ± SD. (B) The average of food intake of each group was measured weekly for the first 4 weeks and was adjusted by body weight. Data are represented as mean ± SD. (n = 4). (C) The weight of white adipose tissue was measured at 16 weeks of age. Data are represented as mean ± SD. (n = 4–6). (D) Representative images of paraffin sections of white adipose tissue at 16 weeks old stained with hematoxylin and eosin (H&E). Images were acquired with an Olympus BX61, 10×. (n = 2). (E) Adipocyte size in H&E stained samples was calculated using ImageJ. (n = 8) Data are represented as mean ± SD. (F) Relative expression levels of genes related to adipogenesis in epididymal white adipose tissue (eWAT) at 16 weeks old (n = 6). Data are represented as mean ± SD. (G) The level of NAD+ in eWAT of wild type mice fed NCD, HFHSD, or HFHSD with DM-αKG were measured after 10 weeks of HFHSD with LC-MS. Data are represented as mean ± SD. (n = 4). (H) The level of α-KG in blood plasma of wild type mice fed NCD, HFHSD, or HFHSD with DM-αKG were measured after 10 weeks of HFHSD with GC-MS. Data are represented as mean ± SD. (n = 4). (I), (J) The plasma glucose level in intraperitoneal glucose tolerance test after 10 weeks of HFHSD (I) and in intraperitoneal insulin tolerance test after 16 weeks of HFHSD (J). Data are represented as mean ± SD (n = 5–6). *p < 0.05, **p < 0.01, ***p < 0.005.
FIGURE 5
FIGURE 5
Scheme of the mechanism by which NAD+ metabolism regulates preadipocyte differentiation through epigenetics.

References

    1. Asadi Shahmirzadi A., Edgar D., Liao C. Y., Hsu Y. M., Lucanic M., Asadi Shahmirzadi A., et al. (2020). Alpha-ketoglutarate, an endogenous metabolite, extends lifespan and compresses morbidity in aging mice. Cell Metab. 32 447.e6–456.e6. - PMC - PubMed
    1. Bai P., Houten S. M., Huber A., Schreiber V., Watanabe M., Kiss B., et al. (2007). Poly(ADP-ribose) polymerase-2 [corrected] controls adipocyte differentiation and adipose tissue function through the regulation of the activity of the retinoid X receptor/peroxisome proliferator-activated receptor-gamma [corrected] heterodimer. J. Biol. Chem. 282 37738–37746. 10.1074/jbc.m701021200 - DOI - PubMed
    1. Carey B. W., Finley L. W., Cross J. R., Allis C. D., Thompson C. B. (2015). Intracellular α-ketoglutarate maintains the pluripotency of embryonic stem cells. Nature 518 413–416. 10.1038/nature13981 - DOI - PMC - PubMed
    1. Chen D., Bruno J., Easlon E., Lin S. J., Cheng H. L., Alt F. W., et al. (2008). Tissue-specific regulation of SIRT1 by calorie restriction. Genes Dev. 22 1753–1757. 10.1101/gad.1650608 - DOI - PMC - PubMed
    1. Chen Q., Hao W., Xiao C., Wang R., Xu X., Lu H., et al. (2017). SIRT6 is essential for adipocyte differentiation by regulating mitotic clonal expansion. Cell. Rep. 18 3155–3166. 10.1016/j.celrep.2017.03.006 - DOI - PMC - PubMed