. 2020 Nov 24:7:605088.
doi: 10.3389/fmed.2020.605088. eCollection 2020.

Fibrotic Changes Depicted by Thin-Section CT in Patients With COVID-19 at the Early Recovery Stage: Preliminary Experience

Affiliations

Fibrotic Changes Depicted by Thin-Section CT in Patients With COVID-19 at the Early Recovery Stage: Preliminary Experience

Zhen Lu Yang et al. Front Med (Lausanne). .

Abstract

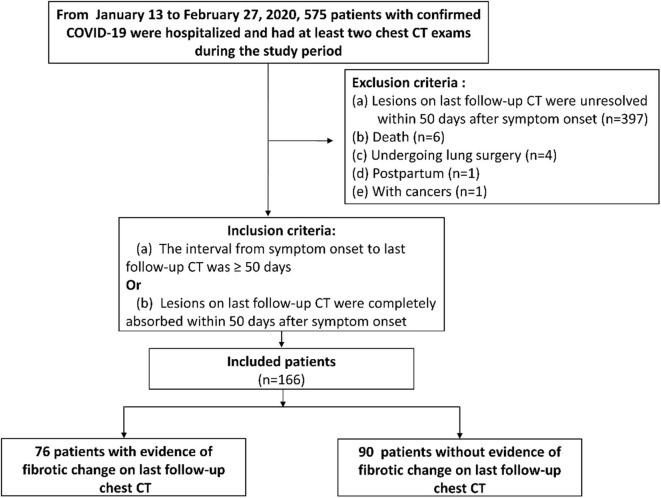
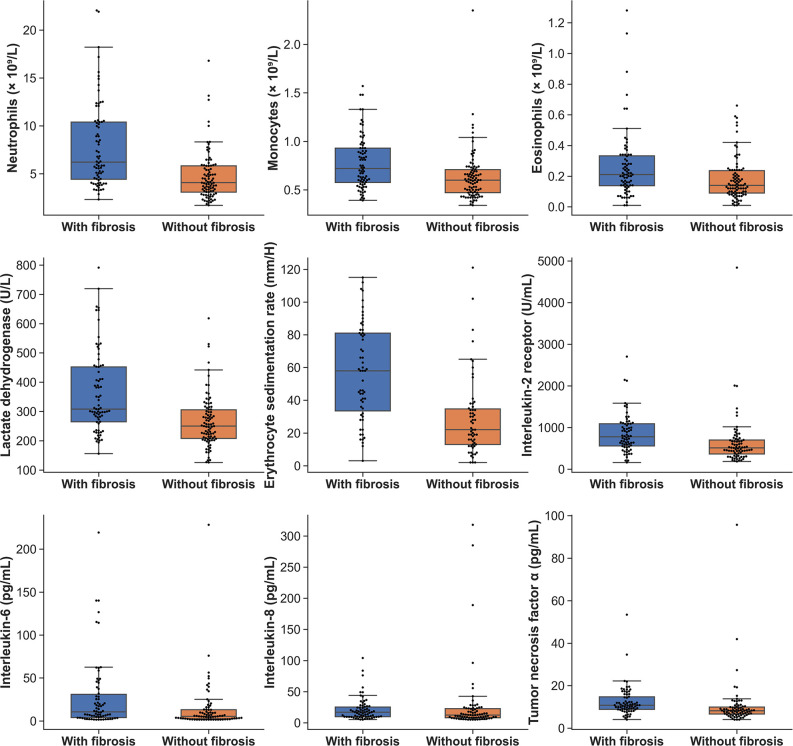
Objectives: To analyze follow-up CTs of patients recovering from COVID-19 in Wuhan, focusing on fibrotic change and its relevant risk factors. Methods: From January 13 to February 27, 2020, 166 hospitalized patients meeting our criteria were included. The scores of fibrotic patterns on follow-up CT were evaluated. Patients were designated as group 1 (with CT evidence of fibrotic pattern) and group 2 (without CT evidence of fibrotic pattern). Multivariate logistic regression was performed to explore risk factors for fibrotic change in patients with COVID-19. Results: The follow-up CTs were obtained on 56 days (median, IQR 51-63 days) after symptom onset. Of the 166 patients (mean age, 57 ± 15 years; 69/166 male), 46% (76/166) had CT evidence of fibrotic change and 77% (127/166) were severe or critical cases. Among patients with fibrotic change on CT, 84% (64/76) got a minimal or mild score of fibrosis. The high total score on peak CT, peak eosinophils, erythrocyte sedimentation rate (ESR) and advancing age were related to lung fibrotic change in patients with COVID-19. Conclusion: Forty six percentages of patients (mainly severe or critical cases) with COVID-19 showed fibrotic change on follow-up CT at early recovery phase, while the extent of fibrosis was not large. The advancing age, high total score on peak CT, peak eosinophils and ESR were associated with fibrotic change depicted by CT in patients recovering from COVID-19. An extended follow up by CT imaging and pulmonary function testing is necessary to fully assess the sequela of COVID-19.

Keywords: chest CT imaging; coronavirus disease 2019 (COVID- 19); fibrotic change; follow-up; risk factors.


Figures

Figure 1
Figure 1
The flowchart of this study. COVID-19, coronavirus disease 2019.
Figure 2
Figure 2
The boxplots of laboratory parameters of patients in the two groups.
Figure 3
Figure 3
Series of follow-up CTs of a 40-year-old woman with COVID-19 who caught a fever on January 19, 2020 and was admitted at hospital on January 27, 2020. (A) Initial chest CT on January 22 (3 days after symptoms onset) showed sporadic GGO in bilateral lower lobes. (B–E) Two days later, consolidation appeared. Whereafter, the extent of GGO and consolidation enlarged, and reached its peak on February 11, and remained the peak level until February 20. (F,G) At the recovery stage, lesions were gradually absorbed. (H) On May 14 (116 days after symptoms onset), most consolidations were absorbed, while irregular interfaces and parenchymal bands were observed as evidence of fibrotic change (yellow arrow). COVID-19, coronavirus disease 2019; GGO, ground-glass opacity.
Figure 4
Figure 4
A 68-year-old man who caught a fever and cough on January 17, 2020. (A,B) Axial and sagittal CT (Min IP) performed on February 18 (peak CT, 32 days after symptoms onset) showed GGO, reticulation (yellow arrow in A) and bronchial distortion (yellow arrow in B) in the bilateral lungs. (C,D) Axial and sagittal CT (Min IP) performed on March 12 (last follow-up CT, 55 days after symptoms onset) showed residual GGO, while previous reticulation and distortion disappeared. Min IP, minimum intensity projection; COVID-19, coronavirus disease 2019; GGO, ground-glass opacity.
Figure 5
Figure 5
A 29-year-old man who caught a fever on January 23, 2020, received three follow-up scans after the initial chest CT. (A) Initial CT performed on January 23 (the day of symptoms onset) showed patchy GGO in the left lower lobe. (B) Chest CT performed on February 3 showed consolidation, GGO and strip-like lesions (easily misdiagnosed as fibrosis) in the bilateral lower lobes (yellow arrow). (C) Chest CT performed on February 9 showed strip-like lesions disappeared, and multiple GGO and consolidation presented in the bilateral lower lobes. (D) On April 28 (116 days after symptoms onset), CT image showed that all lesions were absorbed. COVID-19, coronavirus disease 2019; GGO, ground-glass opacity.

References

    1. Zhu N, Zhang D, Wang W, Li X, Yang B, Song J, et al. . A novel coronavirus from patients with pneumonia in China, 2019. N Engl J Med. (2020) 382:727–33. 10.1056/NEJMoa2001017 - DOI - PMC - PubMed
    1. Dong D, Tang Z, Wang S, Hui H, Gong L, Lu Y, et al. . The role of imaging in the detection and management of COVID-19: a review. IEEE Rev Biomed Eng. (2020). 10.1109/RBME.2020.2990959. [Epub ahead of print]. - DOI - PubMed
    1. Simpson S, Kay FU, Abbara S, Bhalla S, Chung JH, Chung M, et al. Radiological society of North America expert consensus statement on reporting chest CT findings related to COVID-19. Endorsed by the Society of Thoracic Radiology, the American College of Radiology, and RSNA. J Thorac Imaging. (2020) 2:e200152 10.1148/ryct.2020200152 - DOI - PMC - PubMed
    1. Yang X, Yu Y, Xu J, Shu H, Xia J, Liu H, et al. . Clinical course and outcomes of critically ill patients with SARS-CoV-2 pneumonia in Wuhan, China: a single-centered, retrospective, observational study. Lancet Respir Med. (2020) 8:475–81. 10.1016/S2213-2600(20)30079-5 - DOI - PMC - PubMed
    1. World Health Organization Available online at: https://covid19.who.int/ (accessed May 14, 2020).