Review
. 2020 Nov 23:7:587100.
doi: 10.3389/fcvm.2020.587100. eCollection 2020.

Intravascular Molecular Imaging: Near-Infrared Fluorescence as a New Frontier

Affiliations
Review

Intravascular Molecular Imaging: Near-Infrared Fluorescence as a New Frontier

Haitham Khraishah et al. Front Cardiovasc Med. .

Abstract

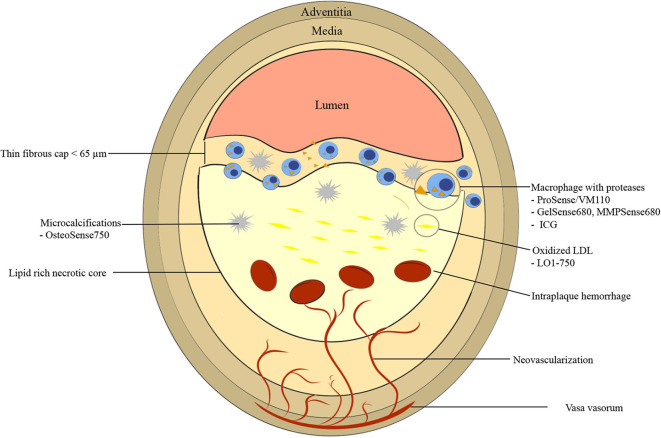
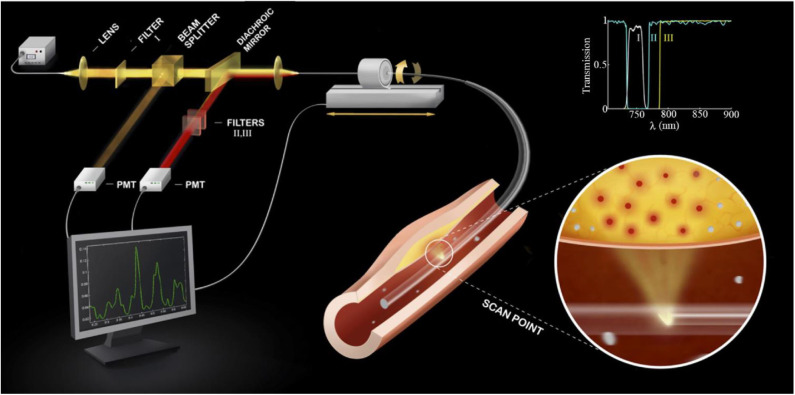
Despite exciting advances in structural intravascular imaging [intravascular ultrasound (IVUS) and optical coherence tomography (OCT)] that have enabled partial assessment of atheroma burden and high-risk features associated with acute coronary syndromes, structural-based imaging modalities alone do not comprehensively phenotype the complex pathobiology of atherosclerosis. Near-infrared fluorescence (NIRF) is an emerging molecular intravascular imaging modality that allows for in vivo visualization of pathobiological and cellular processes at atheroma plaque level, including inflammation, oxidative stress, and abnormal endothelial permeability. Established intravascular NIRF imaging targets include macrophages, cathepsin protease activity, oxidized low-density lipoprotein and abnormal endothelial permeability. Structural and molecular intravascular imaging provide complementary information about plaque microstructure and biology. For this reason, integrated hybrid catheters that combine NIRF-IVUS or NIRF-OCT have been developed to allow co-registration of morphological and molecular processes with a single pullback, as performed for standalone IVUS or OCT. NIRF imaging is approaching application in clinical practice. This will be accelerated by the use of FDA-approved indocyanine green (ICG), which illuminates lipid- and macrophage-rich zones of permeable atheroma. The ability to comprehensively phenotype coronary pathobiology in patients will enable a deeper understanding of plaque pathobiology, improve local and patient-based risk prediction, and usher in a new era of personalized therapy.

Keywords: atherosclerotic cardiovascular disease; intravascular imaging; molecular imaging; near-infrared fluorescence (NIRF); optical coherence tomography.


Figures

Figure 1
Figure 1
Graphic representation of vulnerable plaque characteristics with emphasis on near-infrared fluorescence (NIRF) molecular imaging targets. High risk features include thin fibrous cap <65 μm, fibrous cap and necrotic core macrophages, large necrotic core, microcalcifications, neovascularization, and intraplaque hemorrhage. ICG, indocyanine green.
Figure 2
Figure 2
Diagram of a first-generation standalone 2D NIRF Imaging System. The tip of the probe contains a right angle coated prism that focuses laser light into the artery wall, activating fluorophores to their excited state to allow fluorescence emission. Subsequently, fluorophores will emit longer wavelength (lower energy) fluorescent light back into the optical fiber. The fluorescent light is then directed to a dichroic beam splitter that selectively directs it into a photomultiplier tube. The beam passes additional filters to minimize the parasitic signals of laser photons and autofluorescence. The inset shows the spectra of the three filters (I, II, III) used in the system. 2D, 2-dimensional; NIRF, near-infrared fluorescence. Jaffer et al. (13), by permission of American College of Cardiology. License number: 4720261188070.
Figure 3
Figure 3
Experimental in vivo and ex vivo near-infrared fluorescence (NIRF) imaging of inflammation and subsequent atherothrombosis. Rabbits underwent balloon injury at week 2, and were fed high cholesterol diet till week 8. Ten weeks after balloon injury, rabbits received CLIO-CyAm7 (a inflammation-sensitive nanoparticle-based fluorophore), and underwent pharmacologic-triggered plaque thrombosis 24 h later. (A) Pre-trigger x-ray angiography showing the aorta for image coregistration. (B) Pre-trigger in vivo NIRF imaging projected into a 2-dimensional (2D) matrix showing an area of increased signal between 30 and 40 mm. (C,D) Pre- and post-trigger intravascular ultrasound (IVUS) imaging demonistrating induced luminal thrombus (yellow arrows) corresponding to the region of increased NIRF signal intensity on pretrigger NIRF imaging in (B). (E,F) Ex vivo fluorescence reflectance imaging of cross-linked iron oxide (CLIO)-CyAm7 verifying in vivo 2D NIRF imaging, and gross pathology of the resected aorta with 1.5 cm black tissue markings for histological analysis and coregistration. (G) Histogram of vessel diameter measured by cross-sectional IVUS imaging. Red indicates atheroma without attached thrombus, yellow indicates atheroma with attached thrombus, and blue indicates uninjured control aortic segments. The dashed line indicates the 5 mm cut-off for exclusion of NIRF imaging data because of distance attenuation of the NIRF signal in large vessels. (H) In vivo 2D NIRF imaging revealed significantly higher target/background ratio (TBR) in areas with atheroma, compared with uninjured segments of the aorta (peak TBR 2.86 ± 1.82 and 1.55 ± 0.65, *P = 0.001). Stein-Merlob et al. (55), by permission of American Heart Asssociation (AHA). License number: 4720560395030.
Figure 4
Figure 4
Dual modality NIRF-OCT along separate IVUS images, obtained at weeks 8 and 12 following balloon injury in rabbit aorta. ProSenseVM110 is the fluorophore used to acquire NIRF imaging. (A) Longitudinal rabbit aorta sections. To the left, co-registered OCT-NIRF images and to the right corresponding IVUS images. (B) Cross sections of rabbit aortas corresponding to white dotted line in (A). From left to right: cross-sectional co-registration of NIRF-OCT images (Green/white = high near-infrared fluorescence; blue/black = low near-infrared fluorescence), matched cross-sectional fluorescence microscopy (FM) (red = ProSense VM110; green = autofluorescence) and histopathological sections reveals increased ProSense VM110 NIRF signal within a moderate fibrofatty atheroma (H&E) associated with cathepsin B immunostain. Scale bars, 1 mm. Figure courtesy of Dr. Eric Osborn and Dr. Giovanni Ughi. Bourantas et al. (67), by permission of European Society of Cardiology. License Number: 4720391246688.
Figure 5
Figure 5
Ex-vivo intravascular NIRF-OCT images of human carotid arteries following ICG injection and then endartectomy. ICG was injected into human subjects 99 min prior to endartectomy. ICG accumulates in atherosclerotic area especially endothelial discontinuation. (A) Corresponding gross internal carotid artery (ICA) specimen, along with corresponding fluorescence reflectance image (FRI), and NIRF-OCT cross sectional, coregistered images, illustrating similar ICG uptake pattern (light blue = low ICG signal; green-yellow = high ICG signal) at the stenotic region (white arrowheads) in the ICA. (B) Histological analysis of the same area of the NIRF-OCT cross-sectional image shown in (A). Movat pentachrome (MP) shows a complex atherosclerotic plaque with a large necrotic core with lipid and cellular infiltration (dotted box). Higher magnification (10×) fluorescence microscopy of the boxed area illustrates ICG NIRF signal adjacent to the lumen, which is distinct from fluorescein isothiocyanate (FITC)-channel autofluorescence. CD68 staining of the same area validates that the ICG NIRF signal (yellow pseudocolor) spatially relates to CD68-defined plaque macrophages beneath the area of intimal disruption. The disruption is confirmed by CD31 staining in this same area. ECA, external carotid artery. Verjans et al. (81), by permission of American College of Cardiology (ACC). License number: 4720551416574.
Figure 6
Figure 6
NIRF molecular imaging of stent suppresion of plaque inflammation. In vivo and ex vivo imaging of rabbit aorta demonestrating inflammatory protease activity in bare metal stent (BMS)-, everolimus-eluting stent (EES)-treated, and unstented plaque zones. (A) Angiogram of the abdominal aorta, showing positions of BMS and EES. Areas of IVUS–visible plaque areas (P1 and P2 zones) are highlighted. (B) In vivo NIRF imaging, demonestrating increased signal intensity in areas corresponding to BMS. The y-axis represents the angular dimension (0–360°). The x-axis represents the longitudinal/axial dimension in millimeters. The asterisk denotes a guidewire artifact. (C) Averaged mean NIRF signal (unidimentional) along the longitudinal axis. NIRF signal is higher in unstented regions > BMS regions > EES regions (D) Co-reistered longitudinal IVUS and intravascular NIRF images. (E) Ex vivo FRI at 800 nm of the resected aorta, demonestrating higher signal in BMS region, compared to EES region. AU, arbitrary units; Scale bar, 10 mm. Calfon Press et al. (12), by permission of European Society of Cardiology. License number: 4720551036244.

References

    1. Muller JE, Tofler GH, Stone PH. Circadian variation and triggers of onset of acute cardiovascular disease. Circulation. (1989) 79:733–43. 10.1161/01.CIR.79.4.733 - DOI - PubMed
    1. Schaar JA, Muller JE, Falk E, Virmani R, Fuster V, Serruys PW, et al. . Terminology for high-risk and vulnerable coronary artery plaques. Report of a meeting on the vulnerable plaque, June 17 and 18, 2003, Santorini, Greece. Eur Heart J. (2004) 25:1077–82. 10.1016/j.ehj.2004.01.002 - DOI - PubMed
    1. Narula J, Nakano M, Virmani R, Kolodgie FD, Petersen R, Newcomb R, et al. . Histopathologic characteristics of atherosclerotic coronary disease and implications of the findings for the invasive and noninvasive detection of vulnerable plaques. J Am Coll Cardiol. (2013) 61:1041–51. 10.1016/j.jacc.2012.10.054 - DOI - PMC - PubMed
    1. Burke AP, Farb A, Malcom GT, Liang YH, Smialek J, Virmani R. Coronary risk factors and plaque morphology in men with coronary disease who died suddenly. N Engl J Med. (1997) 336:1276–82. 10.1056/NEJM199705013361802 - DOI - PubMed
    1. van der Wal AC, Becker AE, van der Loos CM, Das PK. Site of intimal rupture or erosion of thrombosed coronary atherosclerotic plaques is characterized by an inflammatory process irrespective of the dominant plaque morphology. Circulation. (1994) 89:36–44. 10.1161/01.CIR.89.1.36 - DOI - PubMed

LinkOut - more resources