[Preprint]. 2021 Jan 8:2020.09.08.20190629.
doi: 10.1101/2020.09.08.20190629.

Model-informed COVID-19 vaccine prioritization strategies by age and serostatus

Affiliations

Model-informed COVID-19 vaccine prioritization strategies by age and serostatus

Kate M Bubar et al. medRxiv. .

Update in

Abstract

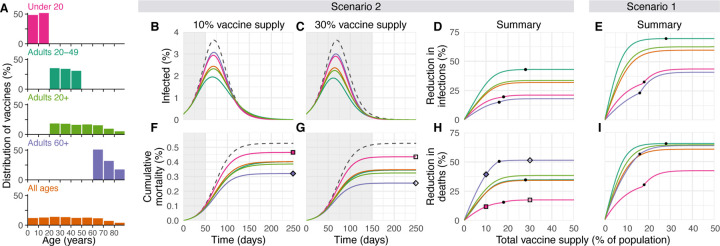
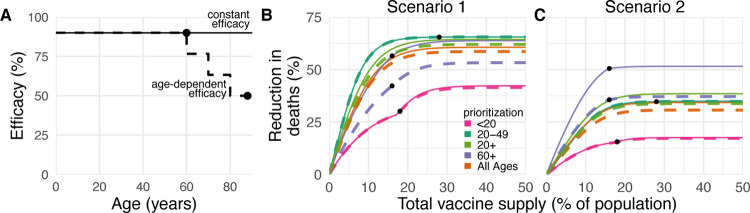
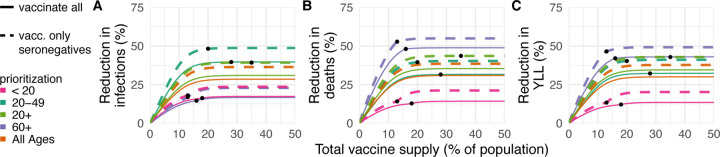
Limited initial supply of SARS-CoV-2 vaccine raises the question of how to prioritize available doses. Here, we used a mathematical model to compare five age-stratified prioritization strategies. A highly effective transmission-blocking vaccine prioritized to adults ages 20-49 years minimized cumulative incidence, but mortality and years of life lost were minimized in most scenarios when the vaccine was prioritized to adults over 60 years old. Use of individual-level serological tests to redirect doses to seronegative individuals improved the marginal impact of each dose while potentially reducing existing inequities in COVID-19 impact. While maximum impact prioritization strategies were broadly consistent across countries, transmission rates, vaccination rollout speeds, and estimates of naturally acquired immunity, this framework can be used to compare impacts of prioritization strategies across contexts.


Conflict of interest statement

Competing Interests: ML discloses honoraria/consulting from Merck, Affinivax, Sanofi-Pasteur, Bristol Myers Squibb, and Antigen Discovery; research funding (institutional) from Pfizer; an unpaid scientific advice to Janssen, Astra-Zeneca, and Covaxx (United Biomedical); and is an Honorary Faculty Member, Wellcome Sanger Institute, and an Associate Member, Broad Institute. YHG discloses consulting for Merck and GlaxoSmithKline, and research funding from Pfizer not related to this project or topic. DBL is a member of the scientific advisory board of Darwin BioSciences.

Figures

Figure 1:
Figure 1:. Impacts of vaccine prioritization strategies on mortality and infections.
(A) Distribution of vaccines for five prioritization strategies: under 20, adults 20–49, adults 20+, adults 60+ and all ages. (B, C) Example simulation curves show percentage of the total population infected over time and (F, G) cumulative mortality for no vaccines (grey dashed lines) and for five different prioritization strategies (colored lines matching panel A), with 10% (B, F) and 30% (C, G) vaccine supply. Summary curves show percent reductions in (D, E) infections and (H, I) deaths in comparison to an unmitigated outbreak for vaccine supplies between 1% and 50% after 365 days of simulation. Squares and diamonds show how the outputs from single simulations (F, G) correspond to points in summary curves (H). Grey shading indicates period during which vaccine is being rolled out at 0.2% of total population per day. Black dots indicate breakpoints at which prioritized demographic groups have been 70% vaccinated, after which vaccines are distributed without prioritization. These simulations assume contact patterns and demographics of the United States (22, 23) and an all-or-nothing, transmission-blocking vaccine with 90% vaccine efficacy and R0 = 1.5 (Scenario 2) and R0 = 1.15 (Scenario 1).
Figure 2:
Figure 2:. Mortality-minimizing vaccine prioritization strategies across reproductive numbers R0 and countries.
Heatmaps show the prioritization strategies resulting in maximum reduction of mortality for varying values of the basic reproductive number R0 (A, B) and across nine countries (C, D, E), for vaccine supplies between 1% and 50% of the total population, for an all-or-nothing and transmission blocking vaccine, 90% vaccine efficacy. (A, B) Shown: contact patterns and demographics of the United States (22,23); (C, D, E) Shown: contact patterns and demographics of POL, Poland; ZAF, South Africa; CHN, China; BRA, Brazil; ZWE, Zimbabwe; ESP, Spain; IND, India; USA, United States of America; BEL, Belgium, with R0 and rollout speeds as indicated.
Figure 3:
Figure 3:. Effects of age-dependent vaccine efficacy on the impacts of prioritization strategies.
(A) Diagram of hypothetical age-dependent vaccine efficacy shows decrease from 90% baseline efficacy to 50% efficacy among individuals 80+ beginning at age 60 (dashed line). (B, C) Percent reduction in deaths in comparison to an unmitigated outbreak for transmission-blocking all-or-nothing vaccines with either constant 90% efficacy for all age groups (solid lines) or age-dependent efficacy shown in panel A (dashed lines), covering Scenario 1 (0.2% rollout/day, R0 = 1.15; B) and Scenario 2 (0.2% rollout/day, R0 = 1.5; C). Black dots indicate breakpoints at which prioritized demographic groups have been 70% vaccinated, after which vaccines are distributed without prioritization. Shown: contact patterns and demographics of the United States (22,23); all-or nothing and transmission blocking vaccine.
Figure 4:
Figure 4:. Effects of existing seropositivity on the impacts of prioritization strategies.
Percent reductions in (A) infections, (B) deaths, and (C) years of life lost (YLL) for prioritization strategies when existing age-stratified seroprevalence is incorporated [August 2020 estimates for New York City; mean seroprevalence 26.9% (30)]. Plots show reductions for Scenario 2 (0.2% rollout/day, R = 1.5) when vaccines are given to all individuals (solid lines) or to only seronegatives (dashed lines), inclusive of 96% serotest sensitivity, 99% specificity (35), and approximately three months of seroreversion (32) (see Methods). Shown: U.S. contact patterns and demographics (22, 23); all-or-nothing and transmission-blocking vaccine with 90% vaccine efficacy. See Figs. S12 and S13 for lower and higher seroprevalence examples, respectively.

References

    1. COVID-19 Dashboard by the Center for Systems Science and Engineering at Johns Hopkins University. Online, 2020. (accessed January 4, 2021). https://coronavirus.jhu.edu/map.html.
    1. Khamsi Roxanne. If a coronavirus vaccines arrives, can the world make enough? Nature, 580(7805):578–580, April 2020. - PubMed
    1. Framework for equitable allocation of COVID-19 vaccine. Online, 2020. (accessed December 6, 2020). https://www.nap.edu/catalog/25917/framework-for-equitable-allocation-of-.... - PubMed
    1. Weycker Derek, Edelsberg John, Elizabeth Halloran M., Longini Ira M., Nizam Azhar, Ciuryla Vincent, and Oster Gerry. Population-wide benefits of routine vaccination of children against influenza. Vaccine, 23(10):1284 – 1293, 2005. - PubMed
    1. Medlock Jan and Galvani Alison P.. Optimizing influenza vaccine distribution. Science, 325(5948):1705–1708, September 2009. - PubMed

Publication types