[Preprint]. 2021 Feb 1:2020.12.10.20247205.
doi: 10.1101/2020.12.10.20247205.

Diverse Functional Autoantibodies in Patients with COVID-19

Affiliations

Diverse Functional Autoantibodies in Patients with COVID-19

Eric Y Wang et al. medRxiv. .

Update in

  • Diverse functional autoantibodies in patients with COVID-19.
    Wang EY, Mao T, Klein J, Dai Y, Huck JD, Jaycox JR, Liu F, Zhou T, Israelow B, Wong P, Coppi A, Lucas C, Silva J, Oh JE, Song E, Perotti ES, Zheng NS, Fischer S, Campbell M, Fournier JB, Wyllie AL, Vogels CBF, Ott IM, Kalinich CC, Petrone ME, Watkins AE; Yale IMPACT Team; Dela Cruz C, Farhadian SF, Schulz WL, Ma S, Grubaugh ND, Ko AI, Iwasaki A, Ring AM. Wang EY, et al. Nature. 2021 Jul;595(7866):283-288. doi: 10.1038/s41586-021-03631-y. Epub 2021 May 19. Nature. 2021. PMID: 34010947

Abstract

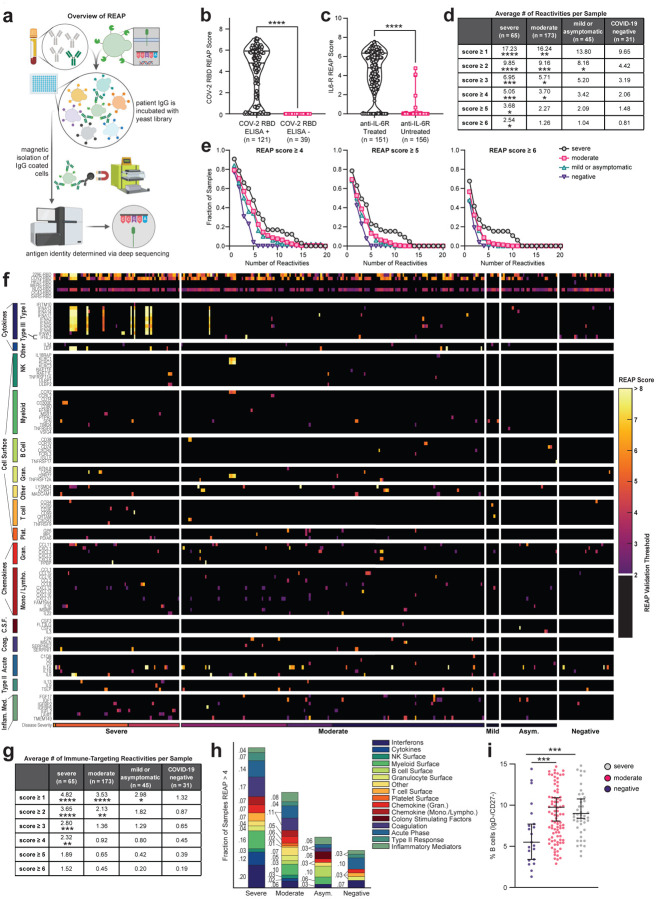
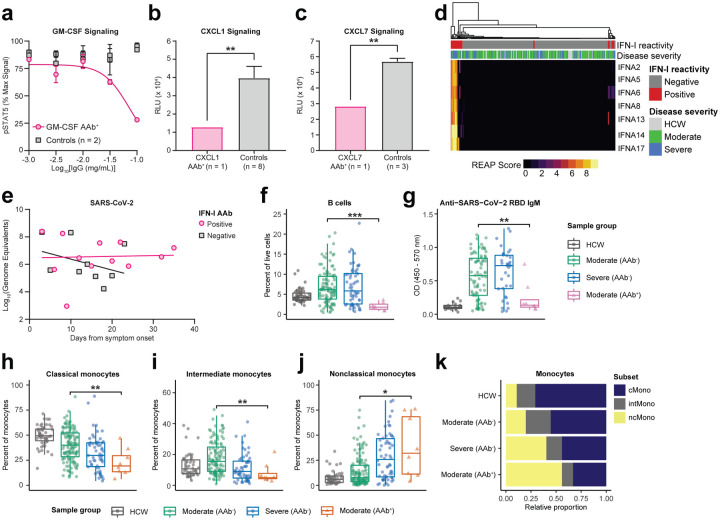
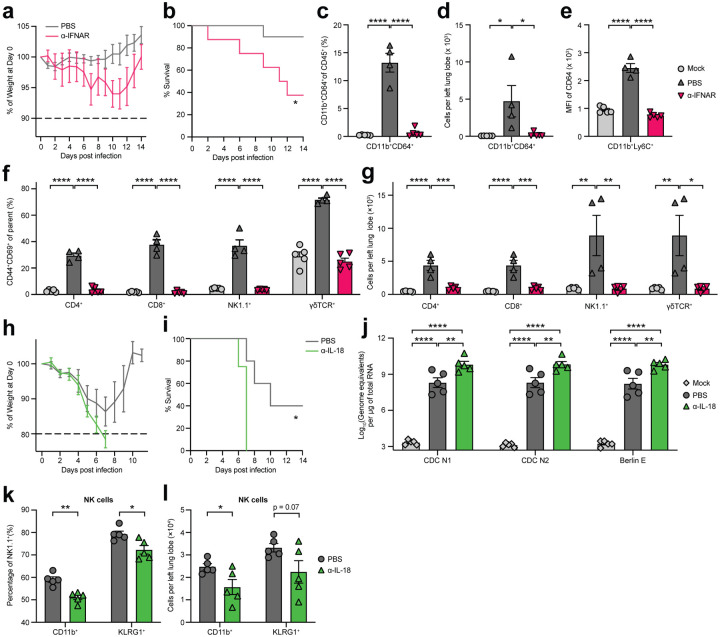
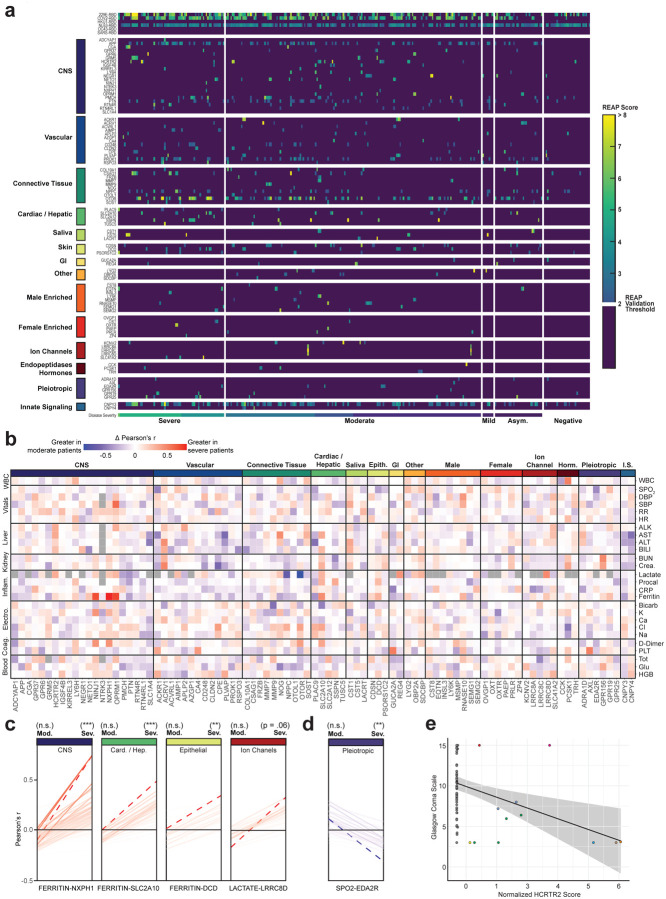
COVID-19 manifests with a wide spectrum of clinical phenotypes that are characterized by exaggerated and misdirected host immune responses1-8. While pathological innate immune activation is well documented in severe disease1, the impact of autoantibodies on disease progression is less defined. Here, we used a high-throughput autoantibody discovery technique called Rapid Extracellular Antigen Profiling (REAP) to screen a cohort of 194 SARS-CoV-2 infected COVID-19 patients and healthcare workers for autoantibodies against 2,770 extracellular and secreted proteins (the "exoproteome"). We found that COVID-19 patients exhibit dramatic increases in autoantibody reactivities compared to uninfected controls, with a high prevalence of autoantibodies against immunomodulatory proteins including cytokines, chemokines, complement components, and cell surface proteins. We established that these autoantibodies perturb immune function and impair virological control by inhibiting immunoreceptor signaling and by altering peripheral immune cell composition, and found that murine surrogates of these autoantibodies exacerbate disease severity in a mouse model of SARS-CoV-2 infection. Analysis of autoantibodies against tissue-associated antigens revealed associations with specific clinical characteristics and disease severity. In summary, these findings implicate a pathological role for exoproteome-directed autoantibodies in COVID-19 with diverse impacts on immune functionality and associations with clinical outcomes.


Conflict of interest statement

Competing Interests A.M.R., E.Y.W., and Y.D. are inventors of a patent describing the REAP technology.

Figures

Figure 1:
Figure 1:. COVID-19 patients have widespread autoantibody reactivity against extracellular antigens.
a, Simplified schematic of REAP. Antibodies are incubated with a barcoded yeast library displaying members of the exoproteome. Antibody bound yeast are enriched by magnetic column-based sorting and enrichment is quantified by next-generation sequencing. b, COV-2 RBD REAP scores for COVID-19 patient samples stratified by positive (n = 121) or negative (n = 39) ELISA RBD reactivity. Significance was determined using a two-sided Mann-Whitney U test. c, IL6-R REAP scores for COVID-19 patient samples stratified by treatment with an anti-IL-6R biologic therapy (tocilizumab or sarilumab). Samples collected at least one day after infusion were considered treated. Samples collected on the day of infusion were excluded from analysis due to uncertainty in the timing of sample collection. Significance was determined using a two-sided Mann-Whitney U test. d, Average number of positive reactivities per sample at different score cutoffs, stratified by disease severity. A positive reactivity was defined as one with a REAP score greater than or equal to the corresponding score cutoff. Comparisons were made between each disease severity group and the COVID-19 negative group. Significance was determined using a Kruskal-Wallis test followed by a Dunnet’s test. e, Distributions of hits between samples of different disease severities at different score cutoffs. Each point on the graph represents the fraction of samples in a given severity group that had at least the indicated number of reactivities at the given score cutoff. f, Heatmap of immune-related protein REAP scores stratified by disease severity. Scores below the REAP Validation Threshold of 2.0 were set to 0 to aid interpretation of significant hits. g, Average number of positive immune-targeting reactivities per sample at different score cutoffs, stratified by disease severity. Analysis was performed as in d. h, Fraction of samples, stratified by disease severity, with a REAP score greater than 4 for at least one antigen in each given antigen group. i, Percentages of IgD−/CD27− B cells among peripheral leukocytes in patient samples, stratified by disease severity. Significance was determined using a Kruskal-Wallis test followed by a Dunn’s test. Longitudinal samples from the same patient were included in all analyses in this figure. *P ≤ 0.05, **P ≤ 0.01, ***P ≤ 0.001, ****P ≤ 0.0001.
Figure 2:
Figure 2:. Autoantibodies in COVID-19 patients are functional and correlated with virological and immunological parameters in vivo.
a, GM-CSF signaling assay based on STAT5 phosphorylation performed in the presence of various concentrations of purified IgG from a COVID-19 patient with GM-CSF autoantibodies and uninfected control plasma samples. Details of percent max signal calculation can be found in methods. Curves were fit using a sigmoidal 4 parameter logistic curve. Results are averages of 2 technical replicates. b, CXCL1 and c, CXCL7 signaling assay performed in the presence of 0.05 mg/mL purified IgG from a COVID-19 patient with CXCL1 or CXCL7 autoantibodies and uninfected control plasma samples. Results are averages of 3 technical replicates. Significance was determined using a two-sided unpaired t-test (p = 0.0055 in b and 0.0069 in c). d, Hierarchically clustered heatmap of IFNα REAP reactivities across all samples. e, Longitudinal comparisons of SARS-CoV-2 viral load between patients with and without anti-interferon antibodies. Viral loads were estimated by plotting nasopharyngeal, saliva, or by averaging saliva and nasopharyngeal samples where both were present, in order to generate composite viral loads for each patient. Linear regressions for each group are displayed (solid lines). f, Percent B cells among peripheral leukocytes and g, anti-SARS-CoV-2 RBD IgM reactivity as measured by ELISA in samples stratified by COVID-19 disease severity and REAP reactivity (AAb+; REAP score > 2) against B cell displayed proteins (CD38, FcμR, FCRL3). h–j, Percentage among total monocytes of classical monocytes (h), intermediate monocytes (i), and nonclassical monocytes (j) in samples stratified by COVID-19 disease severity and REAP reactivity (AAb+; REAP score > 2) against proteins preferentially displayed on classical and intermediate monocytes (CCR2, CCRL2, FFAR4, SYND4, and CPAMD8). Data from f–j were presented as boxplots with the first quartile, median, third quartile, and individual data points indicated. k, Results from h–j represented as horizontal bar charts. Significance was determined using two-sided, Wilcoxon rank-sum test; *P ≤ 0.05, **P ≤ 0.01, ***P ≤ 0.001, ****P ≤ 0.0001. All error bars in this figure represent standard deviation.
Figure 3:
Figure 3:. Immune-targeting autoantibodies exacerbate disease in a mouse model of SARS-CoV-2 infection.
K18-hACE2 mice were intranasally infected with 103 PFU (a,b) or 104 (c–g, h–l) PFU SARS-CoV-2. a, Body weight of PBS- (n = 10) or αIFNAR-treated (n = 8) K18-hACE2 mice from day 1to14 post infection measured as percent of body weight at day 0. b, Survival, defined as 10% weight loss, of PBS- (n = 10) or αIFNAR-treated (n = 8) K18-ACE2 from day 1 to 14. c,d, Relative frequency (c) and absolute number (d) of lung Ly6C+CD11b+CD64+ macrophages from mock-infected (n = 5), SARS-CoV-2-infected PBS-treated (n = 4), and SARS-CoV-2-infected αIFNAR-treated (n = 5) K18-ACE2 mice, e, Expression of CD64 on lung-infiltrating CD11b+Ly6Chigh monocytes from mock-infected (n = 5), SARS-CoV-2-infected PBS-treated (n = 4), and SARS-CoV-2-infected αIFNAR-treated (n = 5) K18-ACE2 mice, f–g, Relative frequency (f) and absolute number (g) of CD44+CD69+ lymphocytes (CD4+ T cells, CD8+ T cells, NK1.1+ cells, and γδ T cells) measured by flow cytometry, h, Body weight of PBS- (n = 5) or αIL-18-treated (n = 4) K18-hACE2 mice from day 1 to14 post infection measured as percent of body weight at day 0. i, Survival, defined as 20% weight loss, of PBS- (n = 5) or αIL-18-treated (n = 4) K18-ACE2 from day 1 to 14. j, Viral burden from lung tissue homogenates measured 4 days post infection using RT-qPCR primer/probe sets against N or E genes from mock-infected (n = 5), SARS-CoV-2-infected PBS-treated (n = 5), and SARS-CoV-2-infected αIL-18-treated (n = 5) K18-ACE2 mice. k,l, Relative frequency (k) or absolute number (l) of CD11b+ and KLRG1+ NK1.1+ cells in lung tissues from mock-infected (n = 5), SARS-CoV-2-infected PBS-treated (n = 5), and SARS-CoV-2-infected αIL-18-treated (n = 5) K18-ACE2 mice. Significance was determined using two-way ANOVA followed by Sidak correction (a), Log-rank (Mantel-Cox) test (b), one-way ANOVA followed by Tukey correction (c–g, j), and unpaired two-tailed t test (k,l); *P ≤ 0.05, **P ≤ 0.01, ***P ≤ 0.001, ****P ≤ 0.0001. All error bars in this figure represent standard error of the mean.
Figure 4:
Figure 4:. Autoantibodies targeting tissue-associated antigens correlate with disease severity and clinical characteristics in COVID-19 patients.
a, Heatmap of tissue-associated REAP score stratified by disease severity. Scores below the REAP Validation Threshold of 2.0 were set to 0 to aid interpretation of significant hits. b, Difference matrix of Pearson’s r for tissue-associated antigen REAP scores and normalized time-matched clinical laboratory values between severe (n = 93) and moderate (n = 162) COVID-19 patient samples (Δ r = severe r - moderate r). Gray squares indicate r that were unable to be calculated due to missingness of the clinical variable. c,d, Change in Pearson’s r for antigen-clinical variable pairs between severe and moderate COVID-19 samples, stratified by positive (red, c) and negative (blue, d) Δ r. Antigen-clinical variable pairs with greatest Δ r are annotated and indicated with dashed lines (red). Significance of r was determined using two-sided t-tests. e, Correlation of normalized HCRTR2 REAP scores with Glasgow Coma Scale scores in severe COVID-19 samples. Blue line shows a linear regression fit. Samples from the same patient were indicated with the same color points. Longitudinal samples from the same patient were included in all analyses in this figure. *P ≤ 0.05, **P ≤ 0.01, ***P ≤ 0.001, ****P ≤ 0.0001.

References

    1. Lucas C. et al. Longitudinal analyses reveal immunological misfiring in severe COVID-19. Nature (2020) doi:10.1038/s41586-020-2588-y. - DOI - PMC - PubMed
    1. Vabret N. et al. Immunology of COVID-19: Current State of the Science. Immunity 52, 910–941 (2020). - PMC - PubMed
    1. Maucourant C. et al. Natural killer cell immunotypes related to COVID-19 disease severity. Sci Immunol 5, (2020). - PMC - PubMed
    1. Mathew D. et al. Deep immune profiling of COVID-19 patients reveals distinct immunotypes with therapeutic implications. Science 369, (2020). - PMC - PubMed
    1. Arunachalam P. S. et al. Systems biological assessment of immunity to mild versus severe COVID-19 infection in humans. Science 369, 1210–1220 (2020). - PMC - PubMed

Publication types