. 2020 Jan-Dec:24:2331216520972858.
doi: 10.1177/2331216520972858.

Binaural Recordings in Natural Acoustic Environments: Estimates of Speech-Likeness and Interaural Parameters

Affiliations

Binaural Recordings in Natural Acoustic Environments: Estimates of Speech-Likeness and Interaural Parameters

S Theo Goverts et al. Trends Hear. 2020 Jan-Dec.

Abstract

Binaural acoustic recordings were made in multiple natural environments, which were chosen to be similar to those reported to be difficult for listeners with impaired hearing. These environments include natural conversations that take place in the presence of other sound sources as found in restaurants, walking or biking in the city, and so on. Sounds from these environments were recorded binaurally with in-the-ear microphones and were analyzed with respect to speech-likeness measures and interaural difference measures. The speech-likeness measures were based on amplitude-modulation patterns within frequency bands and were estimated for 1-s time-slices. The interaural difference measures included interaural coherence, interaural time difference, and interaural level difference, which were estimated for time-slices of 20-ms duration. These binaural measures were documented for one-fourth-octave frequency bands centered at 500 Hz and for the envelopes of one-fourth-octave bands centered at 2000 Hz. For comparison purposes, the same speech-likeness and interaural difference measures were computed for a set of virtual recordings that mimic typical clinical test configurations. These virtual recordings were created by filtering anechoic waveforms with available head-related transfer functions and combining them to create multiple source combinations. Overall, the speech-likeness results show large variability within and between environments, and they demonstrate the importance of having information from both ears available. Furthermore, the interaural parameter results show that the natural recordings contain a relatively small proportion of time-slices with high coherence compared with the virtual recordings; however, when present, binaural cues might be used for selecting intervals with good speech intelligibility for individual sources.

Keywords: binaural recordings; everyday-life recordings; interaural differences; natural environments; speech-likeness.


Conflict of interest statement

Declaration of Conflicting Interests: The authors declared no potential conflicts of interest with respect to the research, authorship, and/or publication of this article.

Figures

Figure 1.
Figure 1.
Values of speech-likeness for (A) a set of ICRA nonspeech recordings downloaded from https://icra-audiology.org/Repository/icra-noise; (B) recordings using the binaural microphones of clean natural speech by 15 male talkers; and (C) recordings using the binaural microphones of clean natural speech by 15 female talkers. Dotted lines indicate boundary values corresponding to 0%, 50%, and 100% correct speech recognition (explained later in the Discussion section).
Figure 2.
Figure 2.
Measures of Speech-Likeness in the Virtual Recordings as a function of the Target-to-Masker Ratio (TMR), for three Masker Types (LTASS, FLUC, and MALE) and For each ear (L,R) as Noted by Different Symbols. The top row is for anechoic conditions: target and masker colocated at 0 (left column) and target at −45 and masker at +45 (right column). The second row presents the same configurations for a highly reverberant condition (T60 > 1.2 s). LTASS = long-term-average-speech-shaped spectrum. FLUC = fluctuating (speech-envelope-modulated) noise, MALE = a male talker, see text in methods section.
Figure 3.
Figure 3.
Reference Frame for Interpreting Speech-Likeness (SL) in the Natural Recordings. Calculations for the values plotted use virtual stimuli and are explained in the text. For interpreting interaural differences in the natural recordings, SL data for the right ear are plotted versus SL data for the left ear for the T–45M + 45 condition in LTASS noise (and for the mirrored condition T + 45M–45). Data for the anechoic conditions are shown with dark lines and data for the reverberated cases are given with gray lines. Boundary values for speech-likeness values roughly corresponding to 0%, 50%, and 100% correct speech recognition are indicated by dashed horizontal and vertical lines, as described in the Discussion section.
Figure 4.
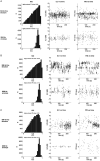
Figure 4.
Speech-Likeness (SL) in Natural Recordings for Two Inside Environments [Home (a) and Restaurant (b)], for Three Outside Environments [City Walk (c), City Talk (d), and City Bike (e)], and for Three Public Transport Environments [Station Hall (f), in a Train (g), and in a Bus (h)]. For each environment, the left panel illustrates the temporal dynamics of SL in natural settings by plotting speech-likeness values for both ears as a function of time for a 250-s portion of each recording; median values of the interaural differences (IADs) are given in each plot as well as the boundaries of the 95% intervals. The right panel gives interaural differences in speech-likeness by plotting values for the right ear versus those for the left ear in the reference frame provided by Figure 3.
Figure 5.
Figure 5.
Speech-Likeness Values for Right Ear Versus Left Ear for all eight environments plotted together. As described in the Discussion section, four subdivisions are indicated for listeners with normal hearing, using the speech-likeness boundary of 8.2 corresponding to the SNR for 100% intelligibility in this population. These SL boundaries are indicated with thick black lines. In addition, boundaries for listeners with hearing impairment are indicated with gray lines. With impairment, the SNR for 50% intelligibility is shifted and the psychometric curve is shallower; hence, the SNR for 100% intelligibility will shift and so will the SL boundaries (toward higher speech-likeness values of about 11).
Figure 6.
Figure 6.
Interaural parameters analyzed in 20-ms time-slices for the virtual recordings for (A) ANECHOIC for spatial condition T–45M + 45 and TMR = 0, and (B) REVERBERANT, also for spatial condition T–45M+45 and TMR = 0. Each subfigure presents in the top row (for bands centered at 500 Hz) from left to right: the distribution of ICC values; the joint distribution of ITD and ILD values using all ITD values recorded (ICC > 0.5), and corresponding ILDs; the joint distribution of ITD and ILD using only data with highly coherent ICCs (ICC > 0.95). In the second row, the same data are given for the envelopes of the 2000-Hz band. ICC = interaural cross-coherence; ITD = interaural time delay; ILD =interaural level difference.
Figure 7.
Figure 7.
Interaural Parameters Analyzed in 20-ms Time-Slices for Several Natural Environments. A: An Inside environment (Restaurant). B: An Outside environment (City Walk). C: A Public Transport environment (In a Train). For each environment, the three panels in the upper row present data for the 500 Hz frequency band, and the lower row presents data for the 2000-Hz band. The distribution of ICC values are in the leftmost panel, with the fraction of time−frequency slices that are highly coherent given; the center panel gives the ILD values plotted versus time; and the right panel gives the ITD values plotted versus time. Only the highly correlated values (ICC > 0.95) are plotted in both cases. ICC = interaural cross-coherence; ITD = interaural time delay; ILD =interaural level difference.
Figure 8.
Figure 8.
Combined coherence data for all eight natural environments in the 2000-Hz band (envelope) versus the 500-Hz band (fine-structure) in bins that are spaced by 0.01. Numbers are expressed as fractions of the total number of time-slices in the eight environments (143104). The data in this graph could be considered as exemplary for the coherence in binaural stimuli that people encounter in daily life. Note that the ICC values are scattered and that maximum values are about 0.0014. (For the virtual recording with female target at +45° and male masker at −45°, values are nearly all in the high coherent region with maximum values of 0.45.)

References

    1. Bernstein L. R., Trahiotis C. (1996. a). On the use of the normalized correlation as an index of interaural envelope correlation. Journal of the Acoustical Society of America, 100, 1754–1763. 10.1121/1.416072 - DOI - PubMed
    1. Bernstein L. R., Trahiotis C. (1996. b). The normalized correlation: Accounting for binaural detection across center frequency. Journal of the Acoustical. Society of America, 100, 3774–3784. 10.1121/1.417237 - DOI - PubMed
    1. Best V., Keidser G, Buchholz J., Freeston K. (2015). An examination of speech reception thresholds measured in a simulated reverberant cafeteria environment. International Journal of Audiology, 54(10), 682–690. 10.3109/14992027.2015.1028656 - DOI - PMC - PubMed
    1. Best V., Mason C.R., Swaminathan J., Roverud E., Kidd G. (2017). Use of a glimpsing model to understand the performance of listeners with and without hearing loss in spatialized speech mixtures. Journal of the Acoustical Society of America, 141(1), 81–91. 10.1121/1.4973620 - DOI - PMC - PubMed
    1. Beutelmann, R., and Brand, T. (2006) Prediction of speech intelligibility in spatial noise and reverberation for normal-hearing and hearing-impaired listeners. Journal of the Acoustical Society of America, 120(1), 331–42. Doi: 10.1121/1.2202888. - PubMed

Publication types

LinkOut - more resources