. 2020 Dec 17;15(12):e0243215.
doi: 10.1371/journal.pone.0243215. eCollection 2020.

Supportive consensus

Affiliations

Supportive consensus

A Palomares et al. PLoS One. .

Abstract

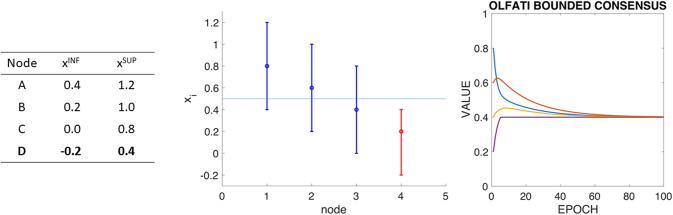
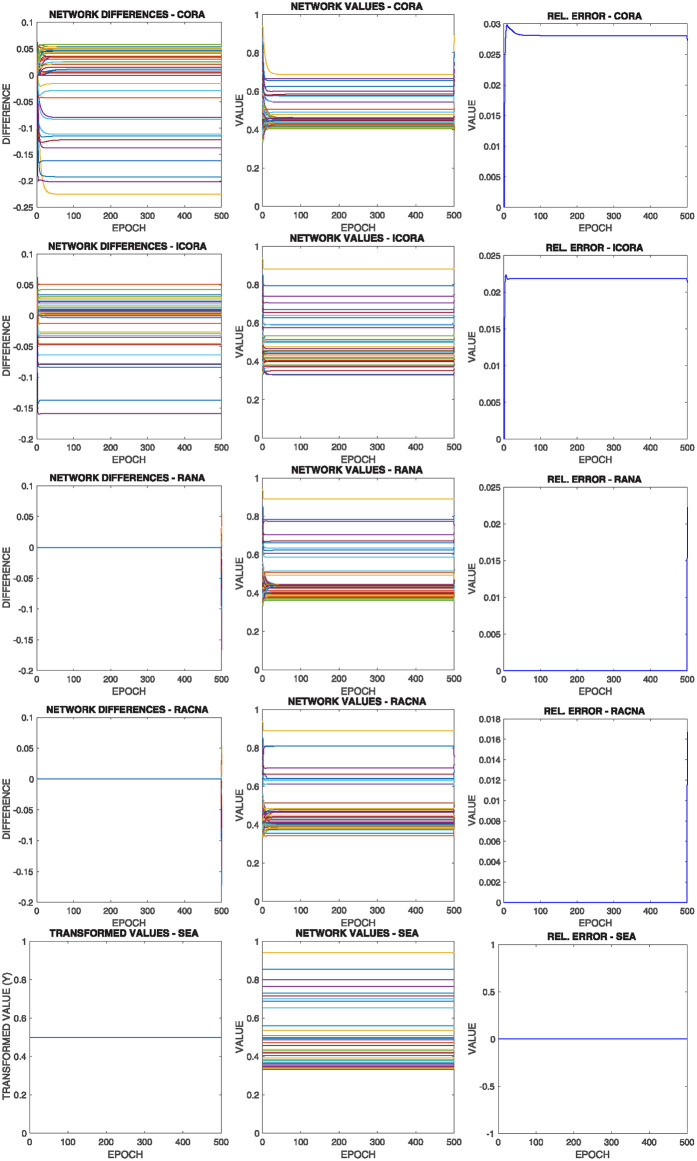
The paper is concerned with the consensus problem in a multi-agent system such that each agent has boundary constraints. Classical Olfati-Saber's consensus algorithm converges to the same value of the consensus variable, and all the agents reach the same value. These algorithms find an equality solution. However, what happens when this equality solution is out of the range of some of the agents? In this case, this solution is not adequate for the proposed problem. In this paper, we propose a new kind of algorithms called supportive consensus where some agents of the network can compensate for the lack of capacity of other agents to reach the average value, and so obtain an acceptable solution for the proposed problem. Supportive consensus finds an equity solution. In the rest of the paper, we define the supportive consensus, analyze and demonstrate the network's capacity to compensate out of boundaries agents, propose different supportive consensus algorithms, and finally, provide some simulations to show the performance of the proposed algorithms.


Conflict of interest statement

The authors have declared that no competing interests exist.

Figures

Fig 1
Fig 1
ABCD example: Graph (left), the initial values of nodes (center) and original Olfati-Saber’s consensus algorithm for ABCD example without considering boundaries.
Fig 2
Fig 2
ABCD example with boundaries (I): Boundaries of each node (left), graph representation of boundaries and initial values (center), and Olfati-Saber’s consensus algorithm. It has to be taken into account that the mean value of the network is 0.5, and this value is out of the node D boundaries.
Fig 3
Fig 3
ABCD example with boundaries (II): Boundaries of each node (left), graph representation of boundaries and initial values (center), and Olfati’s consensus algorithm. It has to be taken into account that no node boundaries overlap with no other. In this case, the sum of the final values is 2.18, while the sum of the initial values is 2.
Fig 4
Fig 4. Graphical representation of the node sets classification according to its bounds and accumulated magnitudes (temporal dependence not included for clarity).
Fig 5
Fig 5. Supportive consensus process according to the CORA algorithm in the ABCD example.
Fig 6
Fig 6. Supportive consensus process according to the iCORA algorithm in the ABCD example.
Fig 7
Fig 7. Supportive consensus process according to the RANA algorithm in the ABCD example.
Fig 8
Fig 8. Supportive consensus process according to the RACNA algorithm in the ABCD example.
Fig 9
Fig 9. Supportive consensus process according to the SEA algorithm in the ABCD example.
Fig 10
Fig 10
(Left) Evolution of the network capacities using the CORA algorithm. (Right) Final values xi(t) of the nodes.
Fig 11
Fig 11. Relative error experiment: Results of the different supportive consensus proposed using different random networks.
Fig 12
Fig 12. One particular example of each configuration of the experiment.
Four initial configurations are considered: two asymmetric (top), where are more nodes over or below the average value, and symmetric (bottom), where the proportion of nodes that over or underrange is the same.
Fig 13
Fig 13. Results of configuration 1 with initial values as in Fig 12 top left, where there are more nodes whose lower bound is over the average value.
Each row shows one of the algorithms |V(0)| > |V+(0)|.
Fig 14
Fig 14. Results of configuration 2 with initial values as in Fig 12 top right, where there are more nodes whose upper bound is under the average value |V+(0)| > |V(0)|.
Each row shows one of the algorithms.
Fig 15
Fig 15. Results of configuration 3 with initial values as in Fig 12 bottom left, where there the average value is into the bounds of the majority of the nodes |V*(0)| > > |V+(0)|+ |V(0)|.
Each row shows one of the algorithms.
Fig 16
Fig 16. Results of configuration 4 with initial values as in Fig 12 bottom right, where the solution is out of the bounds of almost all the nodes |V*(0)| → 0.
Each row shows one of the algorithms.

References

    1. Olfati-Saber R, Murray RM. Consensus Problems in Networks of Agents with Switching Topology and Time-Delays. IEEE TAC. 2004;49(9):1520–1533.
    1. Olfati-Saber R, Fax JA, Murray RM. Consensus and Cooperation in Networked Multi-Agent Systems. Proceedings of the IEEE. 2007;95(1):215–233. 10.1109/JPROC.2006.887293 - DOI
    1. Pérez IJ, Cabrerizo FJ, Alonso S, Dong YC, Chiclana F, Herrera-Viedma E. On dynamic consensus processes in group decision making problems. Information Sciences. 2018;459:20–35. 10.1016/j.ins.2018.05.017 - DOI
    1. Fischbacher U, Gachter S. Social preferences, beliefs, and the dynamics of free riding in public goods experiments. American economic review. 2010;100(1):541–56. 10.1257/aer.100.1.541 - DOI
    1. Du S, Hu L, Song M. Production optimization considering environmental performance and preference in the cap-and-trade system. Journal of Cleaner Production. 2016;112:1600–1607. 10.1016/j.jclepro.2014.08.086 - DOI

Publication types