

Dose-dependent sensorimotor impairment in human ocular tracking after acute low-dose alcohol administration
- PMID: 33332605
- PMCID: PMC7898833
- DOI: 10.1113/JP280395
Dose-dependent sensorimotor impairment in human ocular tracking after acute low-dose alcohol administration
Abstract
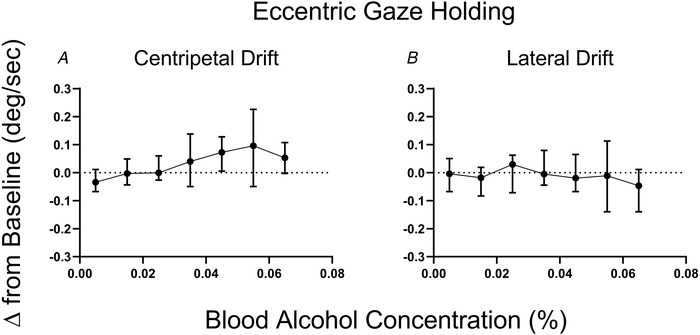
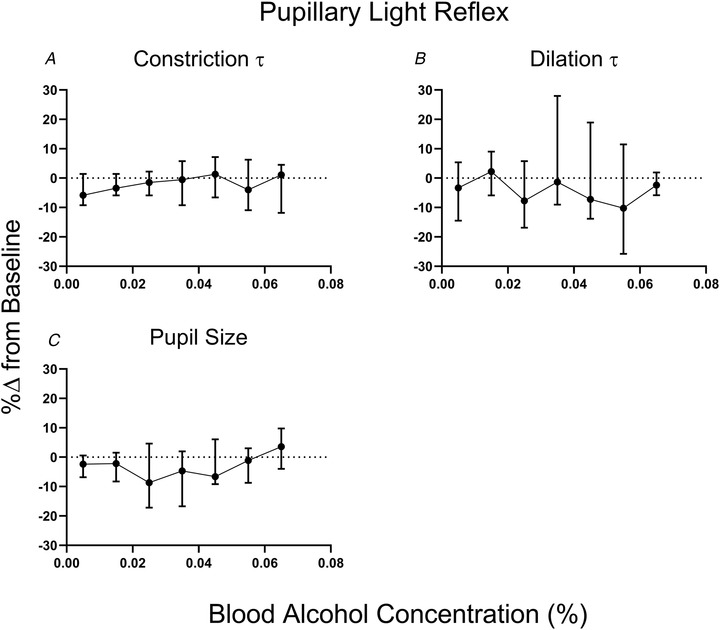
Key points: Oculomotor behaviours are commonly used to evaluate sensorimotor disruption due to ethanol (EtOH). The current study demonstrates the dose-dependent impairment in oculomotor and ocular behaviours across a range of ultra-low BACs (<0.035%). Processing of target speed and direction, as well as pursuit eye movements, are significantly impaired at 0.015% BAC, suggesting impaired neural activity within brain regions associated with the visual processing of motion. Catch-up saccades during steady visual tracking of the moving target compensate for the reduced vigour of smooth eye movements that occurs with the ingestion of low-dose alcohol. Saccade dynamics start to become 'sluggish' at as low as 0.035% BAC. Pupillary light responses appear unaffected at BAC levels up to 0.065%.
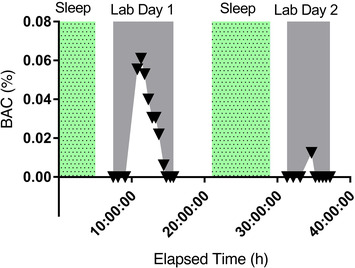
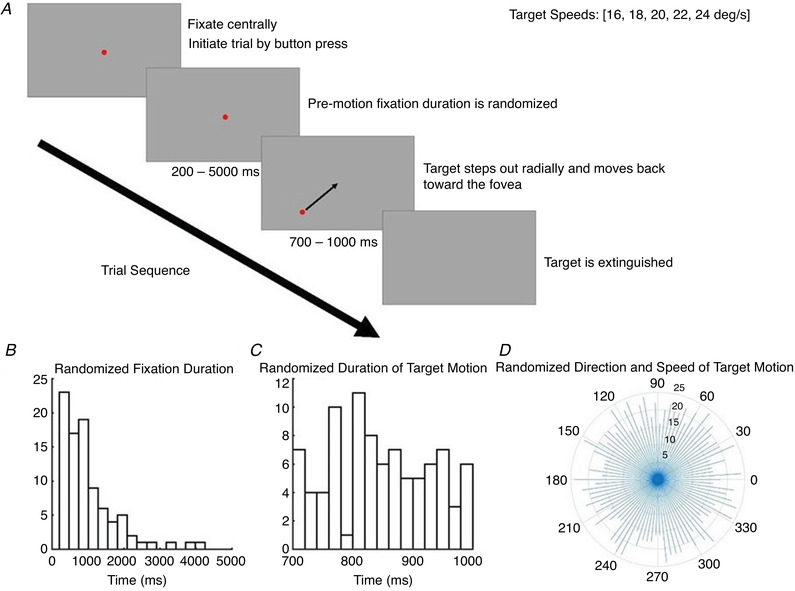
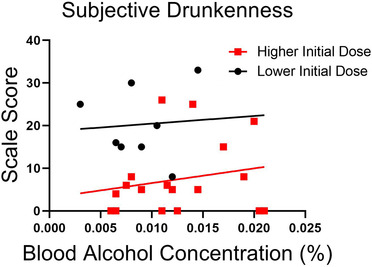
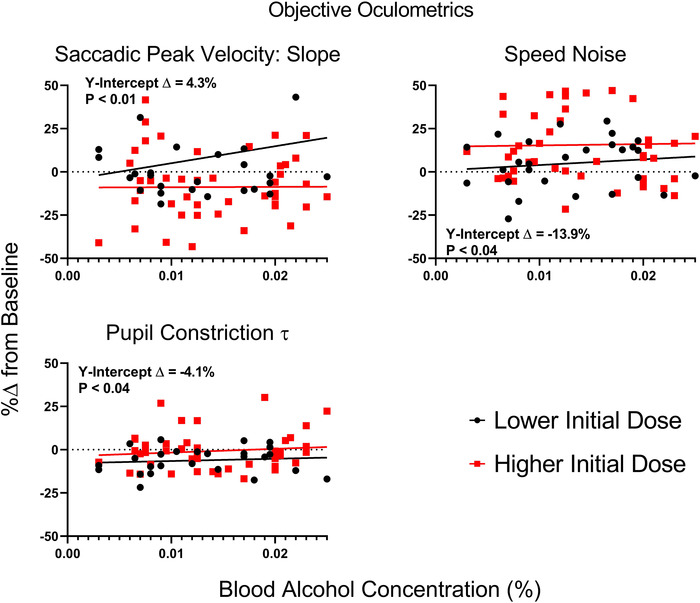
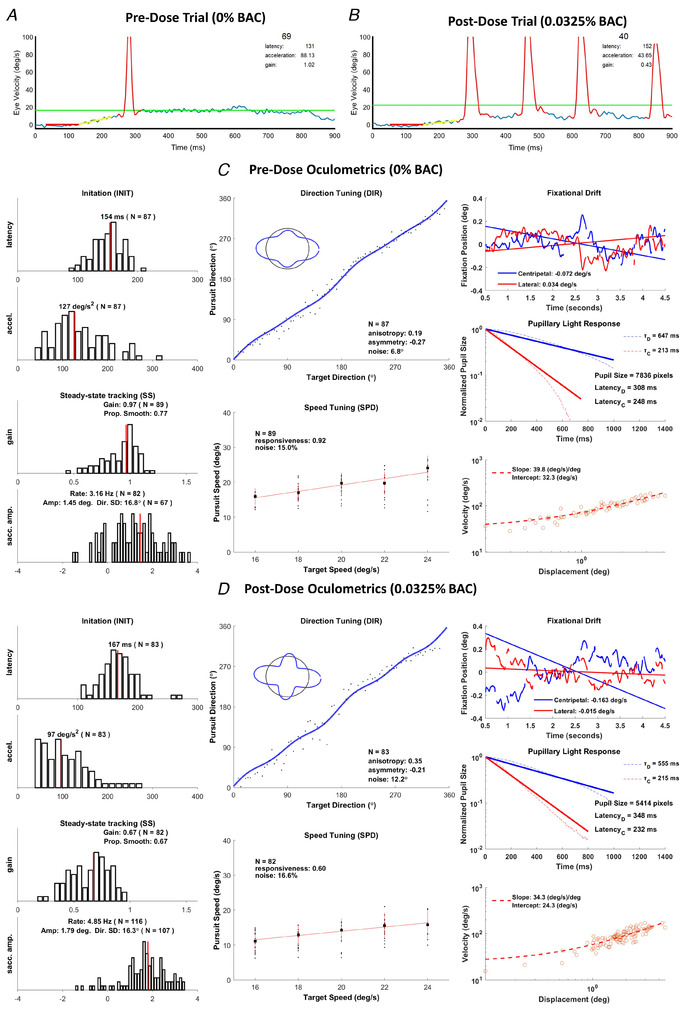
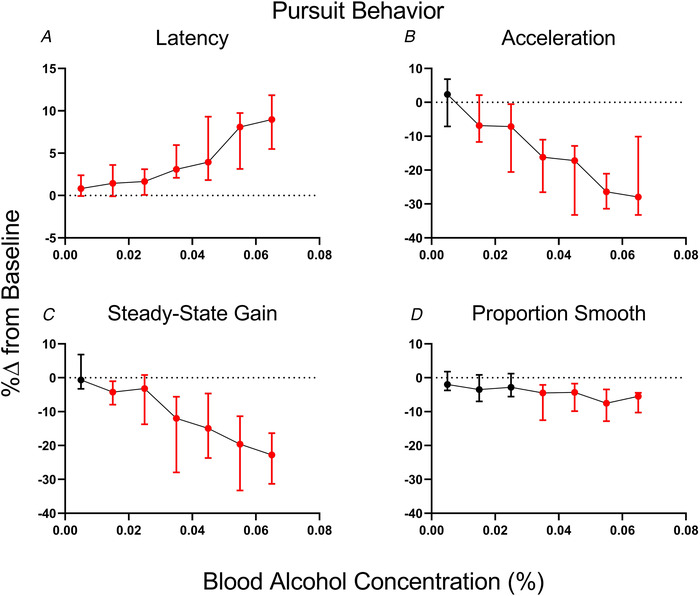
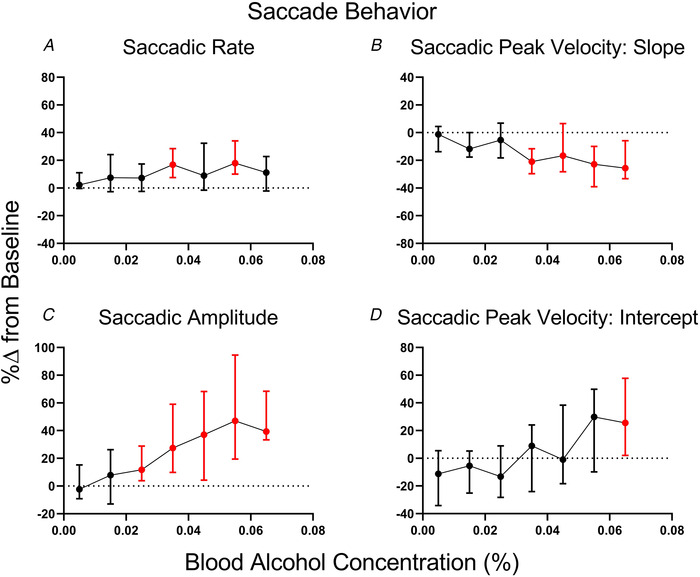
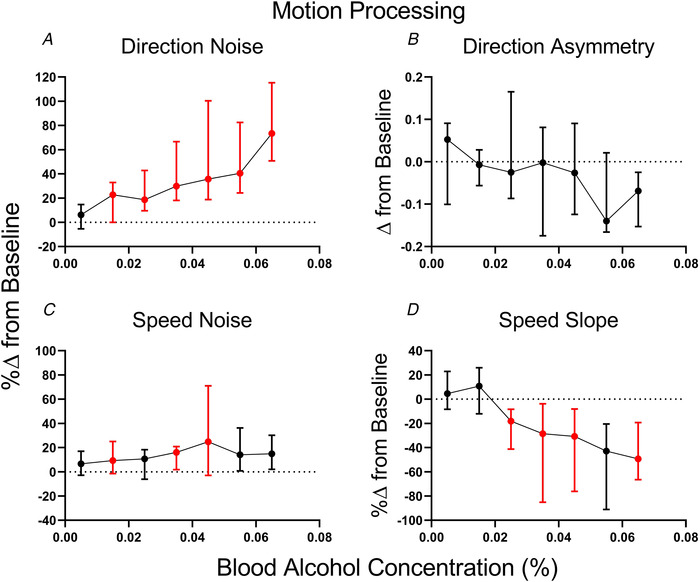
Abstract: Changes in oculomotor behaviours are often used as metrics of sensorimotor disruption due to ethanol (EtOH); however, previous studies have focused on deficits at blood-alcohol concentrations (BACs) above about 0.04%. We investigated the dose dependence of the impairment in oculomotor and ocular behaviours caused by EtOH administration across a range of ultra-low BACs (≤0.035%). We took repeated measures of oculomotor and ocular performance from sixteen participants, both pre- and post-EtOH administration. To assess the neurological impacts across a wide range of brain areas and pathways, our protocol measured 21 largely independent performance metrics extracted from a range of behavioural responses ranging from ocular tracking of radial step-ramp stimuli, to eccentric gaze holding, to pupillary responses evoked by light flashes. Our results show significant impairment of pursuit and visual motion processing at 0.015% BAC, reflecting degraded neural processing within extrastriate cortical pathways. However, catch-up saccades largely compensate for the tracking displacement shortfall caused by low pursuit gain, although there still is significant residual retinal slip and thus degraded dynamic acuity. Furthermore, although saccades are more frequent, their dynamics are more sluggish (i.e. show lower peak velocities) starting at BAC levels as low as 0.035%. Small effects in eccentric gaze holding and no effect in pupillary response dynamics were observed at levels below 0.07%, showing the higher sensitivity of the pursuit response to very low levels of blood alcohol, under the conditions of our study.
Keywords: alcohol; saccades; smooth pursuit; visual motion processing.
© 2020 San Jose State University. The Journal of Physiology published by John Wiley & Sons Ltd on behalf of The Physiological Society.
Figures
Comment in
-
Want to win a bowling game? Beware of even one glass of alcohol!J Physiol. 2021 Feb;599(4):1017-1018. doi: 10.1113/JP280984. Epub 2020 Dec 17. J Physiol. 2021. PMID: 33332617 No abstract available.
Similar articles
-
Differential saccade-pursuit coordination under sleep loss and low-dose alcohol.Front Neurosci. 2023 Feb 16;16:1067722. doi: 10.3389/fnins.2022.1067722. eCollection 2022. Front Neurosci. 2023. PMID: 36874639 Free PMC article.
-
Transfer function of the rhesus macaque oculomotor system for small-amplitude slow motion trajectories.J Neurophysiol. 2019 Feb 1;121(2):513-529. doi: 10.1152/jn.00437.2018. Epub 2018 Dec 12. J Neurophysiol. 2019. PMID: 30540500
-
Eye tracking abnormalities in schizophrenia: evidence for dysfunction in the frontal eye fields.Biol Psychiatry. 1998 Oct 15;44(8):698-708. doi: 10.1016/s0006-3223(98)00035-3. Biol Psychiatry. 1998. PMID: 9798073
-
Visual selective attention and the control of tracking eye movements: a critical review.J Neurophysiol. 2021 May 1;125(5):1552-1576. doi: 10.1152/jn.00145.2019. Epub 2021 Mar 17. J Neurophysiol. 2021. PMID: 33730516 Review.
-
Saccades and pursuit: two outcomes of a single sensorimotor process.J Physiol. 2007 Oct 1;584(Pt 1):11-23. doi: 10.1113/jphysiol.2007.139881. Epub 2007 Aug 9. J Physiol. 2007. PMID: 17690138 Free PMC article. Review.
Cited by
-
A longitudinal resource for population neuroscience of school-age children and adolescents in China.Sci Data. 2023 Aug 21;10(1):545. doi: 10.1038/s41597-023-02377-8. Sci Data. 2023. PMID: 37604823 Free PMC article.
-
Serial Dependence in Smooth Pursuit Eye Movements of Preadolescent Children and Adults.Invest Ophthalmol Vis Sci. 2024 Dec 2;65(14):37. doi: 10.1167/iovs.65.14.37. Invest Ophthalmol Vis Sci. 2024. PMID: 39728694 Free PMC article.
-
The eyes have it: Alcohol-induced eye movement impairment and perceived impairment in older adults with and without alcohol use disorder.Alcohol Clin Exp Res (Hoboken). 2025 Feb;49(2):437-447. doi: 10.1111/acer.15509. Epub 2025 Jan 29. Alcohol Clin Exp Res (Hoboken). 2025. PMID: 39878623 Free PMC article.
-
Differential saccade-pursuit coordination under sleep loss and low-dose alcohol.Front Neurosci. 2023 Feb 16;16:1067722. doi: 10.3389/fnins.2022.1067722. eCollection 2022. Front Neurosci. 2023. PMID: 36874639 Free PMC article.
-
Ethanol-Induced Vestibular Dysfunction as a Model for Bilateral Vestibular Syndrome: Similarities in Video Head Impulse Test and Video-Oculography Data.J Int Adv Otol. 2023 Oct;19(5):388-395. doi: 10.5152/iao.2023.231030. J Int Adv Otol. 2023. PMID: 37789625 Free PMC article.
References
-
- Albright TD (1984). Direction and orientation selectivity of neurons in visual area MT of the macaque. J Neurophysiol 52, 1106–1130. - PubMed
-
- Amodio A, Ermidoro M, Maggi D, Formentin S & Savaresi SM (2019). Automatic detection of driver impairment based on pupillary light reflex. IEEE Trans Intell Transport Syst 20, 3038–3048.
-
- Bach M (1996). The Freiburg Visual Acuity test – automatic measurement of visual acuity. Optom Vis Sci 73, 49–53. - PubMed
-
- Barnes GR. (1984). The effects of ethyl alcohol on visual pursuit and suppression of the vestibulo‐ocular reflex. Acta Otolaryngol Suppl 406, 161–166. - PubMed
-
- Barnes GR (2008). Cognitive processes involved in smooth pursuit eye movements. Brain Cogn 68, 309–326. - PubMed
Publication types
MeSH terms
Substances
LinkOut - more resources
Full Text Sources