

Targeted stabilization of Munc18-1 function via pharmacological chaperones
- PMID: 33332765
- PMCID: PMC7799358
- DOI: 10.15252/emmm.202012354
Targeted stabilization of Munc18-1 function via pharmacological chaperones
Abstract
Heterozygous de novo mutations in the neuronal protein Munc18-1 cause syndromic neurological symptoms, including severe epilepsy, intellectual disability, developmental delay, ataxia, and tremor. No disease-modifying therapy exists to treat these disorders, and while chemical chaperones have been shown to alleviate neuronal dysfunction caused by missense mutations in Munc18-1, their required high concentrations and potential toxicity necessitate a Munc18-1-targeted therapy. Munc18-1 is essential for neurotransmitter release, and mutations in Munc18-1 have been shown to cause neuronal dysfunction via aggregation and co-aggregation of the wild-type protein, reducing functional Munc18-1 levels well below hemizygous levels. Here, we identify two pharmacological chaperones via structure-based drug design, that bind to wild-type and mutant Munc18-1, and revert Munc18-1 aggregation and neuronal dysfunction in vitro and in vivo, providing the first targeted treatment strategy for these severe pediatric encephalopathies.
Keywords: Munc18-1; Rescue; STXBP1; pharmacological chaperone; small molecule.
© 2020 The Authors. Published under the terms of the CC BY 4.0 license.
Conflict of interest statement
The authors declare that they have no conflict of interest.
Figures
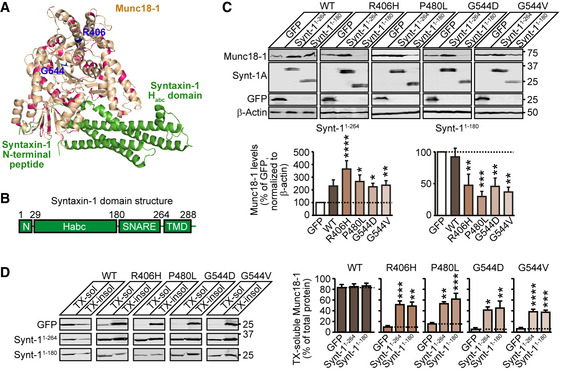
Localization of disease‐causing missense mutations of Munc18‐1b in its tertiary structure (PDB code 4JEU) (Burkhardt et al, 2008), with annotation of residues and binding sites of syntaxin‐1 Habc domain and N terminus. Highlighted in blue are the residues 406 and 544 that we have analyzed in this study in detail.
Syntaxin‐1 domain structure. The N terminus (residues 1‐28) binds to domain 1 of Munc18‐1 while the Habc domain (residues 28–180) and the SNARE domain (residues 180–264) bind in Munc18‐1’s central cleft. The transmembrane domain (TMD; residues 264–288) does not participate in Munc18‐1 binding.
Total protein levels of Munc18‐1. HEK293T cells transfected with WT or mutant Munc18‐1 variants and either GFP, syntaxin‐11‐264 or syntaxin‐11‐180 were lysed and lysates were analyzed by quantitative immunoblotting to indicated proteins, normalized to β‐actin (Synt‐1A = syntaxin‐1A). Data are means ± SEM (*P < 0.05, **P < 0.01, ***P < 0.001, ****P < 0.0001 by Kruskal–Wallis test, followed by Dunn’s multiple comparison test; n = 11 independent experiments; exact P‐values are shown in Appendix Table S1).
Solubility of Munc18‐1. HEK293T cells transfected as in (C) were solubilized in 0.1% Triton X‐100 (TX), and equal volumes of soluble and insoluble fractions were analyzed by quantitative immunoblotting. TX‐soluble Munc18‐1 was measured as percent of total Munc18‐1 by quantitative immunoblotting. Data are means ± SEM (*P < 0.05, **P < 0.01, ***P < 0.001, ****P < 0.0001 by Kruskal–Wallis test followed by Dunn’s multiple comparison test, or by one‐way ANOVA followed by Bonferroni post hoc test; n = 5–9 independent experiments; exact n and P values are shown in Appendix Table S1).
- A, B
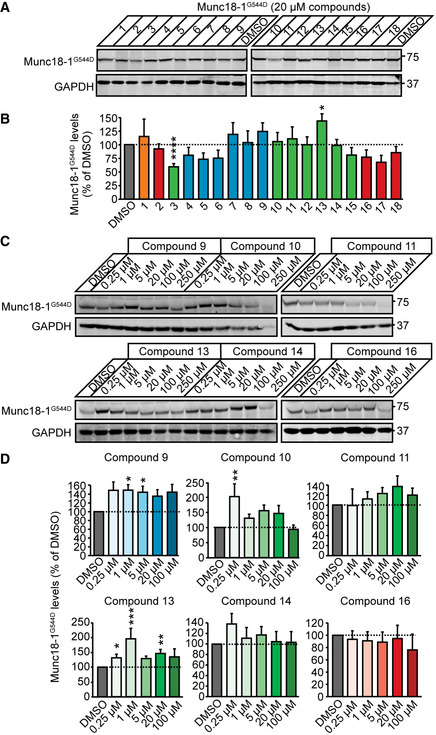
Total protein levels of G544D Munc18‐1. G544D Munc18‐1b was expressed in cortical mouse neurons infected with lentiviral vectors expressing cre recombinase in the presence or absence of compounds at 20 µM, or DMSO (vehicle control). Total Munc18‐1 levels were analyzed by quantitative immunoblotting 9 days after infections (A), normalized to GAPDH levels (B). Data are means ± SEM (*P < 0.05, ****P < 0.0001 by one‐way ANOVA followed by Bonferroni post hoc test; n = 6 independent experiments; exact P values are shown in Appendix Table S1).
- C, D
Same as in (A, B) except that compounds 9, 10, 11, 13, 14, and 16 were added at 0.25, 1, 5, 20, 100, or 250 µM. Note, that the data for 250 µM were not plotted in (D) because of neuronal death. Data are means ± SEM (*P < 0.05, **P < 0.01 by Kruskal–Wallis test with Dunn’s multiple comparison test, or one‐way ANOVA with Dunnett’s post hoc test; n = 6–15 independent experiments; exact n and P values are shown in Appendix Table S1).
- A, B
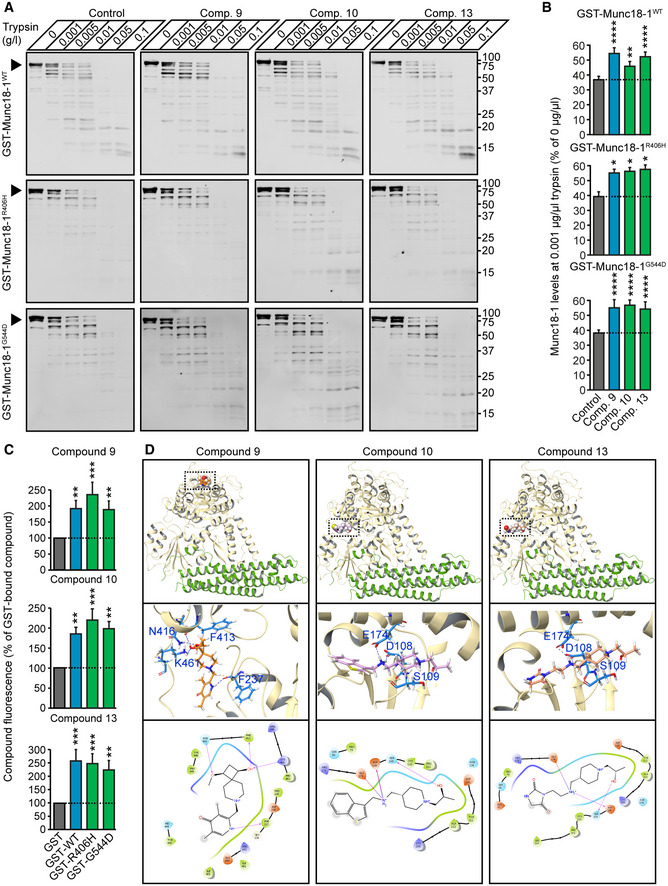
Limited proteolysis. Recombinant purified proteins were incubated with increasing concentrations of trypsin in presence or absence of 20 µM compound. Remaining protein levels were analyzed by quantitative immunoblotting. Data are means ± SEM (*P < 0.05, **P < 0.01, ****P < 0.0001, by two‐way ANOVA and Dunnett’s multiple comparison test; n = 4 independent experiments; exact P values are shown in Appendix Table S1).
- C
Direct binding of compounds to Munc18‐1. Bead‐bound fluorescence of compounds 9, 10, and 13 was quantified upon incubation of compounds with bead‐immobilized GST, or GST‐tagged WT, R406H or G544D. Data are means ± SEM (**P < 0.01, ***P < 0.001, by Kruskal–Wallis test and Dunn’s multiple comparison test, or by one‐way ANOVA followed by Dunnett’s post hoc test; n = 9 independent experiments; exact P values are shown in Appendix Table S1).
- D
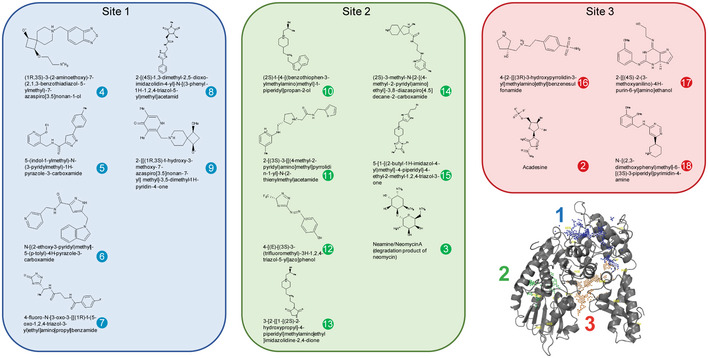
Predicted binding sites of compounds 9, 10 and 13. The top set of images gives a global view of the binding sites. The middle set of images gives a 3D view of residue intermolecular interactions with the compounds of interest. The bottom set of images gives a diagrammatic 2D representation of the same interactions. Hydrogen bonds are represented by arrows (arrowhead pointing to acceptor) and salt bridges by a red to blue gradient line (color change red:negative, and blue:positive).

- A, B
Munc18‐1 knockout neurons expressing G544D Munc18‐1 were plated on a microelectrode array and subjected to analysis of mean firing frequency before addition of compounds (0 h) or 48 h after vehicle (DMSO) or compound addition. 16 electrodes per well were analyzed for neuronal firing (A; purple boxes indicate network activity). Data are means ± SEM (*P < 0.05, **P < 0.01, ***P < 0.001 by one‐way ANOVA and Dunnett’s multiple comparison test, or Kruskal–Wallis test followed by Dunn’s post hoc test; n = 11–16 independent experiments; exact n and P values are shown in Appendix Table S1).
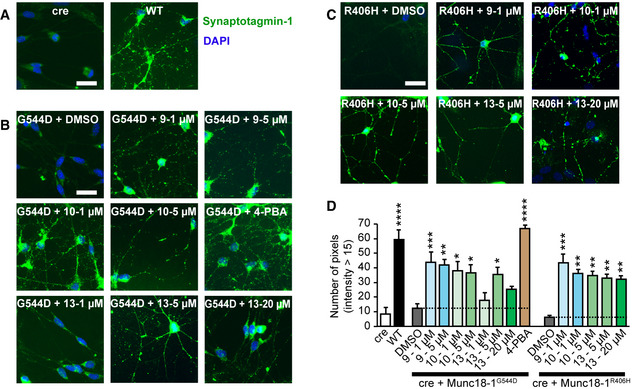
- A–D
Uptake of synaptotagmin‐1 antibody during high K+ stimulation. Neurons expressing cre recombinase and/or WT, R406H, or G544D Munc18‐1b with or without compound were subjected to an antibody uptake assay 7 days after lentiviral infection. Endocytosed synaptotagmin‐1 antibody was quantified by immunostaining (A‐C; scale bar = 30 µm; 4‐PBA = 4‐phenylbutyrate), via counting the number of pixels > intensity of 15 (D). Data are means ± SEM (*P < 0.05, **P < 0.01, ***P < 0.001, ****P < 0.0001 by one‐way ANOVA and Dunnett’s multiple comparison test; n = 3–10 independent experiments; exact n and P values are shown in Appendix Table S1).
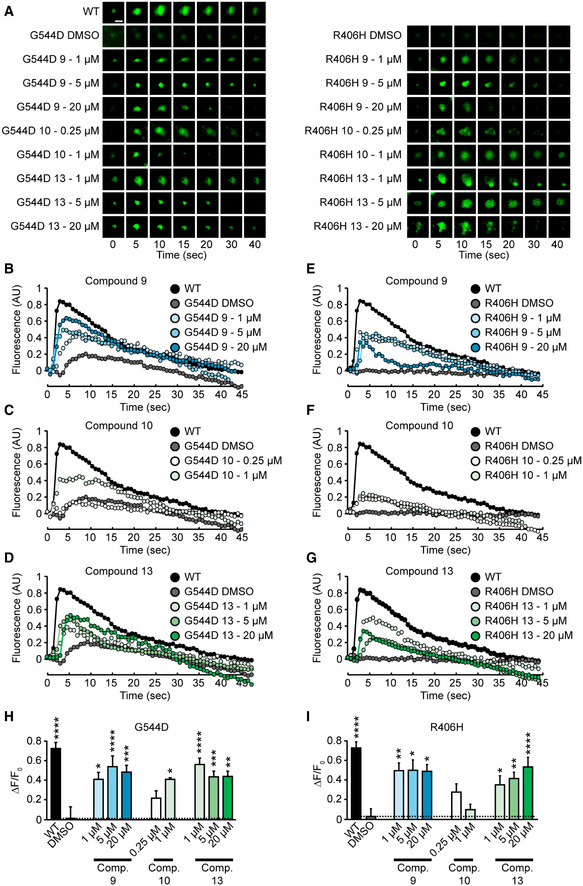
- A–G
Representative images (A) or traces (B‐D & E‐G) of changes in fluorescence of synaptophysin‐pHluorin upon stimulation of neurons (scale bar in panel (A) = 2 µm).
- H, I
Plot of change in fluorescence from baseline to peak fluorescence for Munc18‐1 G544D (H) or R406H (I). Data are means ± SEM (*P < 0.05, **P < 0.01, ***P < 0.001, ****P < 0.0001 by one‐way ANOVA and Dunnett’s multiple comparison test; n = 7–23; exact n and P values are shown in Appendix Table S1). Note that compound 10 is fluorescent at a similar wavelength as pHluorin, so experiments at concentrations higher than 1 µM were not possible.
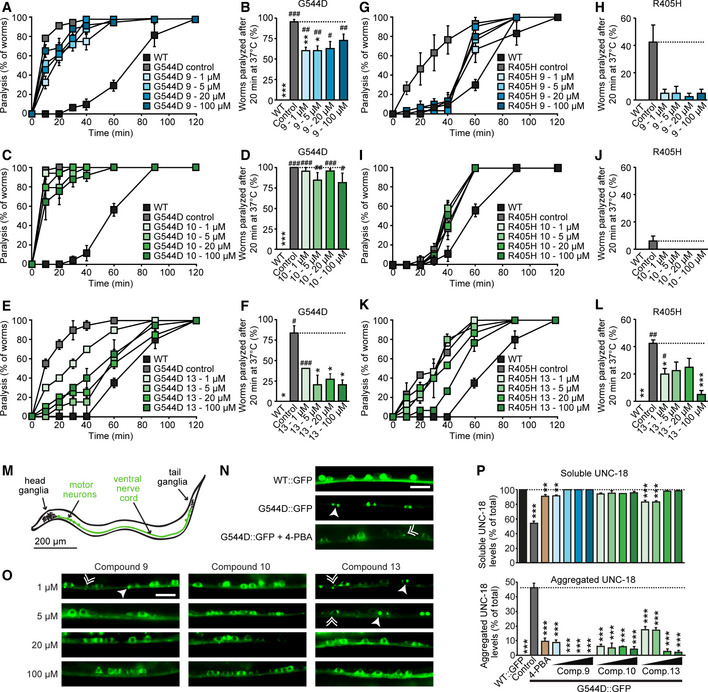
- A–L
(A, C, E, G, I, K) Heat‐induced paralysis. Indicated worm strains maintained in compounds at indicated concentrations were exposed to 37 °C over a period of 120 min, and paralysis was scored at indicated time points. Data are means ± SEM (n = 3–4 independent experiments on ten worms per experiment; exact n and P values are shown in Appendix Table S1). (B, D, F, H, J, L) Quantification of paralysis at 20 min. Data are means ± SEM (*,# P < 0.05, **,## P < 0.01, ***,### P < 0.001, # as compared to WT, * as compared to mutant by two‐way ANOVA and Dunnett’s multiple comparison test; n = 3–4 independent experiments on ten worms per experiment; exact n and P values are shown in Appendix Table S1).
- M
Image of a worm, highlighting head and tail ganglia, as well as the ventral nerve cord and motor neurons.
- N, O
Rescue of the subcellular localization of UNC‐18 in worms expressing G544D UNC‐18. C. elegans expressing WT::GFP or G544D::GFP at 1, 5, 20, or 100 µM compound were immobilized, and the ventral nerve cord was imaged. Solid arrowheads point to pairs of bigger puncta, broken arrowheads to single, smaller puncta (N, O). Scale bar in (N) and (O) = 10 µm. 4‐PBA = 4‐phenylbutyrate.
- P
Quantification of soluble and aggregated UNC‐18. Data are means ± SEM (**P < 0.01, ***P < 0.001 by one‐way ANOVA and Dunnett’s multiple comparison test; n = 3–4 worms; exact n and P values are shown in Appendix Table S1).
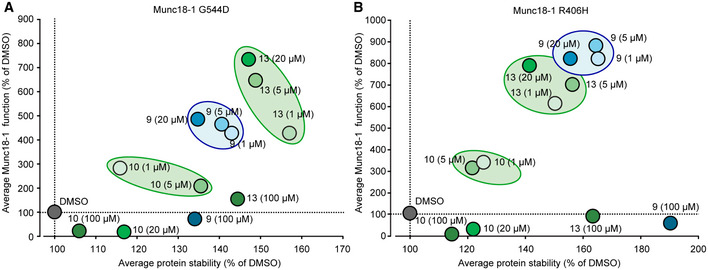
- A, B
Averaged protein stability was calculated from the data for total mutant protein levels and mutant C. elegans heat shock paralysis (Appendix Fig S2, 3 and 8). Averaged mutant Munc18‐1 function was obtained from the data for MEA plate assay, antibody uptake, and synaptopHluorin release (Appendix Fig S4 and Figs 5, 6, 7). See Materials and Methods for details.
References
-
- Archbold JK, Whitten AE, Hu SH, Collins BM, Martin JL (2014) SNARE‐ing the structures of Sec1/Munc18 proteins. Curr Opin Struct Biol 29: 44–51 - PubMed
Publication types
MeSH terms
Substances
Grants and funding
LinkOut - more resources
Full Text Sources
Medical
Molecular Biology Databases
