

A single cell atlas of the human liver tumor microenvironment
- PMID: 33332768
- PMCID: PMC7746227
- DOI: 10.15252/msb.20209682
A single cell atlas of the human liver tumor microenvironment
Abstract
Malignant cell growth is fueled by interactions between tumor cells and the stromal cells composing the tumor microenvironment. The human liver is a major site of tumors and metastases, but molecular identities and intercellular interactions of different cell types have not been resolved in these pathologies. Here, we apply single cell RNA-sequencing and spatial analysis of malignant and adjacent non-malignant liver tissues from five patients with cholangiocarcinoma or liver metastases. We find that stromal cells exhibit recurring, patient-independent expression programs, and reconstruct a ligand-receptor map that highlights recurring tumor-stroma interactions. By combining transcriptomics of laser-capture microdissected regions, we reconstruct a zonation atlas of hepatocytes in the non-malignant sites and characterize the spatial distribution of each cell type across the tumor microenvironment. Our analysis provides a resource for understanding human liver malignancies and may expose potential points of interventions.
Keywords: human cell atlas; liver cancer; single cell RNAseq; spatial transcriptomics; tumor-stroma interactions.
© 2020 The Authors. Published under the terms of the CC BY 4.0 license.
Conflict of interest statement
The authors declare that they have no conflict of interest.
Figures
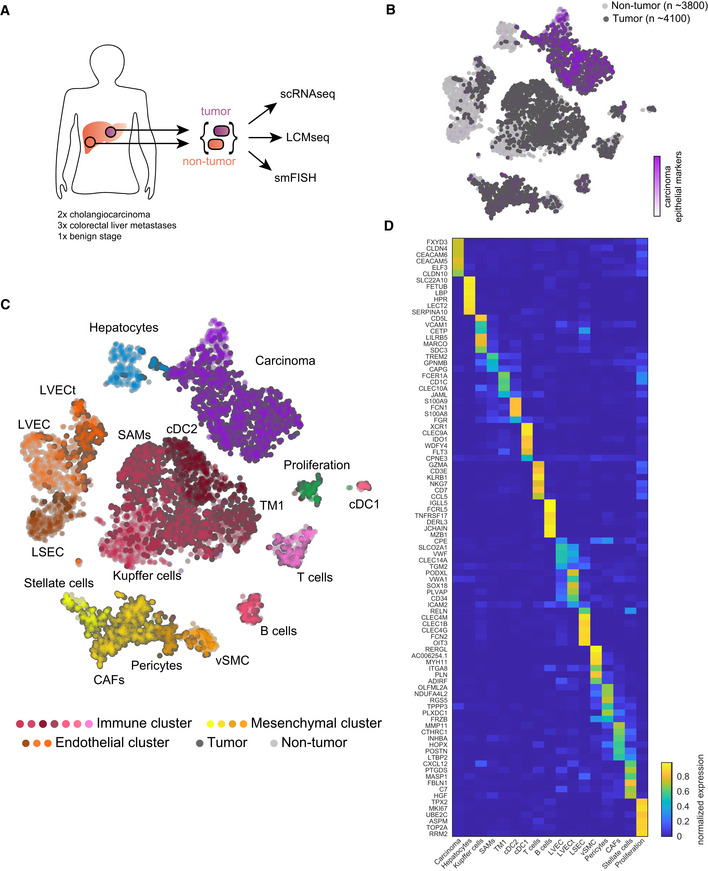
Experimental scheme, tumor, and adjacent non‐tumor liver samples from surgeries were dissociated for scRNA‐seq, frozen for LCM, and fixed for smFISH.
tSNE plot colored by normalized sum of pan‐carcinoma markers taken form Puram et al (2017). “n”—indicates the number of cells per group.
tSNE plot colored by the 17 Seurat clusters including hepatocytes, endothelial cells (liver sinusoidal endothelial cells—LSEC, non‐tumor liver vascular endothelial cells—LVEC, and tumor liver vascular endothelial cells—LVECt), mesenchymal cells (Stellate cells, cancer‐associated fibroblasts—CAFs, Pericytes, vascular smooth muscle cells—vSMC), immune cells (Kupffer cells, scar‐associated macrophages—SAMs, tissue monocytes 1—TM1, cDC1, cDC2, T cells, and B cells), proliferating cells, and carcinoma cells.
Heatmap showing the normalized expression of marker genes for the different clusters (Materials and Methods). Expression is normalized by the maximal expression among all cell types.

- A–D
Top‐left—tSNE plot of the Seurat clusters, boxes demarcate compared clusters. Dashed boxes and labels indicate the cell clusters that are compared in panels A–C. (A) Volcano plot of differential gene expression (DGE) between liver vascular endothelial cells in the tumor and non‐tumor samples. (B) Volcano plot of DGE between mononuclear phagocytes in the malignant and non‐malignant samples. (C) Volcano plot of DGE between T cells in the tumor and non‐tumor samples. (D) DGE analysis between tumor mononuclear phagocytes classified by cancer type (cholangiocarcinoma in dark purple and metastasis in light purple). Wilcoxon rank‐sum tests were used to generate P‐values, Benjamini–Hochberg multiple hypotheses correction was used to compute q‐values. Labeled dots in all panels are gene names of selected differentially expressed genes between the compared two clusters.
- A
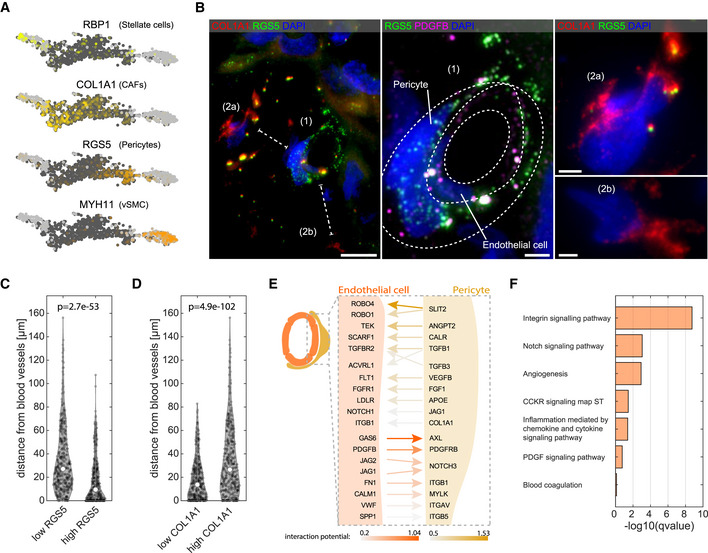
Key marker genes for the four mesenchymal clusters (RBP1, COL1A1, RGS5, and MYH11). Light gray dots denote cells originating from non‐tumor samples. Dark gray dots denote cells originating from the tumor samples.
- B
Left—Representative smFISH image of patient p1 stained for RGS5 and COL1A1 showing distinct spatial localization of CAFs and pericytes. Scale bar 10 µm. Dashed lines mark the shortest distance of cells (2a) and (2b) from the cell (1). Middle—zoom‐in of (1) from left panel, showing a blood vessel like structure formed by endothelial cells marked by PDGFB (magenta) wrapped by pericytes marked by RGS5 (green). Dashed lines are two consecutive cell layers of endothelial cells and pericytes. Scale bar 2.5 µm. Right—zoom‐in of (2a and b) from the left panel, showing two distant CAFs expressing high COL1A1 signal but not RGS5. DAPI used for nuclei staining. Scale bar 2.5 µm.
- C, D
Violin plot of the distance from blood vessels of low/high RGS5 expressing cells (n = 358 and n = 360, respectively) and low/high COL1A1 expressing cells (n = 359 and n = 359, respectively). “p” is the P‐value determined by Wilcoxon rank‐sum test. Empty circles are the medians over all repeats.
- E
Schematic representation of the top‐ranked interaction (bona‐fide) detected by NicheNet (Materials and Methods). Results are sorted by the prior interaction potential between pericytes and tumor LVECt cells.
- F
Pathway enrichment analysis for all bona‐fide genes (Dataset EV4) using Enrichr tool. Images in this figure are representative images out of eight independent experiments over four patients.
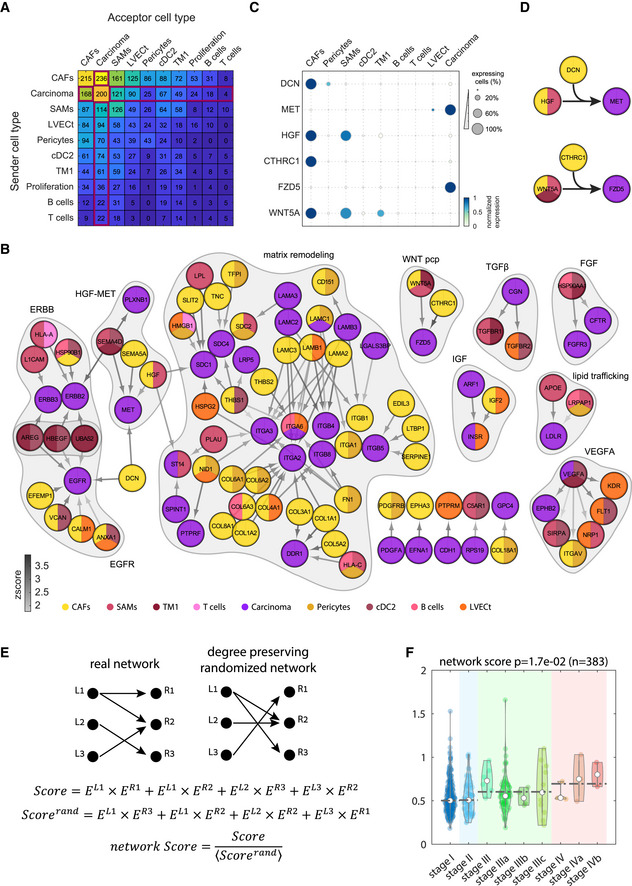
Summary of the total number of ligand–receptor interactions among clusters with at least 20% tumor cells. Interactions of tumor TME cell types with the carcinoma cluster marked by red box.
Network of recurring ligand–receptor interactions between carcinoma cells and stromal cells from the malignant sites. Node colors denote the cell type cluster in which the ligands/receptors are enriched. Gray arrows color indicates the interaction Zscore (Materials and Methods). Recurring modules are shaded. Included are all recurring interactions that significantly appeared in at least three patients.
Dot‐plot of selected genes highlight shared interaction motifs between different clusters colored by max normalized expression for each genes across all clusters in (A). For each gene, dot size represents the fraction of positive cells for each cluster.
Recurring interaction motifs between CAFs and tumor immune cells. Top—CAFs and SAMs comodulate carcinoma–stroma interaction. CAFs produce DCN that modulates the interaction between the CAF‐SAMs‐expressed ligand HGF and the carcinoma‐expressed receptor MET. Bottom—CAFs produce CTHRC1 that modulates the interaction between the WNT5A ligand, expressed by CAFs, SAMS, and TM1 and the carcinoma‐expressed receptor FZD5.
Strategy for computing interaction scores for each tumor. A score is computed as the sum of the products of all ligands and matching receptors of the recurring interaction network. These are compared to the average score obtained when randomizing the real interaction network in a manner that preserves the number of outgoing and incoming interactions of each ligand and receptor (Scorerand). The ratio of the real and randomized scores constitutes a network score.
Network score increases with increasing tumor stage. Analysis for 383 TCGA sample of liver hepatocellular carcinoma (LIHC) and cholangiocarcinoma (CHOL). P‐value determined by Wilcoxon rank‐sum test. Empty circles are the medians over all repeats. Dashed lines are the median over the tumor stage.
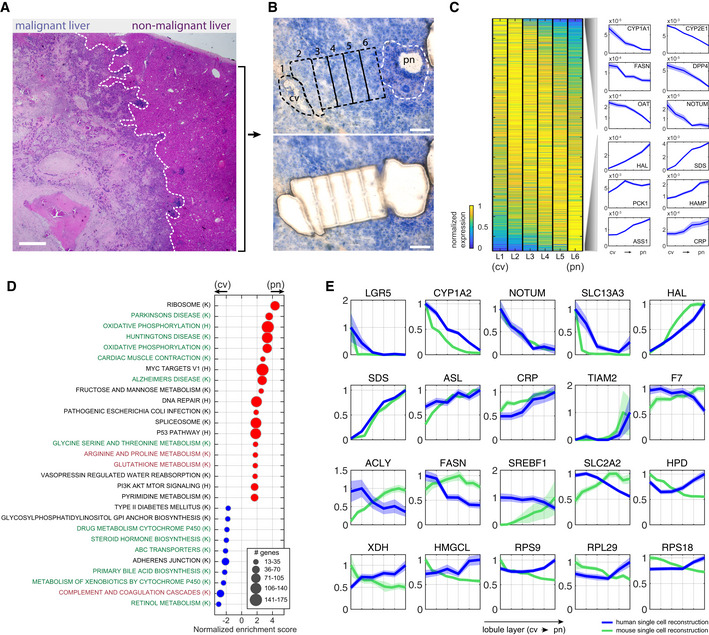
H&E staining of malignant and non‐malignant sites from patient p4, separated by the white dashed line. Scale bar is 100 µm.
Non‐malignant human liver lobule from patient p4 used for LCM stained with HistoGene Staining Solution (Materials and Methods). Top—sequential zones from the central vein (cv) to the portal node (pn) before microdissection. LCM captured zones marked by the black dashed line. White dashed line marks the boundaries of NPC (non‐parenchymal cells) located in the pn and not included in the analysis. Bottom—Tissue after microdissection. Scale bar is 100 µm.
Zonation of human hepatocytes. Left—Max normalized expression over the reconstructed six lobule layers (L1–L6), sorted by center of mass from the central vein (cv) to the portal node (pn). Right—selected pericentrally (top), and periportally (bottom) zonated genes. Blue patches are standard errors of the mean.
Gene set enrichment analysis of genes with maximal expression above 1e‐5 normalized UMI counts. Centrally (cv) enriched sets are marked with blue dots, and portally (pn) enriched sets are marked with red dots. Green fonts denote pathways that are concordantly zonated in mouse, black fonts denote pathways that are not zonated in mouse, and red fonts denote pathways that are inversely zonated in mouse. “K” denotes gene sets obtained from KEGG database, and “H” denotes gene sets obtained from Hallmarks database.
Zonation profiles of selected genes from human (blue) and mouse (green). Each profile is normalized by the maximal expression across zones. Patches are standard errors of the mean.
- A, B
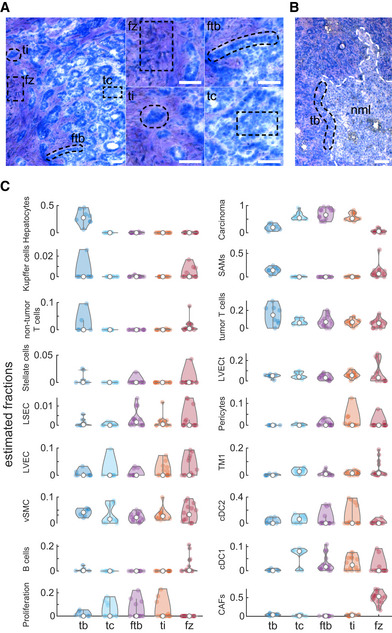
Tissue sections from patients p1 and p3 stained with HistoGene Staining Solution. Laser‐captured zones are marked with dashed black line including: tumor core (tc), the border between the tumor and the fibrotic regions (ftb), tumor islets within the fibrotic regions (ti) and fibrotic zones (fz) in panel (A), and tumor border (tb) in panel (B). Small images in (A) are magnifications of the corresponding zones in the large image for the left. White dashed line in (B) marking the non‐malignant liver (nml) border. Scale bars in all panels are 100 µm.
- C
Spatial distribution of the different TME populations across the analyzed five zones. Values are the estimated proportions based on deconvolution of the transcriptome of each zone with the average transcriptome of the cell types (Materials and Methods). Y‐axes show the estimated fractions of the cells, and empty circles are the medians over all repeats (n = 8 for tb, 11 for tc, 15 for ftb, 14 for ti and 15 for fz).
References
-
- Annika A, Alexandra A, Christer B (2005) Endothelial/Pericyte Interactions. Circ Res 97: 512–523
Publication types
MeSH terms
Associated data
- Actions
Grants and funding
LinkOut - more resources
Full Text Sources
Other Literature Sources
Medical
Molecular Biology Databases
