Multicenter Study
. 2021 Jun 15;203(12):1488-1502.
doi: 10.1164/rccm.202009-3448OC.

Inflammatory Endotype-associated Airway Microbiome in Chronic Obstructive Pulmonary Disease Clinical Stability and Exacerbations: A Multicohort Longitudinal Analysis

Affiliations
Multicenter Study

Inflammatory Endotype-associated Airway Microbiome in Chronic Obstructive Pulmonary Disease Clinical Stability and Exacerbations: A Multicohort Longitudinal Analysis

Zhang Wang et al. Am J Respir Crit Care Med. .

Abstract

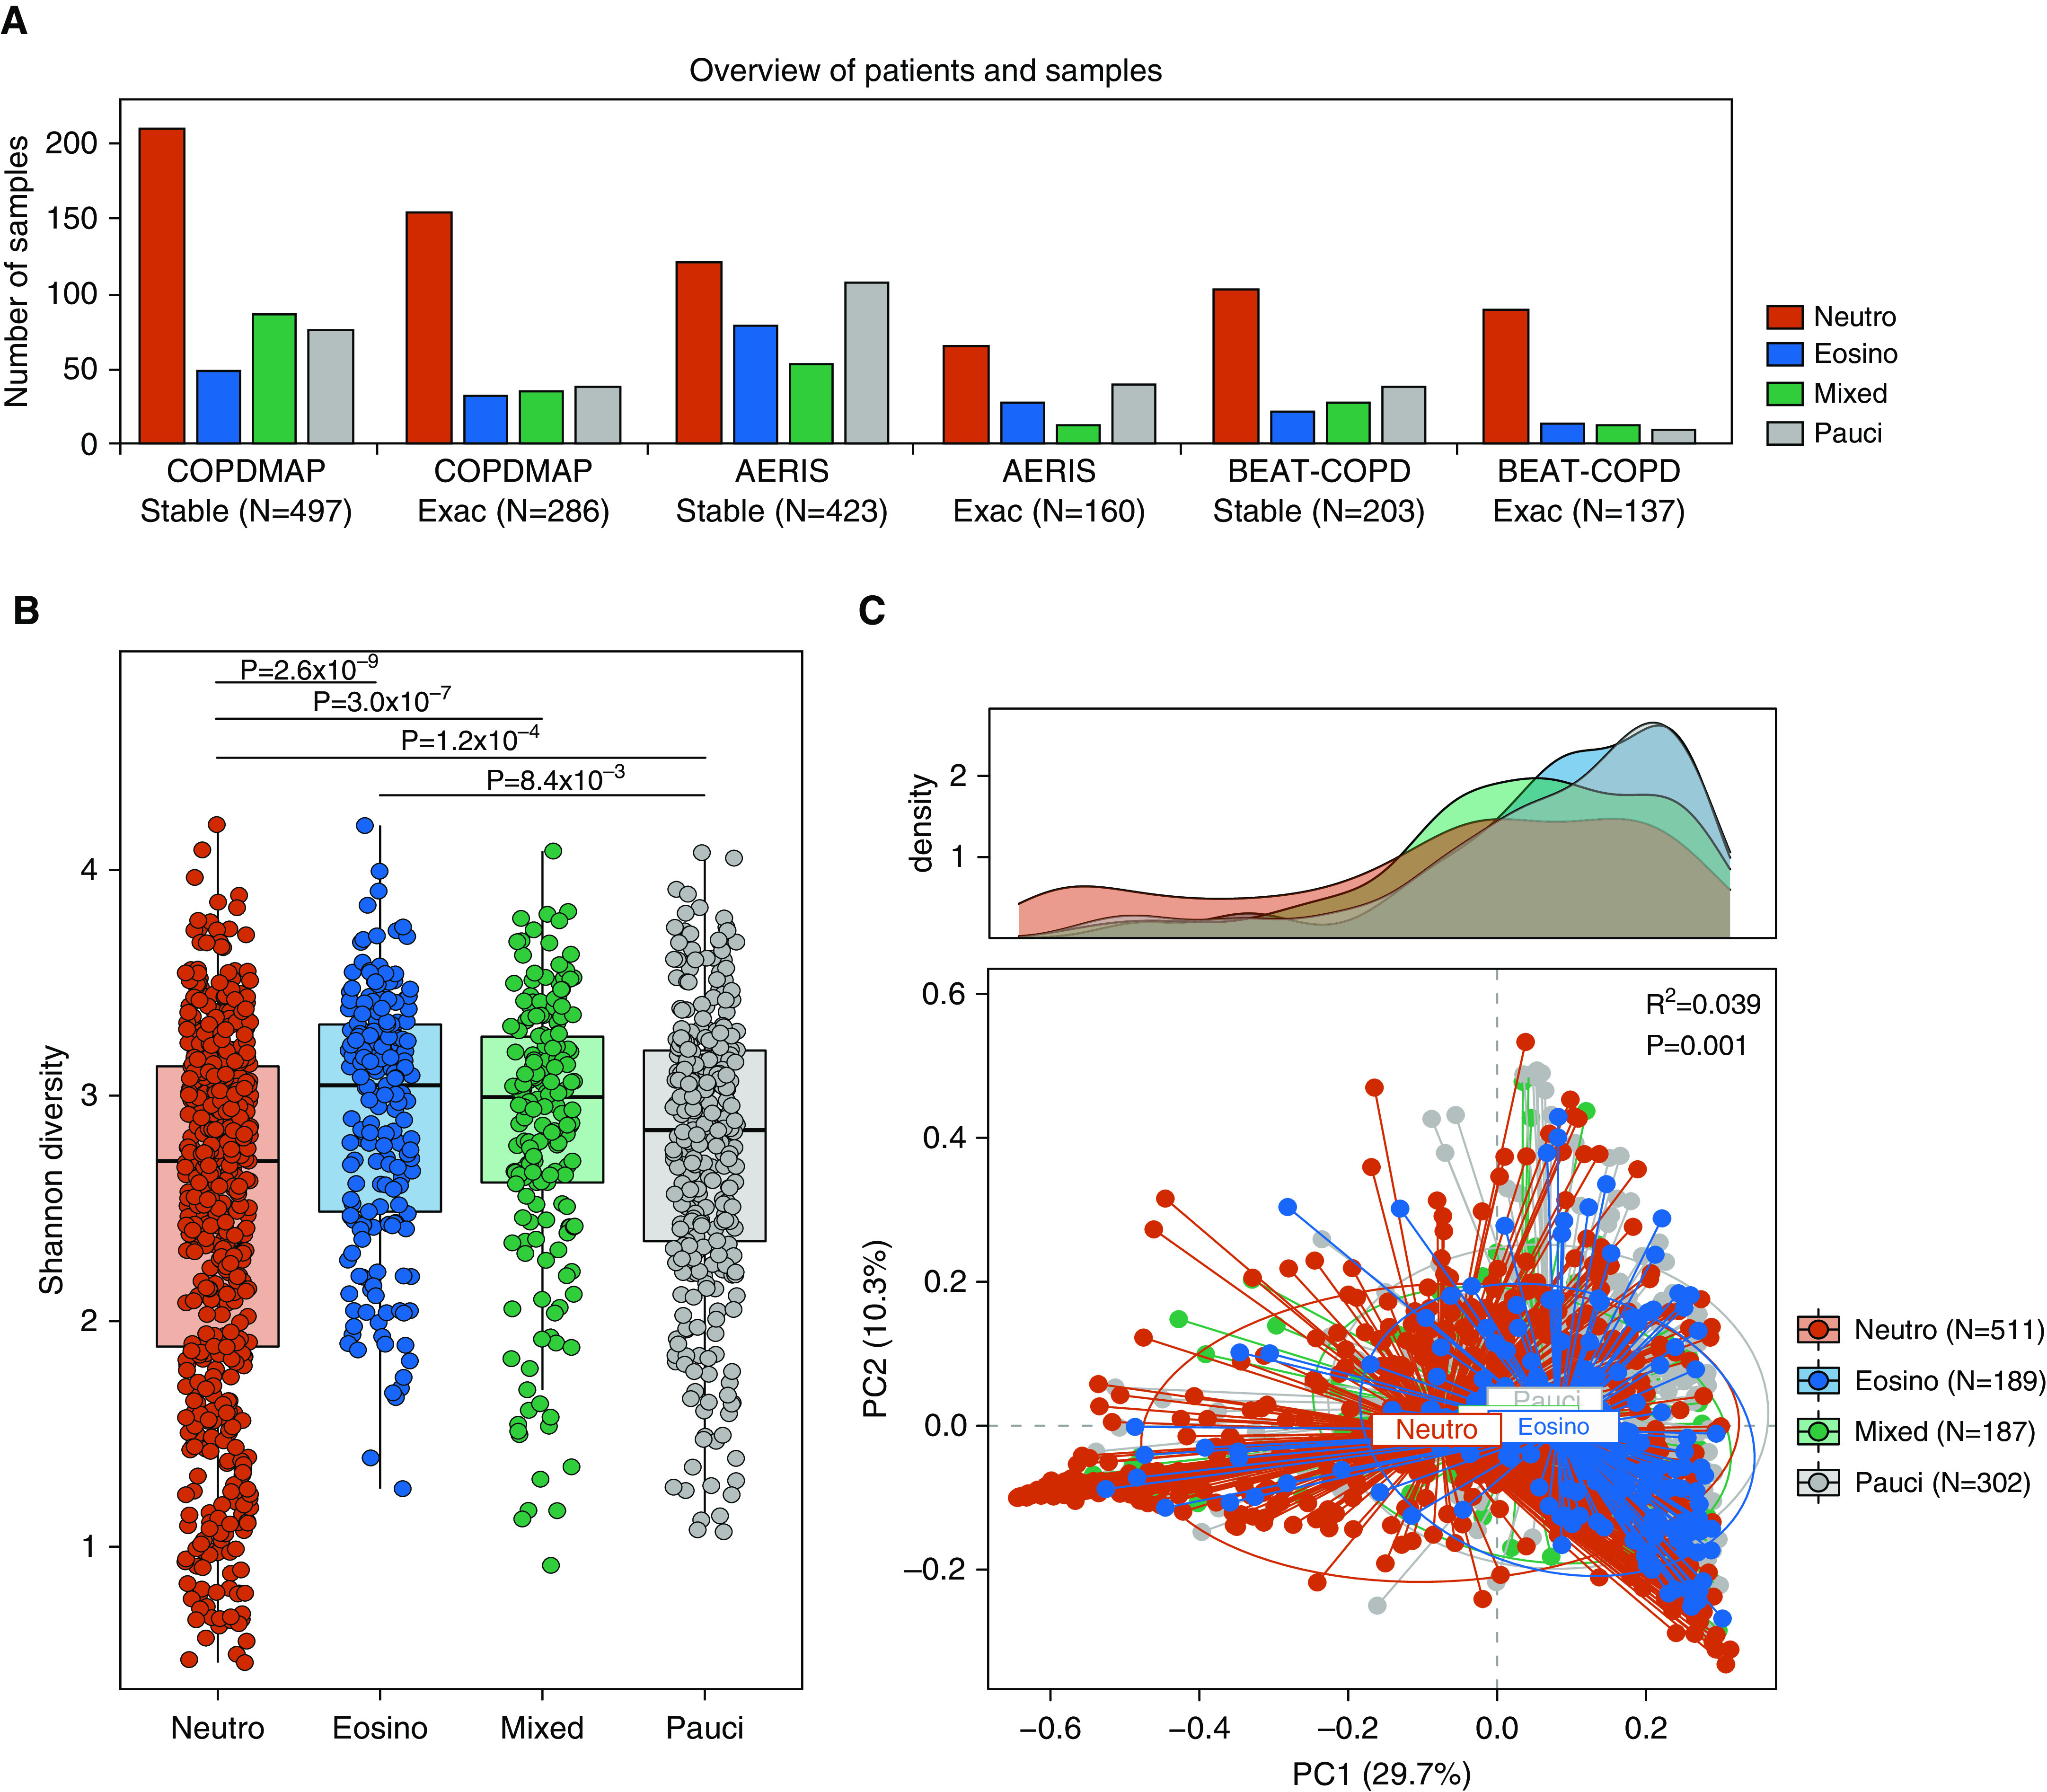
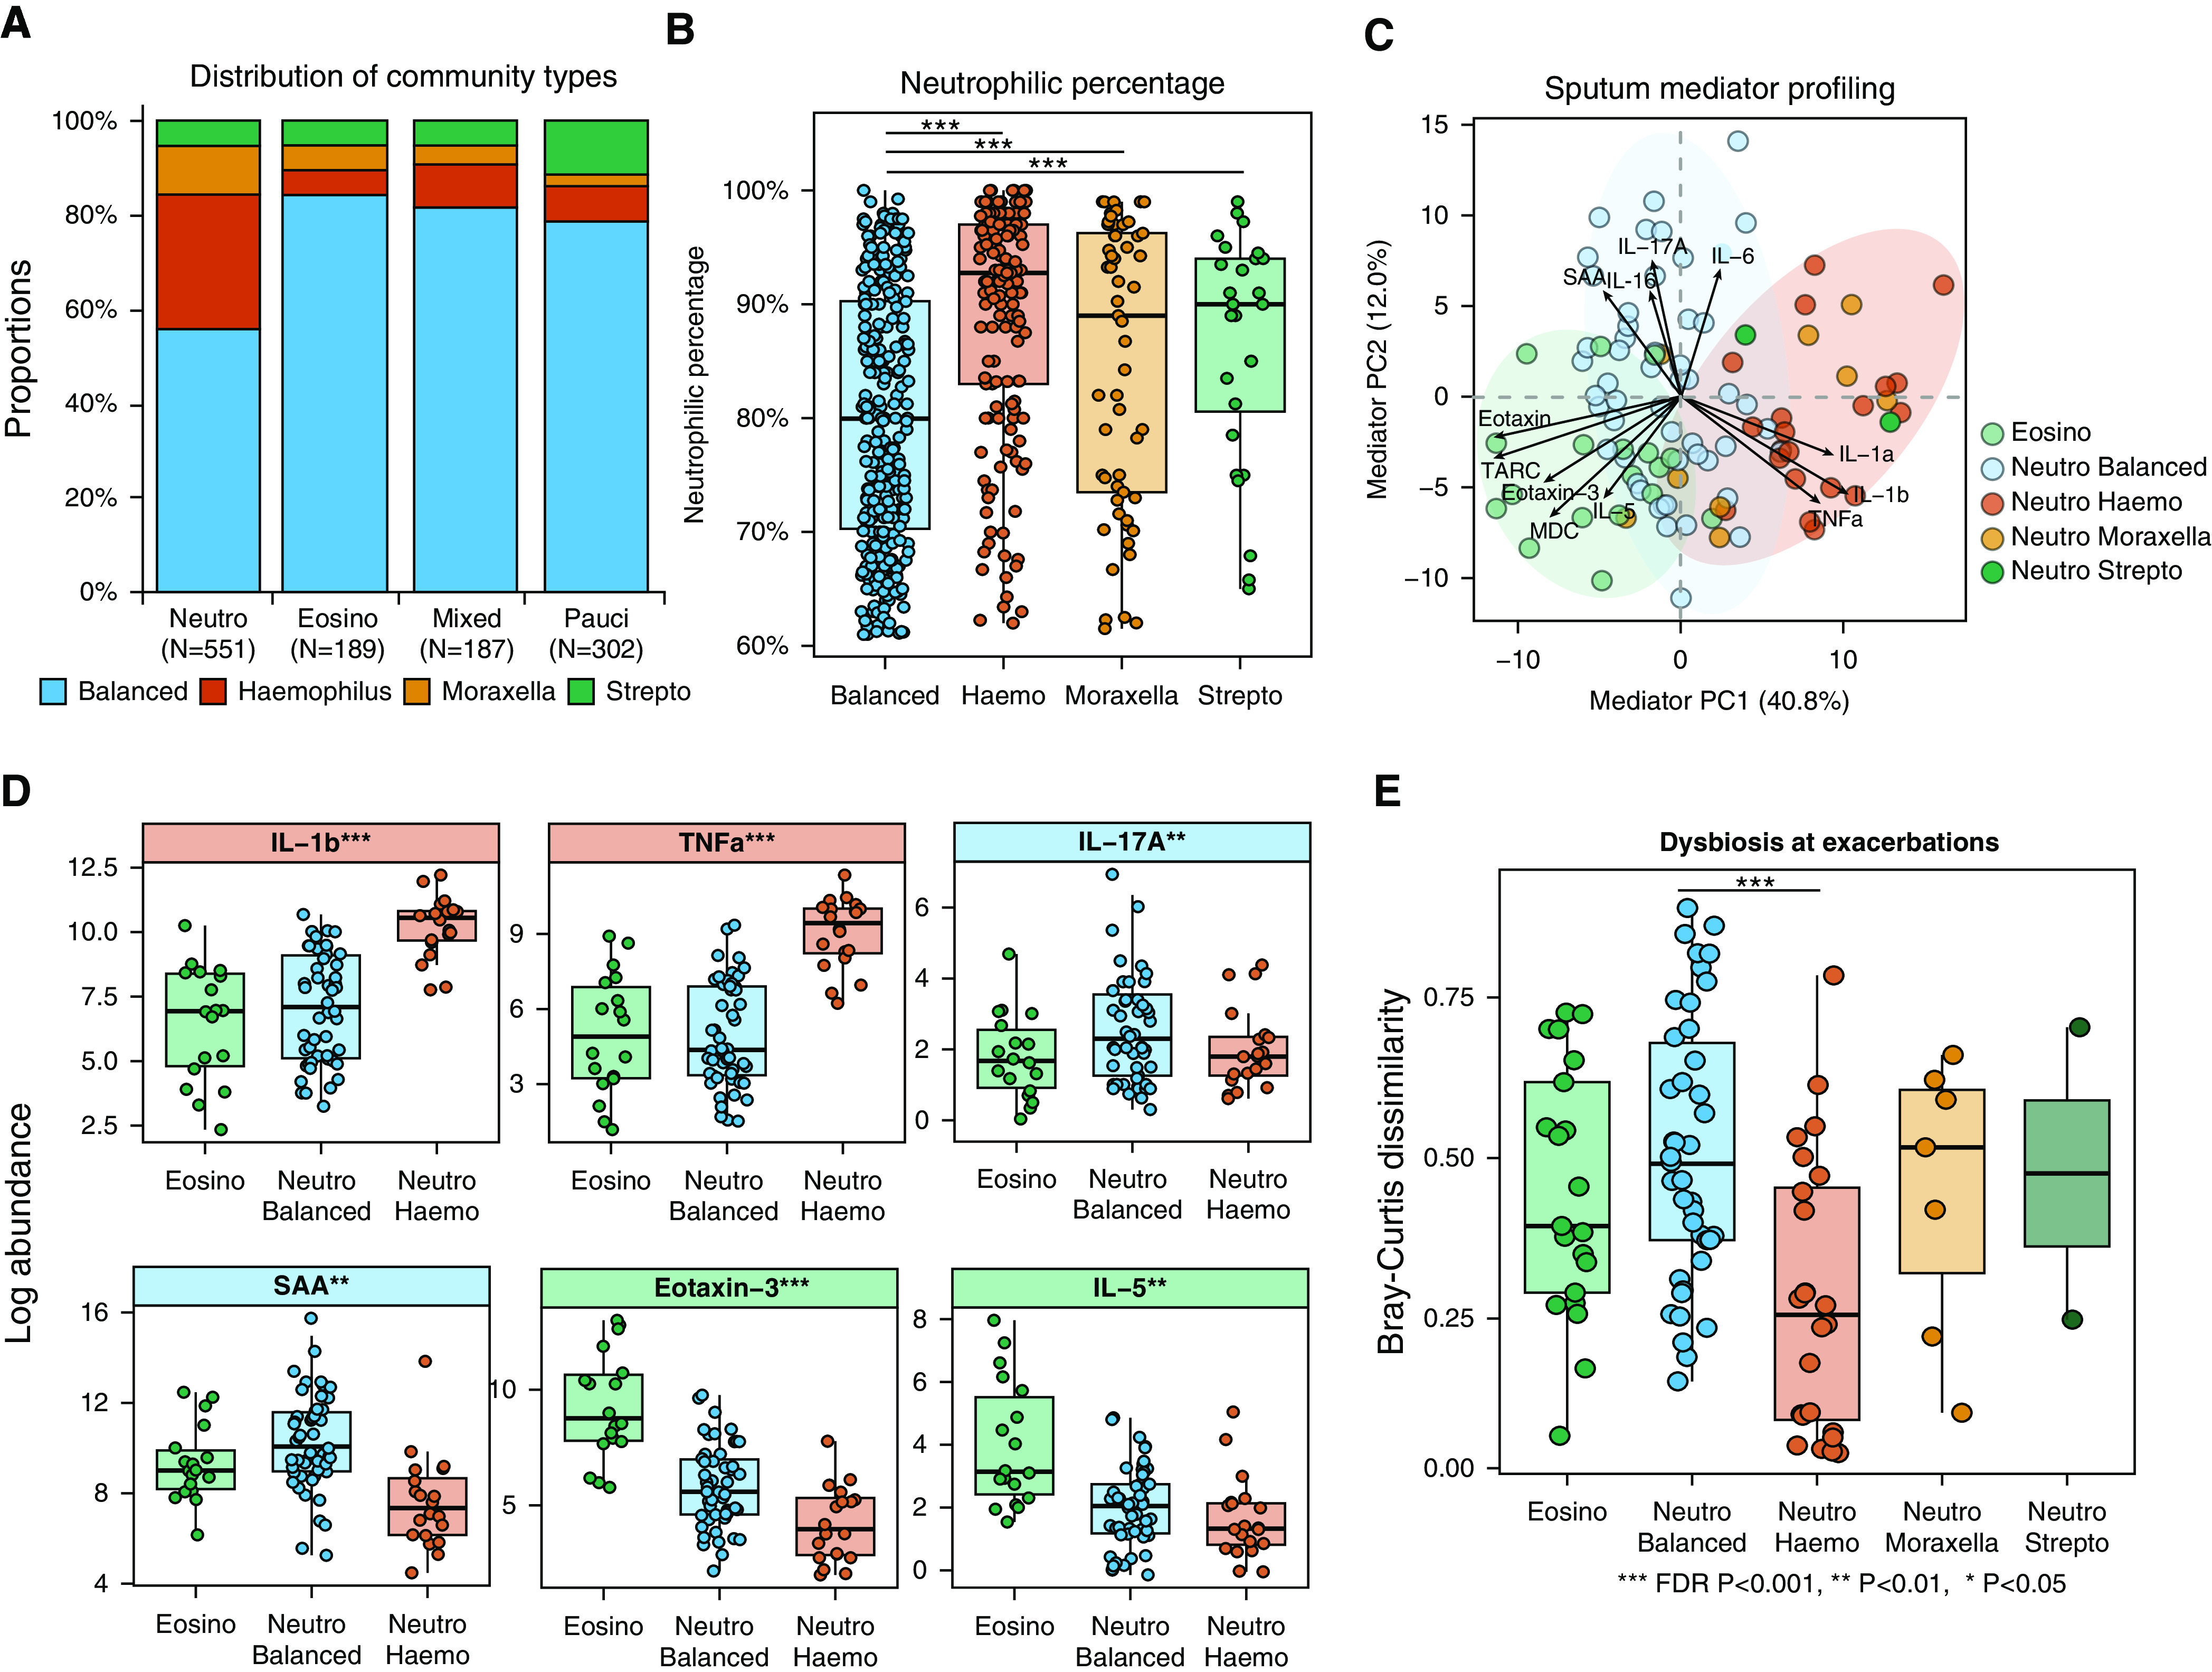
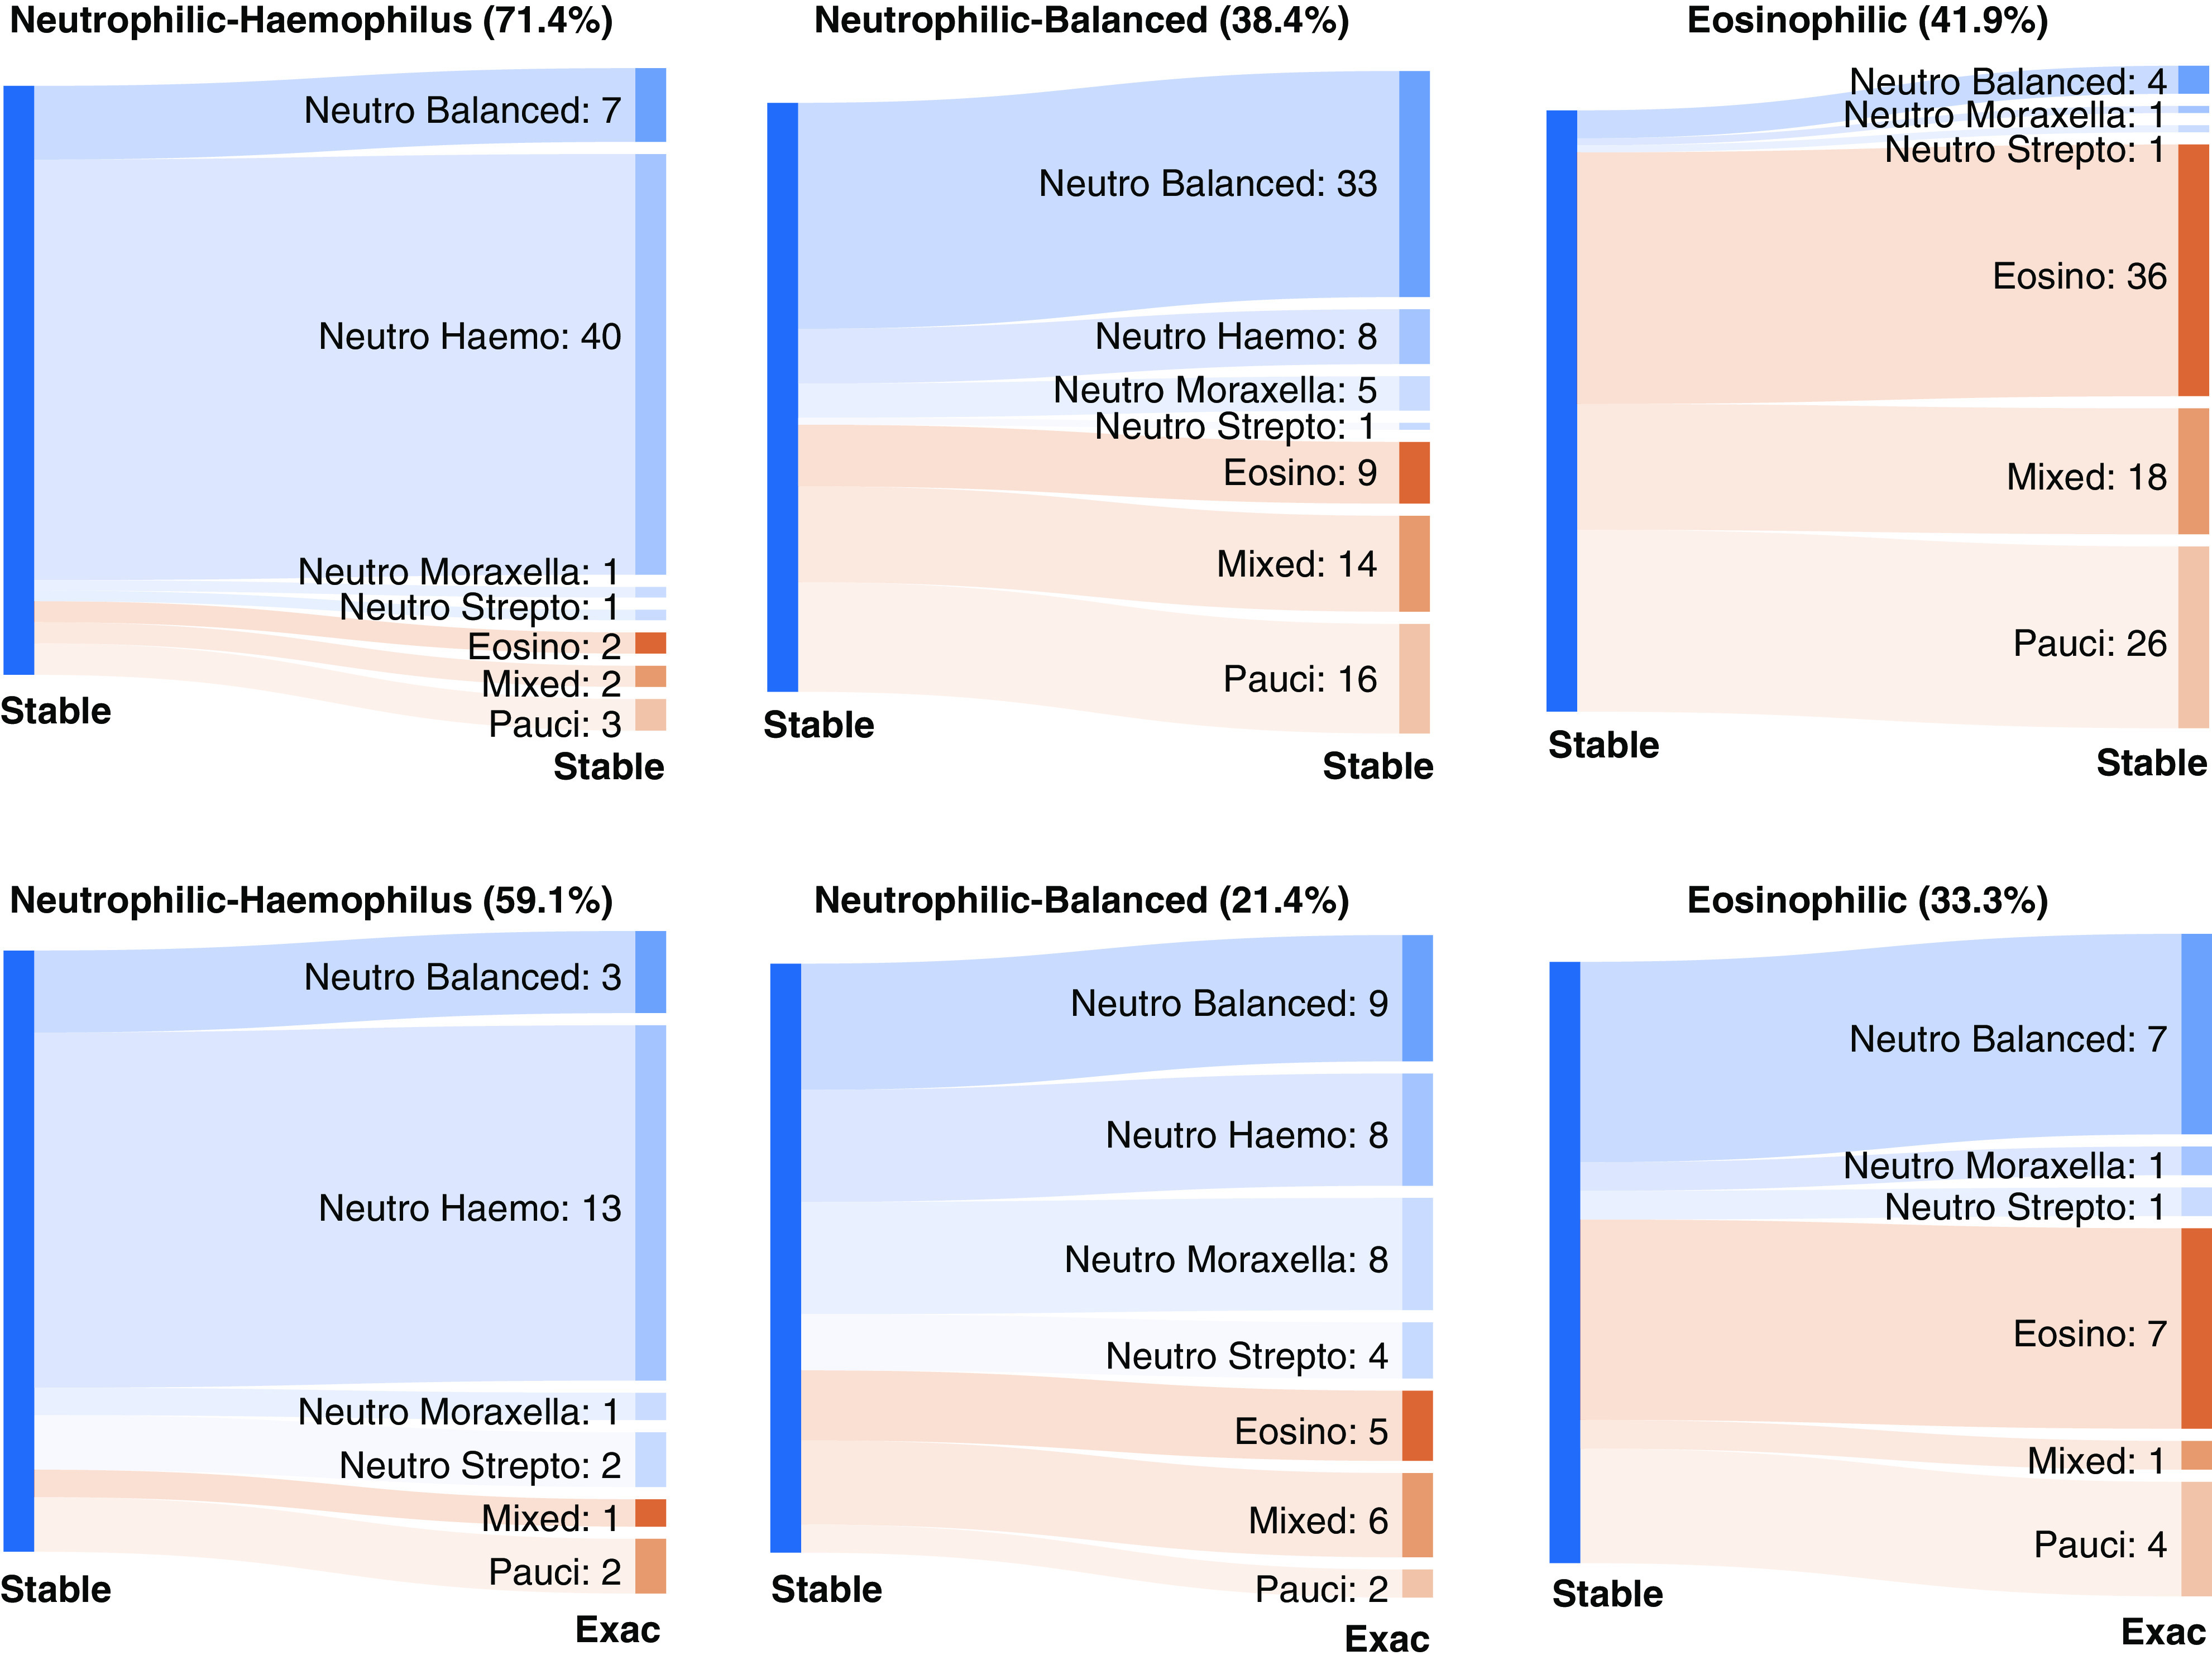
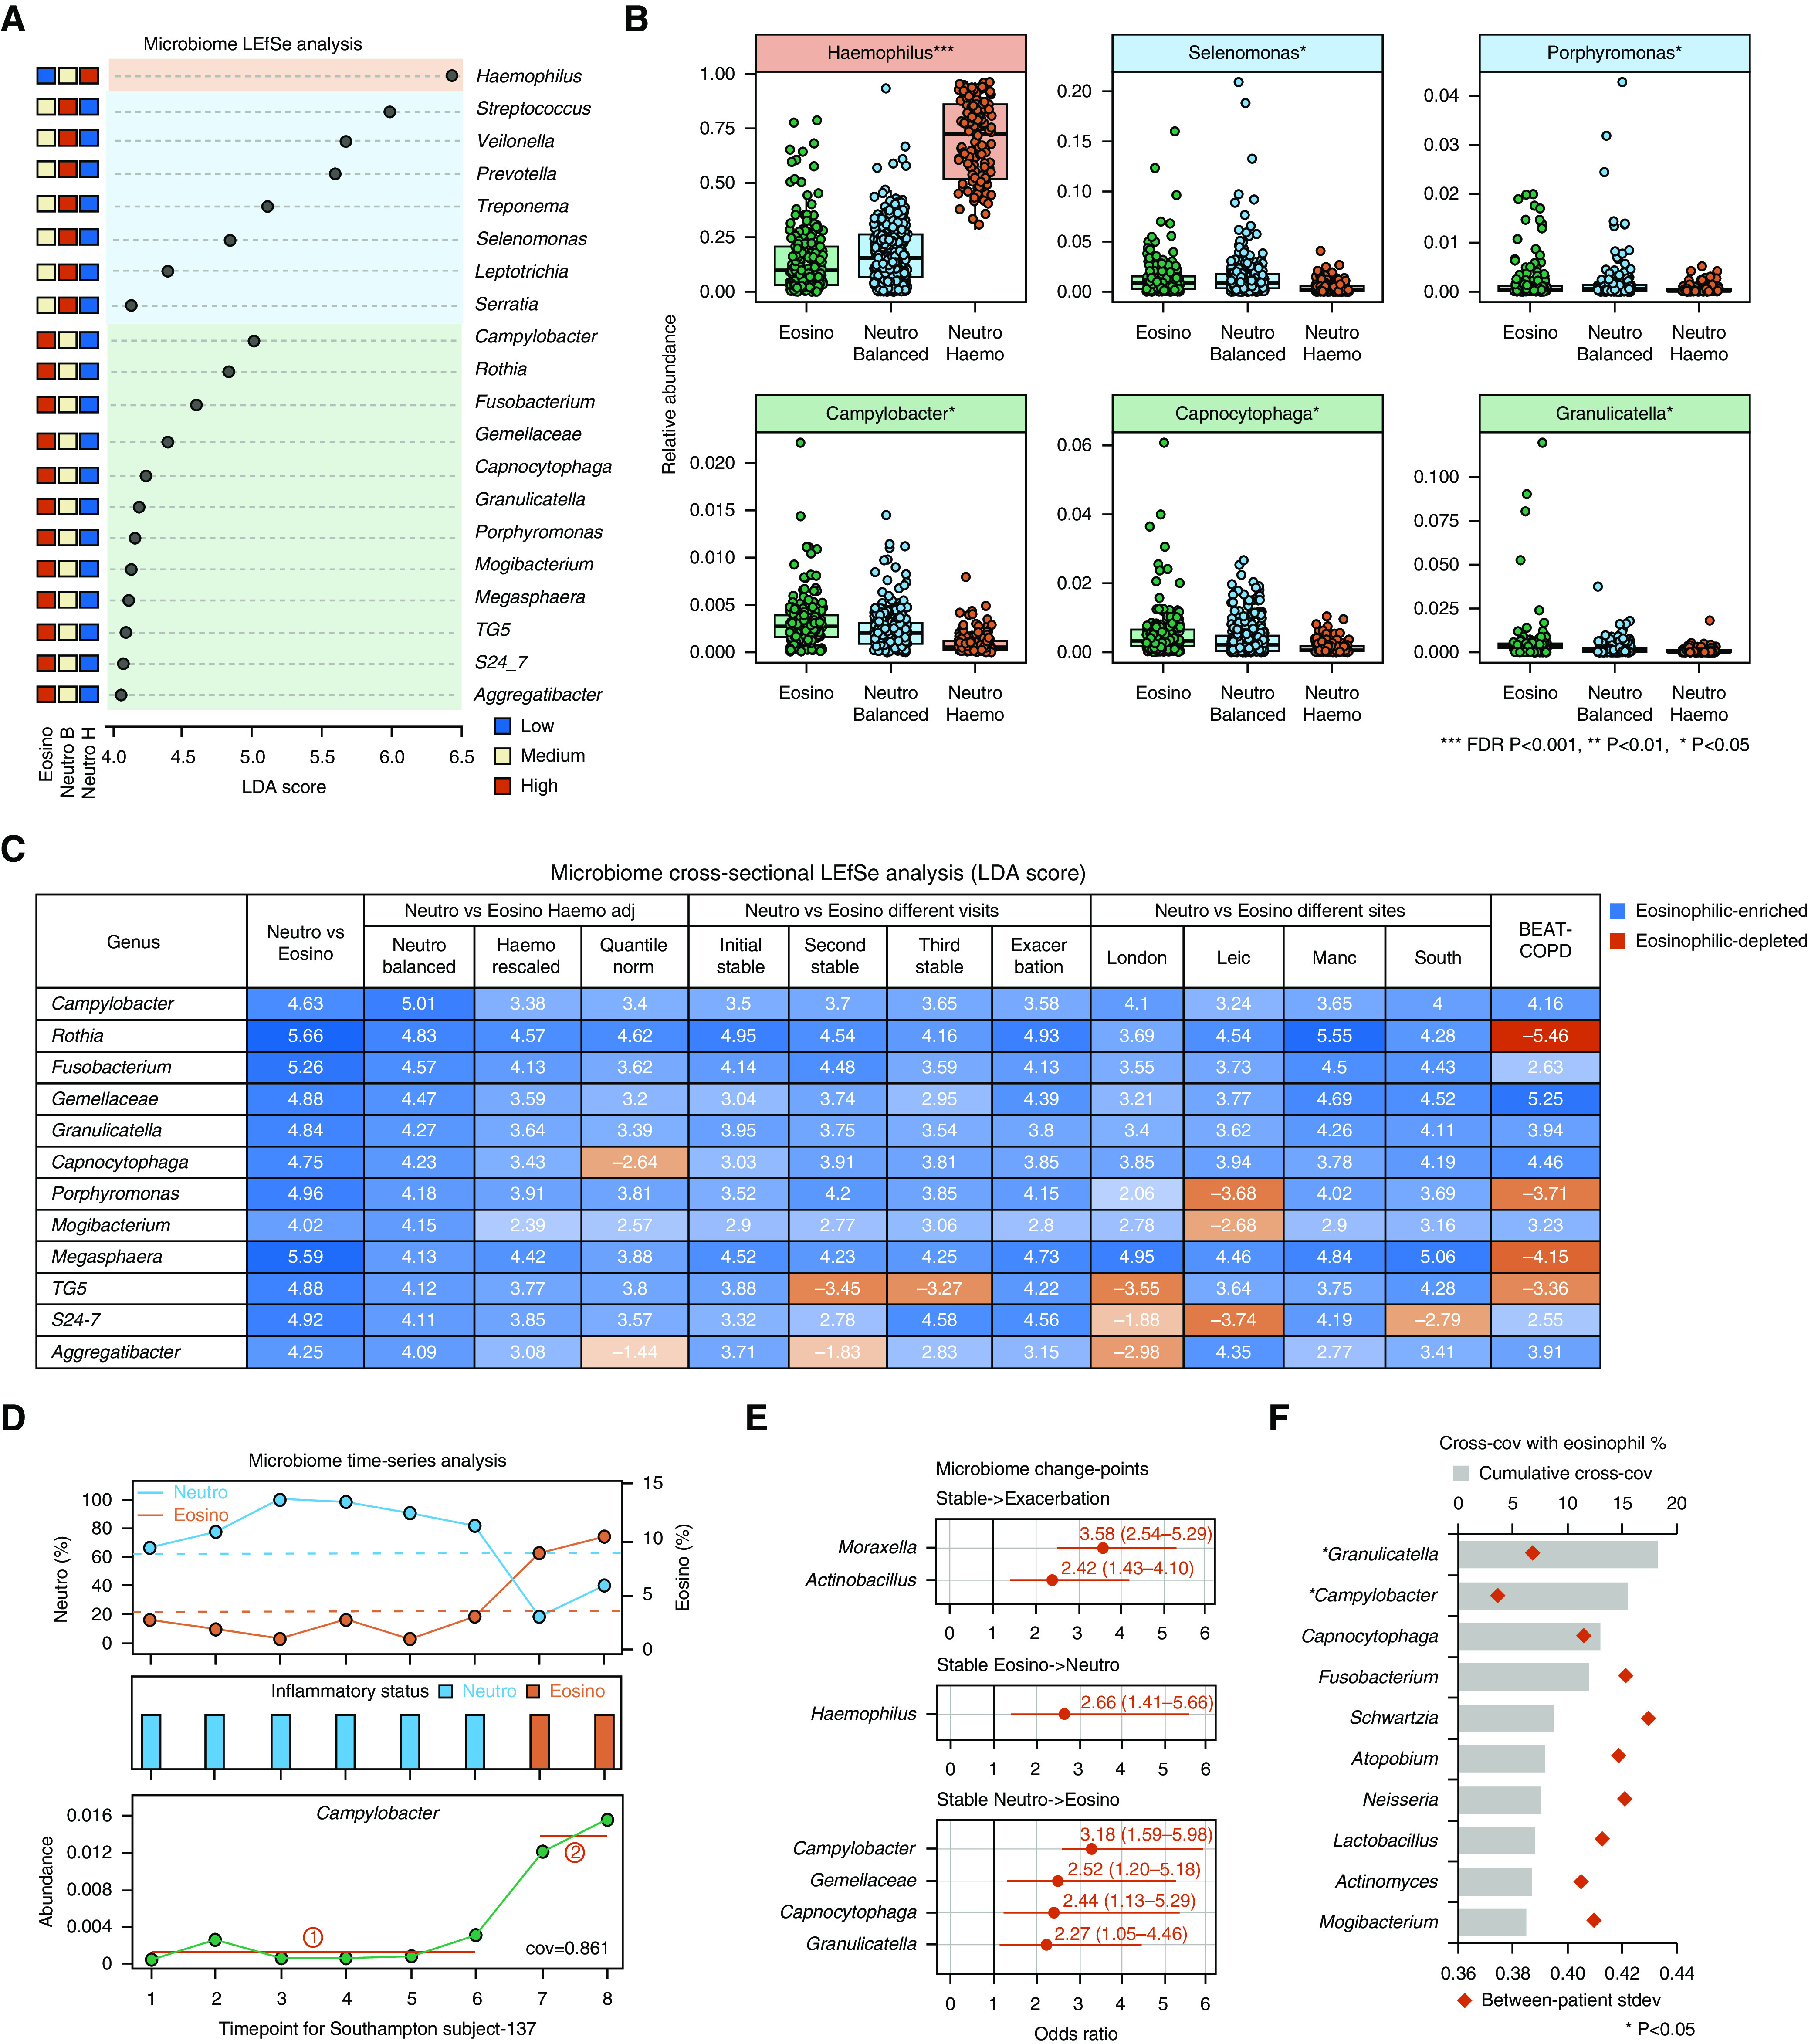
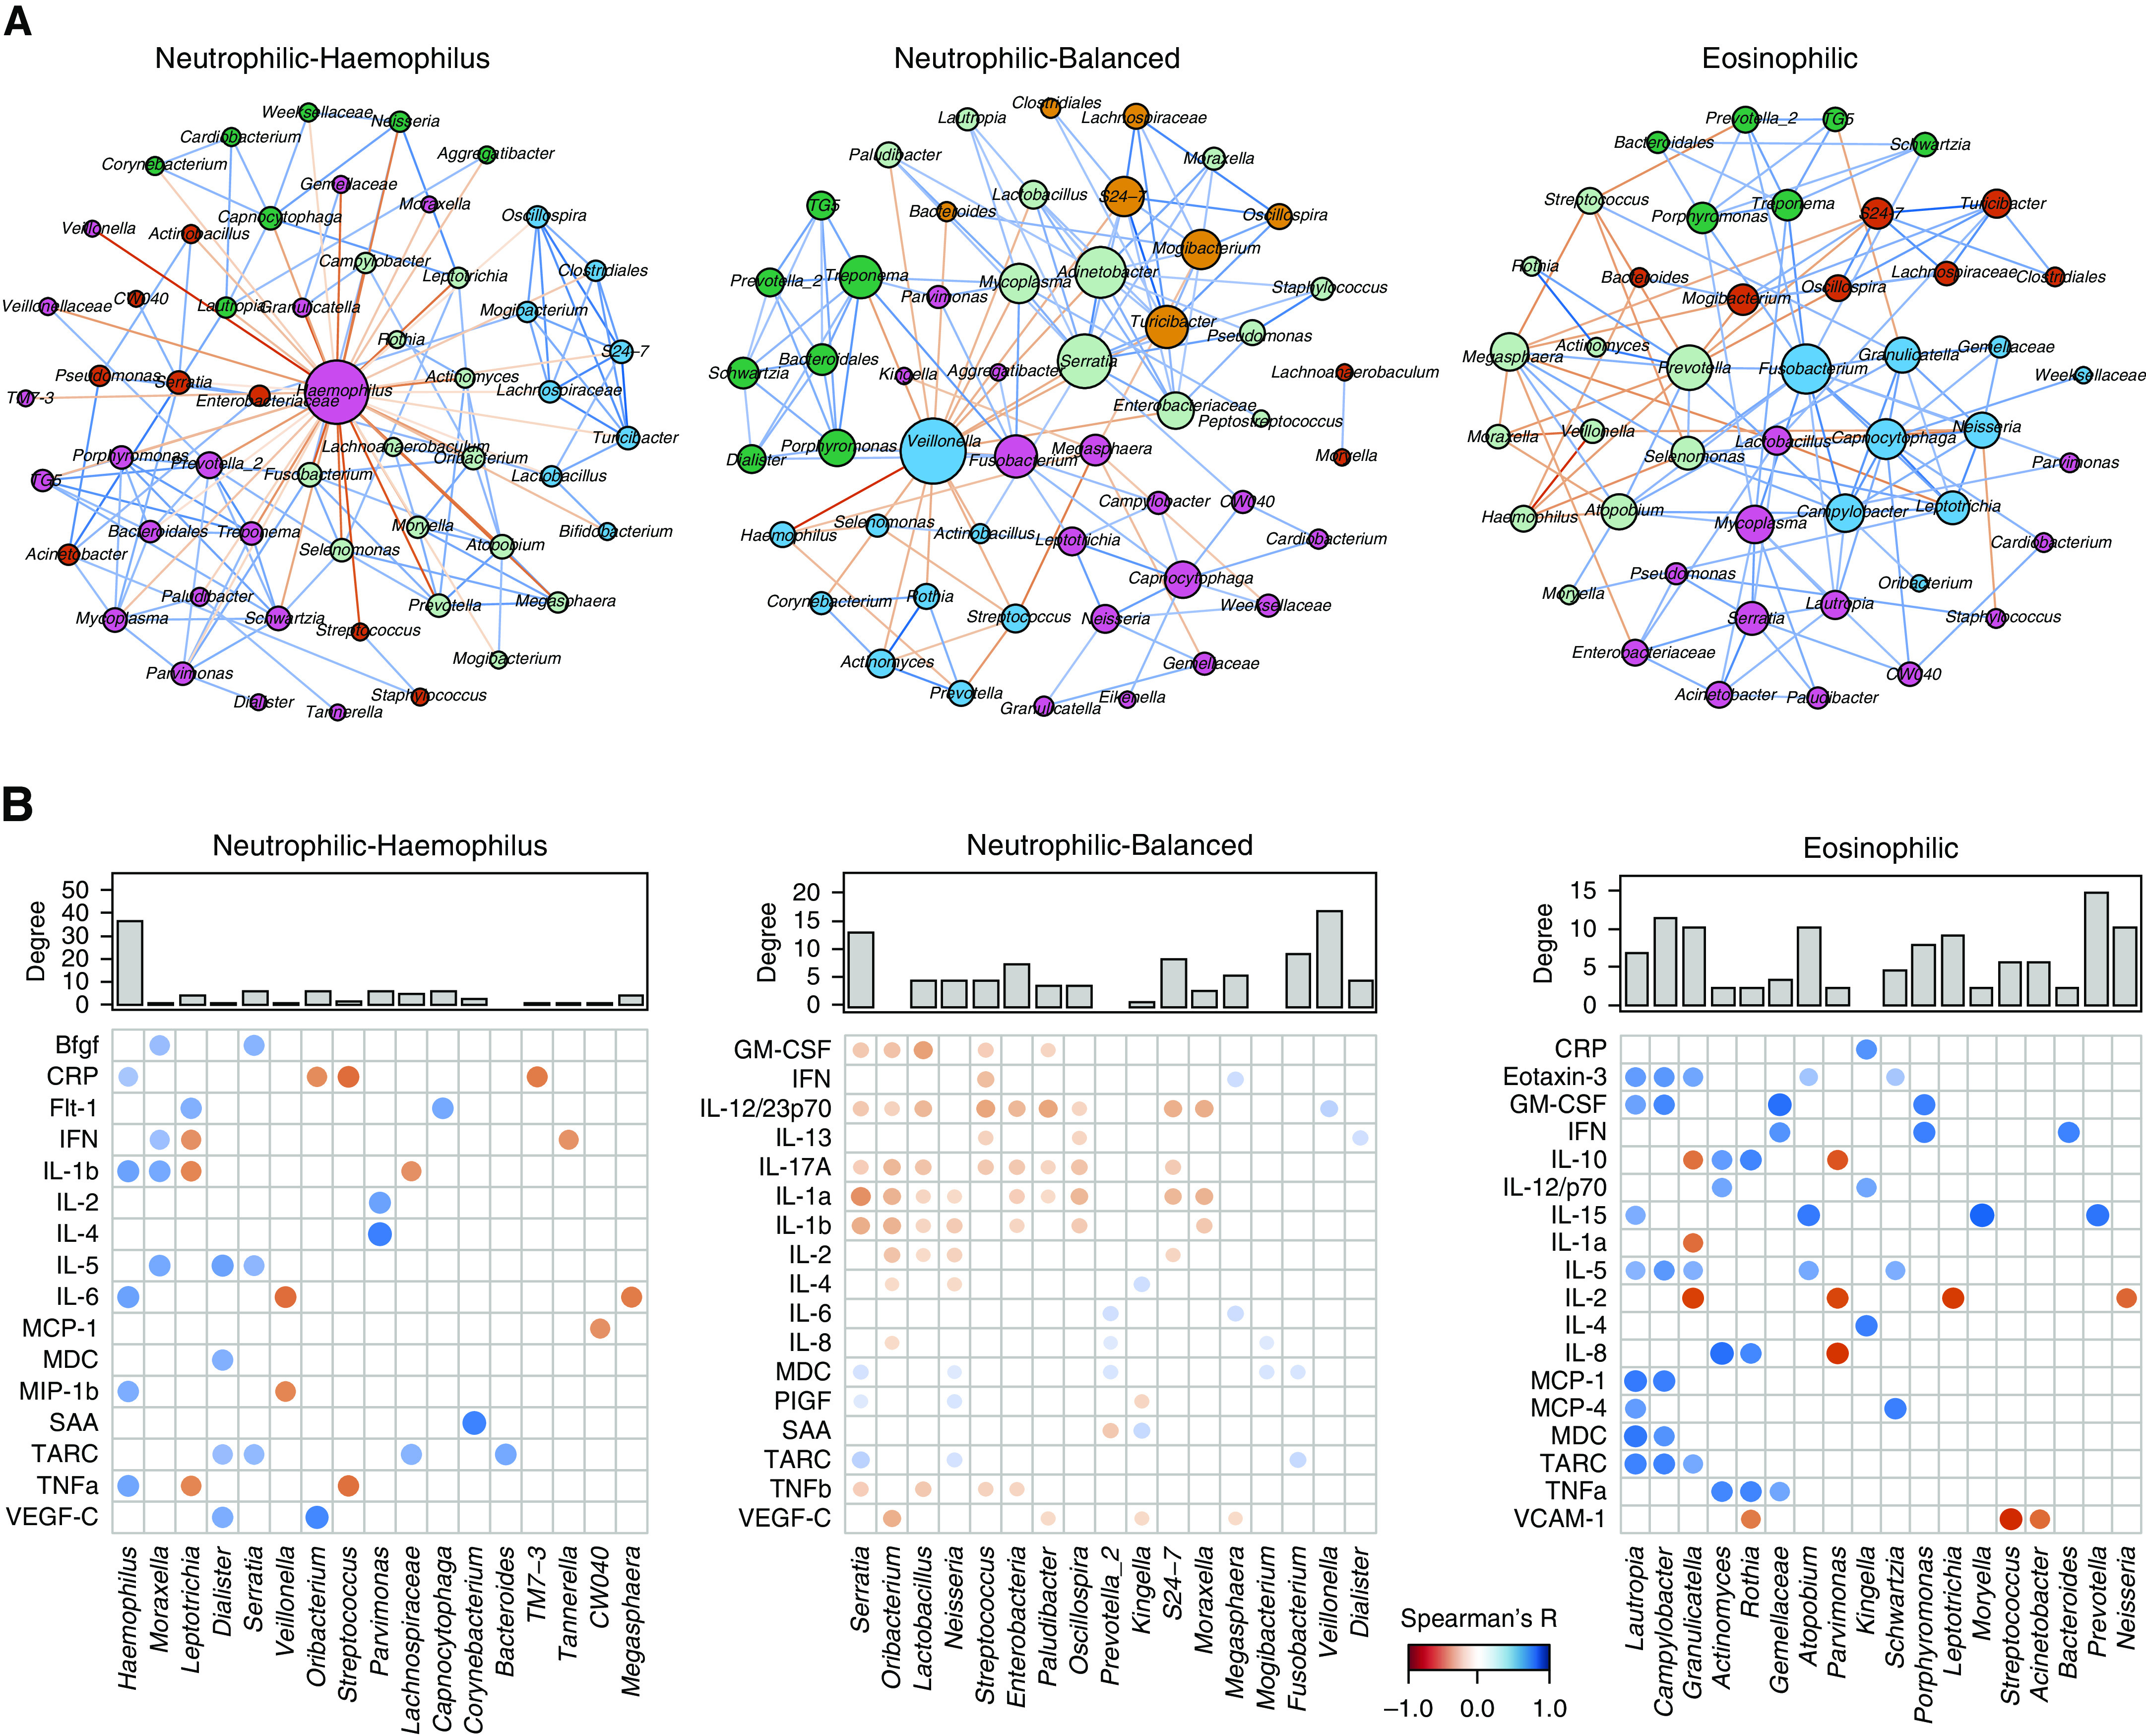
Rationale: Understanding the role of the airway microbiome in chronic obstructive pulmonary disease (COPD) inflammatory endotypes may help to develop microbiome-based diagnostic and therapeutic approaches. Objectives: To understand the association of the airway microbiome with neutrophilic and eosinophilic COPD at stability and during exacerbations. Methods: An integrative analysis was performed on 1,706 sputum samples collected longitudinally from 510 patients with COPD recruited at four UK sites of the BEAT-COPD (Biomarkers to Target Antibiotic and Systemic COPD), COPDMAP (Chronic Obstructive Pulmonary Disease Medical Research Council/Association of the British Pharmaceutical Industry), and AERIS (Acute Exacerbation and Respiratory Infections in COPD) cohorts. The microbiome was analyzed using COPDMAP and AERIS as a discovery data set and BEAT-COPD as a validation data set. Measurements and Main Results: The airway microbiome in neutrophilic COPD was heterogeneous, with two primary community types differentiated by the predominance of Haemophilus. The Haemophilus-predominant subgroup had elevated sputum IL-1β and TNFα (tumor necrosis factor α) and was relatively stable over time. The other neutrophilic subgroup with a balanced microbiome profile had elevated sputum and serum IL-17A and was temporally dynamic. Patients in this state at stability were susceptible to the greatest microbiome shifts during exacerbations. This subgroup can temporally switch to both neutrophilic Haemophilus-predominant and eosinophilic states that were otherwise mutually exclusive. Time-series analysis on the microbiome showed that the temporal trajectories of Campylobacter and Granulicatella were indicative of intrapatient switches from neutrophilic to eosinophilic inflammation, in track with patient sputum eosinophilia over time. Network analysis revealed distinct host-microbiome interaction patterns among neutrophilic Haemophilus-predominant, neutrophilic balanced microbiome, and eosinophilic subgroups. Conclusions: The airway microbiome can stratify neutrophilic COPD into subgroups that justify different therapies. Neutrophilic and eosinophilic COPD are interchangeable in some patients. Monitoring temporal variability of the airway microbiome may track patient inflammatory status over time.

Keywords: airway microbiome; chronic obstructive pulmonary disease; cytokines; inflammatory endotypes; unbiased clusters.


Figures

Figure 1.
Figure 1.
The airway microbiome in neutrophilic (Neutro) and eosinophilic (Eosino) chronic obstructive pulmonary disease (COPD). (A) The number of sputum samples in Neutro, Eosino, mixed, and paucigranulocytic (Pauci) subgroups across stability and exacerbations in the COPDMAP (COPD Medical Research Council/Association of the British Pharmaceutical Industry), AERIS (Acute Exacerbation and Respiratory Infections in COPD), and BEAT-COPD (Biomarkers to Target Antibiotic and Systemic COPD) cohorts. (B) Shannon diversity of the airway microbiome in sputum samples in the Neutro, Eosino, mixed, and Pauci subgroups. A significantly reduced α diversity was observed for the Neutro subgroup compared with the other groups. (C) Principal coordinate (PC) analysis based on Bray-Curtis dissimilarity for samples in four inflammatory subgroups. The microbiome significantly differed across the four groups (permutational ANOVA, R2 = 0.039, P = 0.001). The density plot showed a more diverse PC1 distribution for the Neutro subgroup than for the other groups.
Figure 2.
Figure 2.
The microbiome in neutrophilic (Neutro) chronic obstructive pulmonary disease (COPD) was heterogeneous. (A) The distribution of four community types across Neutro, eosinophilic (Eosino), mixed, and paucigranulocytic (Pauci) subgroups in the COPDMAP (COPD Medical Research Council/Association of the British Pharmaceutical Industry) and AERIS (Acute Exacerbation and Respiratory Infections in COPD) cohorts. (B) The sputum Neutro percentage in Neutro samples across four community types in the COPDMAP and AERIS cohorts. There was a significantly decreased Neutro percentage in the Neutro balanced subgroup compared with the other subgroups. (C) Principal component analysis on sputum mediators for the Neutro and Eosino subgroups in COPDMAP. Neutro samples were further colored according to their microbiome community types. The Neutro Haemophilus (Haemo), Neutro balanced, and Eosino subgroups were clustered separately. (D) Box-and-whisker plots showing the sputum mediators most elevated in the Neutro Haemo, Neutro balanced, and Eosino subgroups in COPDMAP. (E) The greatest Bray-Curtis dissimilarity for paired stability–exacerbation samples in the Neutro balanced subgroup compared with the other subgroups in the COPDMAP and AERIS cohorts, indicating the greatest microbiome shifts during exacerbations in this subgroup. *False discovery rate (FDR) P < 0.05, **FDR P < 0.01, and ***FDR P < 0.001. PC = principal component; SAA = serum amyloid A; Strepto = Streptococcus.
Figure 3.
Figure 3.
The neutrophilic (Neutro) balanced microbiome subgroup was temporally dynamic. Sankey diagrams showing the temporal transition pattern for Neutro Haemophilus (Haemo), Neutro balanced, and eosinophilic (Eosino) states within stable disease (Stable–Stable) and between stability and exacerbation (Exac) (Stable–Exac) in the COPDMAP (COPD Medical Research Council/Association of the British Pharmaceutical Industry) and AERIS (Acute Exacerbations and Respiratory Infections in COPD) cohorts. The width of the band is proportional to the number of samples transitioned to the corresponding subgroup. The proportion of samples that remained in the same state is indicated in parentheses. The Neutro balanced subgroup was interchangeable with both Neutro Haemo and Eosino subgroups that were otherwise mostly mutually exclusive. Pauci = paucigranulocytic; Strepto = Streptococcus.
Figure 4.
Figure 4.
Specific nondominant microbiome genera were associated with eosinophilia. (A) Linear discriminant analysis (LDA) effect size (LEfSe) analysis showing microbiome genera specifically enriched in neutrophilic (Neutro) Haemophilus (Haemo), Neutro balanced (B), and eosinophilic (Eosino) subgroups (LDA > 4.0, false discovery rate [FDR] P < 0.05). The average relative abundances ranked from high to low are shown for each genus across the three subgroups in the COPDMAP (Chronic Obstructive Pulmonary Disease [COPD] Medical Research Council/Association of the British Pharmaceutical Industry) and AERIS (Acute Exacerbation and Respiratory Infections in COPD) cohorts. (B) Box-and-whisker plots showing microbiome genera most enriched in each subgroup (LDA, FDR P < 0.05). (C) LEfSe analysis showing enrichment (blue) or depletion (red) of the 12 genera in the Eosino versus Neutro group in multiple analyses by 1) comparing the Eosino and Neutro B subgroups and using two additional approaches to control for Haemo overgrowth in the Neutro group, by rescaling relative abundances with Haemo abundance downscaled to its average across samples according to the method used by Taylor and colleagues (21) (Haemo rescaled), and by using a Quantile norm approach to rescale relative abundances to their within-sample percentile ranks; 2) subanalyzing within the initial, second, and third stable visits and during exacerbations; 3) subanalyzing within each of the four sites; and 4) using BEAT-COPD (Biomarkers to Target Antibiotic and Systemic COPD) data. The LDA score for each specific comparison is indicated in the corresponding cell in the table. (D) An example illustrating the time-series analysis on longitudinal microbiome data. Shown are the changes in relative abundances of Campylobacter compared with the changes in Neutro and Eosino status across visits for one patient (South subject-137). The break in between the red lines indicates significant changes in the relative abundance of Campylobacter identified by the changepoint-detection algorithm, which coincided with the switch from the Neutro to the Eosino state. The changes in abundance of Campylobacter were also in concert with sputum Eosino percentages over time, with a cross-covariance (cross-cov) score of 0.861. (E) The microbiome genera whose change points were associated with exacerbation events and with switches between Neutro and Eosino inflammation within stable disease. The odds ratio and 95% confidence interval (95% CI) are shown. Only significant genera with lower limit of the 95% CI greater than 1.0 are shown. (F) The top 10 genera with greatest cumulative cross-cov scores with sputum Eosino percentages. The cumulative cross-cov score and interpatient stdev of the scores were shown for each genus. The genera were highlighted in asterisks if their cross-cov scores were significantly higher than the null distributions derived from permutation test. *FDR P < 0.05. **FDR P < 0.01, and ***FDR P < 0.001. adj = adjusted; H = Haemo-predominant; Leic = Leicester; Manc = Manchester; Quantile norm = quantile normalization; South = Southampton; stdev = SD.
Figure 5.
Figure 5.
Distinct host–microbiome interactions between inflammatory subtypes. (A) The microbiome cooccurrence network for significant correlations between microbiome genera identified by SparCC (Sparse Correlations for Compositional data) in the COPDMAP (Chronic Obstructive Pulmonary Disease [COPD] Medical Research Council/Association of the British Pharmaceutical Industry) and AERIS (Acute Exacerbation and Respiratory Infections in COPD) cohorts. Each node represents a genus. The size of the node is proportional to its degree of connectivity. Nodes were colored by their module assignments by the “Modularity” function on the basis of a Louvain community-detection algorithm implemented in Gephi software (resolution = 1.0). Each edge represents a significant correlation between pairs of nodes (false discovery rate P < 0.05). The width of the edge is proportional to the absolute correlation coefficient. Edges were colored on the basis of coexclusion (red) or cooccurrence (blue) relationship. The top 100 positive and negative correlations are shown for display purposes. (B) Significant correlations between microbiome genera and sputum mediators using residualized all-against-all correlation by using HAllA (Hierarchical All-against-All association testing) in COPDMAP data. Each dot represents a significant correlation between a microbiome genus and a sputum mediator (false discovery rate P < 0.1). The size and color strength of the dot are proportional to the Spearman correlation coefficient. Dots were colored on the basis of negative (red) or positive (blue) correlation. The top 20 positive and negative correlations are shown for display purposes. The degree of connectivity for each genus in the microbiome cooccurrence network (in A) was indicated above the microbiome–mediator correlation matrix. SAA = serum amyloid A.

Comment in

References

    1. Roca J, Vargas C, Cano I, Selivanov V, Barreiro E, Maier D, et al. Synergy-COPD Consortium. Chronic obstructive pulmonary disease heterogeneity: challenges for health risk assessment, stratification and management. J Transl Med. 2014;12(Suppl 2):S3. PubMed - PMC - PubMed
    1. Lopez AD, Shibuya K, Rao C, Mathers CD, Hansell AL, Held LS, et al. Chronic obstructive pulmonary disease: current burden and future projections. Eur Respir J. 2006;27:397–412. PubMed - PubMed
    1. Agusti A, Calverley PM, Celli B, Coxson HO, Edwards LD, Lomas DA, et al. Evaluation of COPD Longitudinally to Identify Predictive Surrogate Endpoints (ECLIPSE) Investigators. Characterisation of COPD heterogeneity in the ECLIPSE cohort. Respir Res. 2010;11:122. PubMed - PubMed
    1. O’Donnell DE, Parker CM. COPD exacerbations: 3. Pathophysiology. Thorax. 2006;61:354–361. PubMed - PMC - PubMed
    1. Bach PB, Brown C, Gelfand SE, McCrory DC. American College of Physicians–American Society of Internal Medicine; American College of Chest Physicians. Management of acute exacerbations of chronic obstructive pulmonary disease: a summary and appraisal of published evidence. Ann Intern Med. 2001;134:600–620. PubMed - PubMed

Publication types