. 2021 Mar 2;33(3):629-648.e10.
doi: 10.1016/j.cmet.2020.12.003. Epub 2020 Dec 16.

The pyruvate-lactate axis modulates cardiac hypertrophy and heart failure

Affiliations

The pyruvate-lactate axis modulates cardiac hypertrophy and heart failure

Ahmad A Cluntun et al. Cell Metab. .

Abstract

The metabolic rewiring of cardiomyocytes is a widely accepted hallmark of heart failure (HF). These metabolic changes include a decrease in mitochondrial pyruvate oxidation and an increased export of lactate. We identify the mitochondrial pyruvate carrier (MPC) and the cellular lactate exporter monocarboxylate transporter 4 (MCT4) as pivotal nodes in this metabolic axis. We observed that cardiac assist device-induced myocardial recovery in chronic HF patients was coincident with increased myocardial expression of the MPC. Moreover, the genetic ablation of the MPC in cultured cardiomyocytes and in adult murine hearts was sufficient to induce hypertrophy and HF. Conversely, MPC overexpression attenuated drug-induced hypertrophy in a cell-autonomous manner. We also introduced a novel, highly potent MCT4 inhibitor that mitigated hypertrophy in cultured cardiomyocytes and in mice. Together, we find that alteration of the pyruvate-lactate axis is a fundamental and early feature of cardiac hypertrophy and failure.

Keywords: LVAD; MCT4; MPC; VB124; cardiac metabolism; heart failure; hypertrophy; lactate; mitochondria; pyruvate.


Conflict of interest statement

Declaration of interests The University of Utah has filed a patent related to the mitochondrial pyruvate carrier, of which J.R. is listed as co-inventor. J.R. is a founder of Vettore Biosciences and a member of its scientific advisory board. K.M.P. is an employee and shareholder of Vettore Biosciences. S.M. was an employee of Vettore Biosciences. S.G.D. is a consultant to Abbott (Steering Committee member of the INTELLECT-2 multicenter trial of LVAD and CardioMEMS). J.R. and S.G.D. are the recipients of a grant from Merck related to mechanisms of HF and myocardial recovery. All other authors declare no competing interests.

Figures

Figure 1.
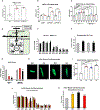
Figure 1.. MPC1 deficiency is sufficient to promote cardiac hypertrophy and leads to heart failure
(A) Diagram depicting progression of hearts towards HF and how paired HF patient hearts were compared pre and post LVAD unloading. (B and C) Scatter dot plots comparing paired left ventricular ejection fractions (LVEF), and left ventricular end diastolic diameters (LVEDD) from human hearts of non-responder (n=60) and responder (n=23) HF patients pre and post LVAD unloading. (D and E) Western blot densitometric results showing MPC1 and p-PDH/PDH levels in human LV tissues from non-failing donors (n=7), non-responders (Pre, n=18, Post, n=21) and responders (Pre, n=12, Post, n=8) (Pre, Pre-LVAD time point; Post, Post-LVAD time point). (F) Representative western blot analysis of MPC1 and MPC2 proteins in LV and liver tissue lysates from wild type (WT) and MPC1 cardiac-specific knock out (MPC1CKO) mice (n=5). Schematics of the MPC1flox and α-MHC-CreER alleles are shown. (G) Representative images of M-mode echocardiography recorded from LV of WT and MPC1CKO mice after 1, 11- and 16-weeks post-induction, showing hypertrophy and LV dilation (n=7). (H, I and J) Time course of change in LVEF, Fractional shortening (FS) and LVEDD of WT and MPC1CKO mice (n=7). (K) Representative H&E stained sections of hearts from WT and MPC1CKO mice (n=3). (L) LV mass of WT and MPC1CKO mice (n=7). (M) Weight of WT and MPC1CKO mice (n=7). (N) Kaplan-Meier survival curve of WT and MPC1CKO mice. WT n=4 and MPC1CKO n=4. Data are presented as mean ± SEM, *p<0.05, **p<0.01, ***p<0.001, ****p<0.0001, determined by one-way ANOVA and Sidak’s multiple comparison test (B–E), student’s unpaired t test (H–J, L and M) and Log-rank and Wilcoxon tests (N). ns, not significant. See also Figure S1 and Table 1.
Figure 2.
Figure 2.. Loss of MPC is an early injury in HF
(A) GO term analysis on up-regulated genes in MPC1CKO mice at 8 weeks post induction (wpi). (MF, molecular function; BP, biological process). Murine heart tissue was harvested from WT mice (green) (n=4) and MPC1CKO (orange) (n=4). (B) GO term analysis on up-regulated genes in MPC1CKO mice at 16wpi. (MF, molecular function; BP, biological process; resp., response; stim., stimulus). Murine heart tissue was harvested from WT mice (green) (n=4) and MPC1CKO (orange) (n=4). (C and D) Changes in cardiac hypertrophy gene set at 8- and 16-wpi. (E and F) Glycolysis gene set at 8- and 16-wpi. (G and H) Changes in TCA cycle gene set at 8- and 16-wpi (I and J) Changes in Pyruvate proximal genes (Bensard et al., 2020) at 8- and 16-wpi. Abundance displayed according to the heatmaps shown. Z-scored genes were clustered via calculating the Euclidean distance between centroids. (K and L) Representative TEM images at various magnifications of mitochondria from murine LV tissue of MPC1CKO and WT at 8 wpi and 16 wpi. RNA was extracted at 8- or 16-wpi and evaluated on custom gene sets including gene components. (M) 8-week-old MPC1CKO mice were injected interperitoneally for 3 consecutive days with TAM (40mg/kg/day) and then examined at 8, 9, 13, and 16 wpi. Assignments were based on the hemodynamic data from Figure 1. See also Figure S2.
Figure 3.
Figure 3.. Loss of mitochondrial pyruvate transport is necessary and sufficient to induce hypertrophy in cultured cardiomyocytes
(A) Quantification of cell area of H9c2 cells treated with MPC inhibitor UK5099 (UK). (B) Quantification of cell area of MPC1 shRNA-mediated knockdown (MPC1 KD) and shRNA control (shCtrl) H9c2 cells. (C) Quantification of cell area of MPC overexpressing (MPC OE) or control empty vector (EV) H9c2 cells treated with hypertrophic inducing drugs: Angiotensin II (ATII), Isoproterenol (ISO), Phenylephrine (PE) or UK. (n=4, each point is the mean of n≥15 cells from an independent experiment). (D) Schematic for metabolism of [U-13C]-glucose. White circles depict 12C and black solid circles depict 13C. (3PG, 3-Phosphoglyceric acid; Pyr, Pyruvate; Ala, Alanine; Lac, Lactate; Cit, Citrate; Succ, Succinate; Fum, Fumarate; Mal, Malate). (E) 13C enrichment of glycolytic and TCA cycle intermediates in MPC1 KD and shCtrl H9c2 cells. (F) 13C enrichment of extracellular lactate in shCtrl, MPC1 KD, EV and MPC OE H9c2 cells. (G) Fold change in 13C enrichment of citrate in PE and UK treated EV or MPC OE H9c2 cells relative to Veh. (H) Representative images of Phalloidin stained primary cultured adult mouse cardiomyocytes that have been treated with DMSO (Veh), UK, PE, or ISO, scale bars, 20μm. (I) Quantification of cell area of corresponding cardiomyocytes. (n=4, each point is the mean of n≥15 cells from an independent experiment). (J) 13C enrichment of glycolytic and TCA cycle intermediates in cardiomyocytes. (K) Fold change in 13C enrichment of extracellular lactate in treated cardiomyocytes relative to the Veh. Data are presented as mean ± SEM, *p<0.05, **p<0.01, ***p<0.001, ****p<0.0001, determined by one-way ANOVA and Sidak’s multiple comparison test (A–C, I), and unpaired t test versus Veh (E–G, J, K). ns, not significant. See also Figure S3.
Figure 4.
Figure 4.. Dynamic changes in glycolytic flux precede hypertrophy and HF in MPC1CKO mice
(A) Diagram of experiment, cardiomyocytes were harvested from mice before hypertrophy (12 wpi) and at HF (16 wpi), cultured in media containing [U-13C]-glucose, and metabolites were harvested after 0, 1, 2, and 4 hours. (B) Schematic of metabolic pathways connecting glycolysis to the TCA cycle. (Pyr, Pyruvate; Lac, Lactate; Ala, Alanine; Cit, Citrate; Succ, Succinate; Fum, Fumarate; Mal, Malate). (C and D) Dynamic [U13C]-glucose incorporation into corresponding metabolites over time, in primary cultured adult cardiomyocytes harvested from MPC1CKO mice at 12 wpi and 16wpi. Data are presented as mean ± SEM.
Figure 5.
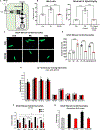
Figure 5.. MCT4 inhibition can prevent and reverse hypertrophy in cardiomyocytes
(A) Schematic depicting rewiring of glycolytic flux in hypertrophied cardiomyocytes treated with the MCT4 inhibitor (VB124). (B) Left: Quantification of cell area of H9c2 cells treated with Veh, PE, PE+VB124 simultaneously or Right: treated with PE and subsequently treated with PE+VB. (n=4, each point is the mean of n≥15 cells from an independent experiment) (C) Representative images of Phalloidin stained primary cultured adult mouse cardiomyocytes with corresponding treatments: Veh, PE or ISO each with or without VB124. Scale bars, 20μm. (D) Quantification of surface area of corresponding treated cardiomyocytes, (VB, VB124). (n=4, each point is the mean of n≥15 cells from an independent experiment) (E) 13C enrichment of glycolytic and TCA cycle intermediates in H9c2 cells treated with Veh, PE, PE+VB, ISO or ISO+VB. (F) 13C enrichment of Citrate in adult mouse cardiomyocytes. (G) Fold change in 13C enrichment of extracellular Lactate for adult mouse cardiomyocytes treated with PE, PE+VB, ISO or ISO+VB relative to the Veh. Data are presented as mean ± SEM, *p<0.05, **p<0.01, ***p<0.001, ****p<0.0001, determined by one-way ANOVA and Sidak’s multiple comparison test (B, D) or unpaired t test versus Veh (E–G). ns, not significant. See also Figure S5.
Figure 6.
Figure 6.. MCT4 inhibition replenishes mitochondrial pyruvate flux, improves mitochondrial membrane potential and mitigates cytosolic ROS
(A) Fold change in mitochondrial matrix specific steady-state unlabeled 12C abundances of Lactate (Lac) and Pyruvate (Pyr) relative to Veh in H9c2 cells treated with UK, PE, PE+VB, ISO and ISO+VB. (N.D., not detected). (B) Fold change in corresponding whole cell unlabeled 12C abundances of Lac and Pyr relative to the Veh. (C) 13C enrichment of Lac and Pyr in the mitochondrial matrix specific pool. (N.D., not detected). (D, E and F) Dynamic 13C-glucose labeling of the TCA cycle intermediates Succinate, Fumarate, and Malate in the mitochondrial matrix over time treated with ISO or ISO+VB. (G) Fold change in mitochondrial matrix specific steady-state unlabeled 12C abundances of Aspartate (Asp) and Glutamate (Glu) relative to Veh in H9c2 cells treated with UK, PE, PE+VB, ISO and ISO+VB. (H) Fold change in corresponding whole cell unlabeled 12C abundances of Asp and Glu relative to the Veh. (I) Ratio of Mitotracker Red and Mitotracker Green in cultured adult mouse cardiomyocytes treated with DMSO, CCCP, Veh, ISO or ISO+VB. (J) CM-H2DCFDA fluorescence quantification of cultured adult mouse cardiomyocytes treated with DMSO, H2O2, Veh, ISO or ISO+VB. Data are presented as mean ± SEM, *p<0.05, **p<0.01, ***p<0.001, ****p<0.0001, determined by one-way ANOVA and Sidak’s multiple comparison test (H, I) or unpaired t test versus Veh (A–C, F, G). ns, not significant. See also Figure S6.
Figure 7.
Figure 7.. MCT4 inhibition prevents cardiac hypertrophy in mice
(A) Diagram of the experiment, C57BL/6 mice were surgically implanted with osmotic pumps containing ISO or Veh, and were orally gavaged with VB124 or Veh daily for 28 days. (n=8 per condition). (B) Heart weight to body weight ratio of treated mice. (C) LV end diastolic diameter (LVEDD) of murine hearts treated with Veh (n=8), VB124 (n=8), ISO (n=8), or ISO+VB124 (n=7) measured from echocardiography. (D) Clustered heatmap of relative heart metabolite levels (n=4). Metabolites were log2, quantile normalized before Pearson hierarchal clustering, Z-scores calculated by row. (E) Principle component analysis scores plot of metabolite profiles of corresponding murine hearts. (F) Fold change in steady-state levels of glycolytic intermediates in VB124, ISO or ISO+MCT4 treated mice relative to the Veh. (G) Representative heart TEM images of mitochondria from mice following Veh, VB124, ISO or ISO+VB124 treatments at x5,000 and x15,000 magnification. (H, I and J) Quantification of mitochondrial area, mitochondrial volume density, and intermitochondrial junctions. Data are presented as mean ± SEM, *p<0.05, **p<0.01, ***p<0.001, ****p<0.0001, determined by 1-way ANOVA followed by Sidak’s multiple comparison (B, C, H–J) or unpaired t test versus Veh (F). ns, not significant. See also Figure S7.

References

    1. ABEL ED & DOENST T 2011. Mitochondrial adaptations to physiological vs. pathological cardiac hypertrophy. Cardiovasc Res, 90, 234–42. - PMC - PubMed
    1. ACIN-PEREZ R, LECHUGA-VIECO AV, DEL MAR MUNOZ M, NIETO-ARELLANO R, TORROJA C, SANCHEZ-CABO F, JIMENEZ C, GONZALEZ-GUERRA A, CARRASCOSO I, BENINCA C, QUIROS PM, LOPEZ-OTIN C, CASTELLANO JM, RUIZ-CABELLO J, JIMENEZ-BORREGUERO LJ & ENRIQUEZ JA 2018. Ablation of the stress protease OMA1 protects against heart failure in mice. Sci Transl Med, 10. - PubMed
    1. ALLARD MF, SCHONEKESS BO, HENNING SL, ENGLISH DR & LOPASCHUK GD 1994. Contribution of oxidative metabolism and glycolysis to ATP production in hypertrophied hearts. Am J Physiol, 267, H742–50. - PubMed
    1. BADOLIA R, RAMADURAI DKA, ABEL ED, FERRIN P, TALEB I, SHANKAR TS, KROKIDI AT, NAVANKASATTUSAS S, MCKELLAR SH, YIN M, KFOURY AG, WEVER-PINZON O, FANG JC, SELZMAN CH, CHAUDHURI D, RUTTER J & DRAKOS SG 2020. The Role of Nonglycolytic Glucose Metabolism in Myocardial Recovery Upon Mechanical Unloading and Circulatory Support in Chronic Heart Failure. Circulation, 142, 259–274. - PMC - PubMed
    1. BARGER PM & KELLY DP 1999. Fatty acid utilization in the hypertrophied and failing heart: molecular regulatory mechanisms. Am J Med Sci, 318, 36–42. - PubMed

Publication types

MeSH terms