. 2021 Jan 7;81(1):153-165.e7.
doi: 10.1016/j.molcel.2020.11.032. Epub 2020 Dec 16.

Dissecting the Structural Dynamics of the Nuclear Pore Complex

Affiliations

Dissecting the Structural Dynamics of the Nuclear Pore Complex

Zhanna Hakhverdyan et al. Mol Cell. .

Abstract

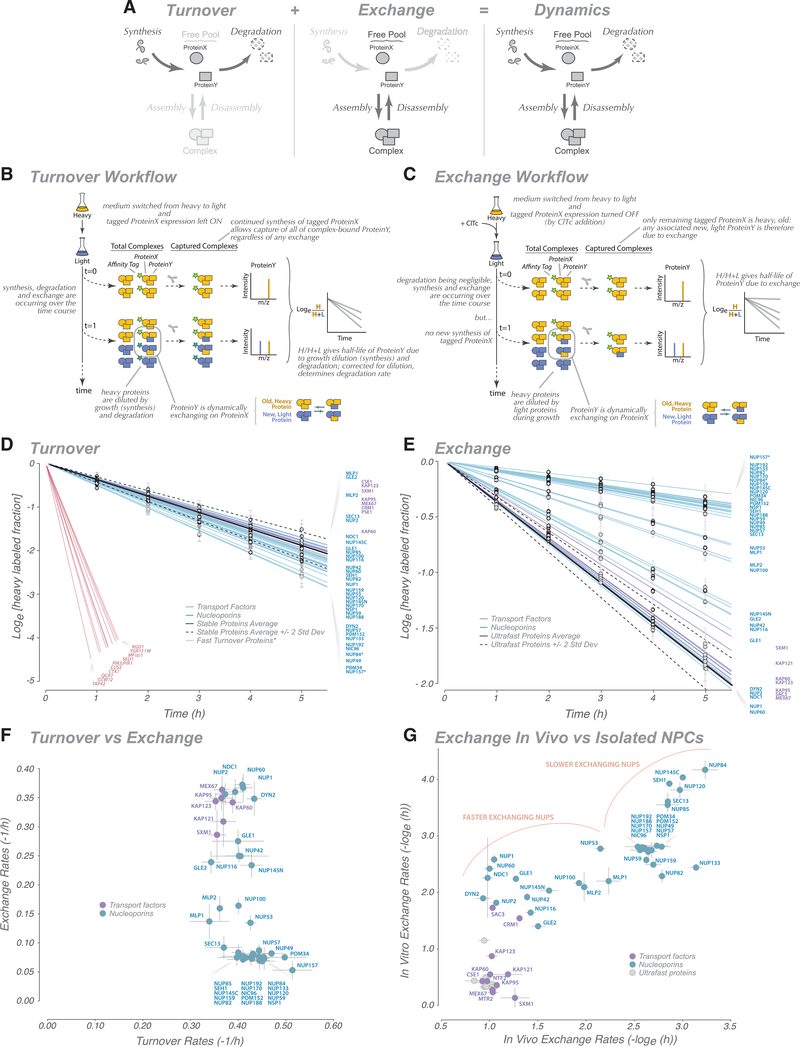
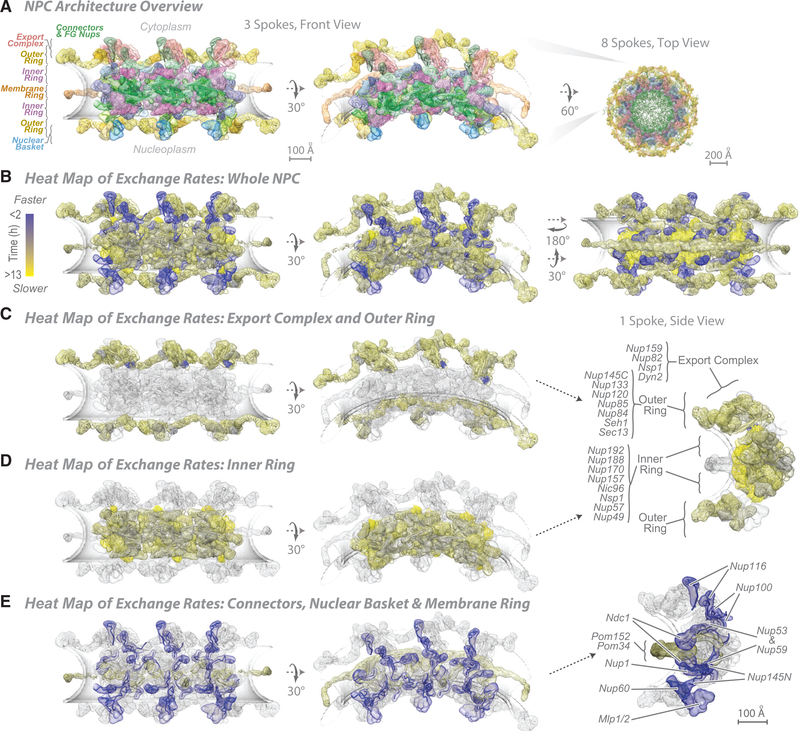
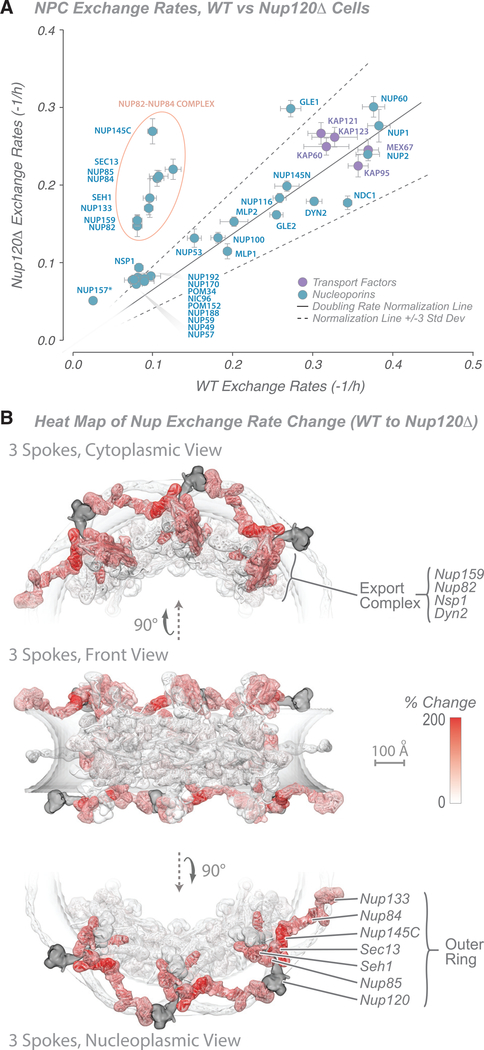
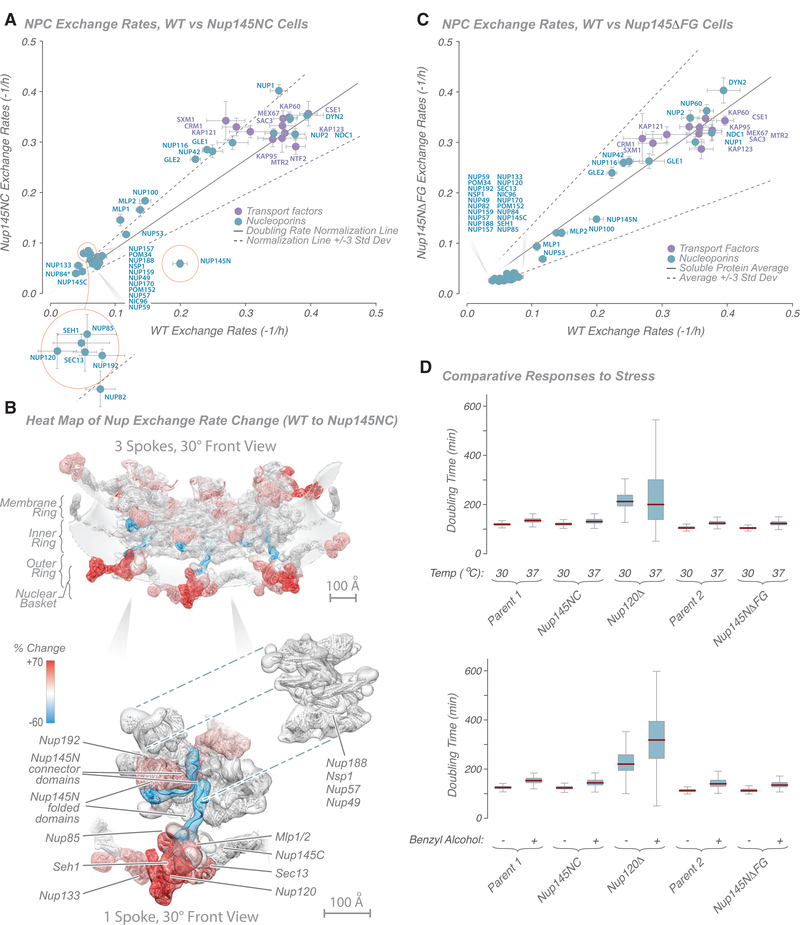
Cellular processes are largely carried out by macromolecular assemblies, most of which are dynamic, having components that are in constant flux. One such assembly is the nuclear pore complex (NPC), an ∼50 MDa assembly comprised of ∼30 different proteins called Nups that mediates selective macromolecular transport between the nucleus and cytoplasm. We developed a proteomics method to provide a comprehensive picture of the yeast NPC component dynamics. We discovered that, although all Nups display uniformly slow turnover, their exchange rates vary considerably. Surprisingly, this exchange rate was relatively unrelated to each Nup's position, accessibility, or role in transport but correlated with its structural role; scaffold-forming Nups exchange slowly, whereas flexible connector Nups threading throughout the NPC architecture exchange more rapidly. Targeted perturbations in the NPC structure revealed a dynamic resilience to damage. Our approach opens a new window into macromolecular assembly dynamics.

Keywords: assembly; dynamics; exchange; nuclear pore complex; nucleoporin; quantitative proteomics; turnover.


Conflict of interest statement

Declaration of Interests The authors declare no competing interests.

Figures

Figure 1.
Figure 1.. Analysis of Nucleoporin Turnover and Exchange
(A) Schematic representation of protein dynamics in cells. (B and C) Schematic representation of turnover (B) and exchange (C) measurement workflows. See STAR Methods for details. (D) Heavy label decay time course for Nups (blue) and transport factors (purple), indicating the turnover rate for each protein. Measured data and fit are presented; error bars, standard error. The turnover rate fits were calculated for other abundant cytoplasmic proteins with a known low turnover rate to establish their turnover rate distribution (stable protein average, solid black line; 2 standard deviations, dashed black lines). For a comparison, fast turnover proteins from Christiano et al. (2014) were also plotted (but not observed as part of this dataset) (red). An average of turnover rates for GFP-Nup84- and GFP-Nup157-captured NPCs is shown; tagged Nups are indicated by an asterisk. (E) Heavy label decay time course for Nups and transport factors. Measured data and fit are presented; error bars, standard error. The exchange rate fits were also calculated for other abundant cytoplasmic proteins, which represent nonspecific ultrafast exchanging proteins, to establish their distribution of exchange rates (ultrafast protein average, solid black line; 2 standard deviations, dashed black lines). An average of exchange rates for GFP-Nup84- and GFP-Nup157-captured NPCs is shown; tagged Nups are indicated by an asterisk. (F) Plot comparing turnover rates with exchange rates. (G) Plot comparing the exchange rates inferred in vivo (Figure 1E) from those measured on isolated NPCs (STAR Methods).
Figure 2.
Figure 2.. Heatmap of Nup Exchange Rates on an NPC Structure
(A-E) Structure of an NPC and its components in different views; a model of the pore membrane is shown in gray. For each Nup, the localization probability density of the protein is shown with a representative structure embedded within it (Kim et al., 2018). The remaining rows show a heatmap of Nup exchange rates on an NPC structure (blue, rapid exchange; yellow, slow exchange). The second row shows a heatmap on an entire NPC, and subsequent rows show heatmapping on major NPC substructures, with remaining NPC shown in faded gray.
Figure 3.
Figure 3.. Characterization of Nucleoporin Exchange Rates in the Nup120-Null Strain
(A) Graph showing comparison of Nup exchange rates in the Nup120 wild-type and null strains. A doubling rate normalization line (solid black line; 3 standard deviations, dashed black lines) indicates the difference in labeling rates between the strains, calculated from other abundant cytoplasmic proteins. Proteins with the greatest deviation are outlined in red. The average of two experiments is shown; error bars are combined standard error of the parameter fits. Tagged Nup157 is indicated by an asterisk. (B) Heatmap on the molecular structure of an NPC (Figure 2; Kim et al., 2018) of differences in exchange rates (in percent; white, 0%; red, +200% [faster]) between a wild-type and Nup120-null strains. Scale bar, 100 Å.
Figure 4.
Figure 4.. Characterization of Nucleoporin Exchange Rates in Nup145 Mutant Strains
(A) Graph showing comparison of Nup exchange rates in wild-type and Nup145NC fusion strains. A doubling rate normalization line (solid black line; 3 standard deviations, dashed black lines) indicates the difference in labeling rates between strains, calculated from other abundant cytoplasmic proteins. Proteins with the greatest deviation are outlined in red. Tagged Nup84 is indicated by an asterisk. (B) Heatmap on the molecular structure of an NPC (Figure 2; Kim et al., 2018) of differences in exchange rates (in percent; cyan, −60% [slower]; white, 0%; red, +70% [faster]) between wild-type and Nup145NC fusion strains (from Kim et al., 2018). Top: 3 NPC spokes. Bottom: single spoke with Nups dissected aside. Scale bars, 100 Å. (C) Graph showing comparison of Nup exchange rates in wild-type and Nup145NFG fusion strains. A doubling rate normalization line (solid black line; 3 standard deviations, dashed black lines) indicates the difference in labeling rates between strains, calculated from other abundant cytoplasmic proteins. (D) Plots showing the ODELAY!-measured phenotypic effect of temperature-induced (top) or benzyl alcohol-induced (bottom) stress in selected strains (see STAR Methods for details). For (A) and (C), the average of two experiments is shown; error bars are combined standard error of the parameter fits.
Figure 5.
Figure 5.. NPC Dynamics after Induced Degradation of AID-Nup170 Protein
(A) Fraction of each Nup in mature NPCs after degron induction (wild-type versus Nup170-AID strains). A doubling rate normalization line (solid black line; 1 standard deviation, dashed black lines) indicates the difference in labeling rates between the strains, calculated from other abundant cytoplasmic proteins. Proteins with significant deviation (p < 0.05) are indicated in red. The average of 2 experiments is shown; error bars show the range of the two values. Tagged Nup84 is indicated by an asterisk. (B) Fraction of newly synthesized Nup incorporated into mature NPCs after degron induction (wild-type versus Nup170-AID strains) and new protein incorporation difference for Nups in AID-Nup170-degraded and -undegraded (mock-treated) cells; error bars, standard deviation. The fractional changes were also calculated for other abundant cytoplasmic proteins, which represent nonspecific ultrafast-exchanging proteins (stable protein average, solid black line; 3 standard deviations, dashed black lines). Proteins with significant deviation (p < 0.01) from the normal are indicated in red. The average of three experiments is shown; error bars are combined standard error of the mean. Tagged Nup84 is indicated by an asterisk. (C) Heatmap on the molecular structure of NPC (Figure 2; Kim et al., 2018) of Nup exchange increase after AID-Nup170 degradation (white, no new protein; red, 0.06 [6%] new protein). Scale bar, 100 Å.

References

    1. Aitchison JD, and Rout MP (2015). The interactome challenge. J. Cell Biol. 211, 729–732. - PMC - PubMed
    1. Aitchison JD, Blobel G, and Rout MP (1995a). Nup120p: a yeast nucleoporin required for NPC distribution and mRNA transport. J. Cell Biol. 131, 1659–1675. - PMC - PubMed
    1. Aitchison JD, Rout MP, Marelli M, Blobel G, and Wozniak RW (1995b). Two novel related yeast nucleoporins Nup170p and Nup157p: complementation with the vertebrate homologue Nup155p and functional interactions with the yeast nuclear pore–membrane protein Pom152p. J. Cell Biol. 131, 1133–1148. - PMC - PubMed
    1. Baade I, and Kehlenbach RH (2019). The cargo spectrum of nuclear transport receptors. Curr. Opin. Cell Biol. 58, 1–7. - PubMed
    1. Beck M, and Hurt E (2017). The nuclear pore complex: understanding its function through structural insight. Nat. Rev. Mol. Cell Biol. 18, 73–89. - PubMed

Publication types

MeSH terms

Substances

LinkOut - more resources