. 2021 Feb 18;81(4):767-783.e11.
doi: 10.1016/j.molcel.2020.12.006. Epub 2020 Dec 16.

Defective ALC1 nucleosome remodeling confers PARPi sensitization and synthetic lethality with HRD

Affiliations

Defective ALC1 nucleosome remodeling confers PARPi sensitization and synthetic lethality with HRD

Graeme Hewitt et al. Mol Cell. .

Abstract

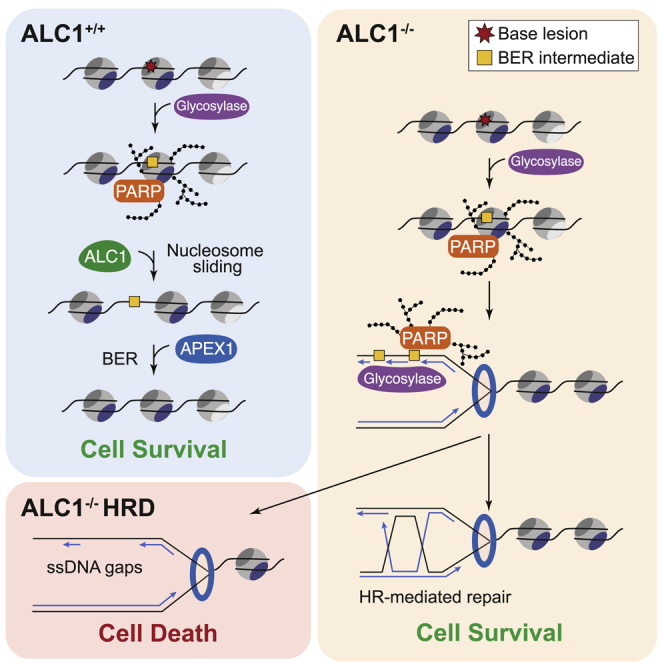
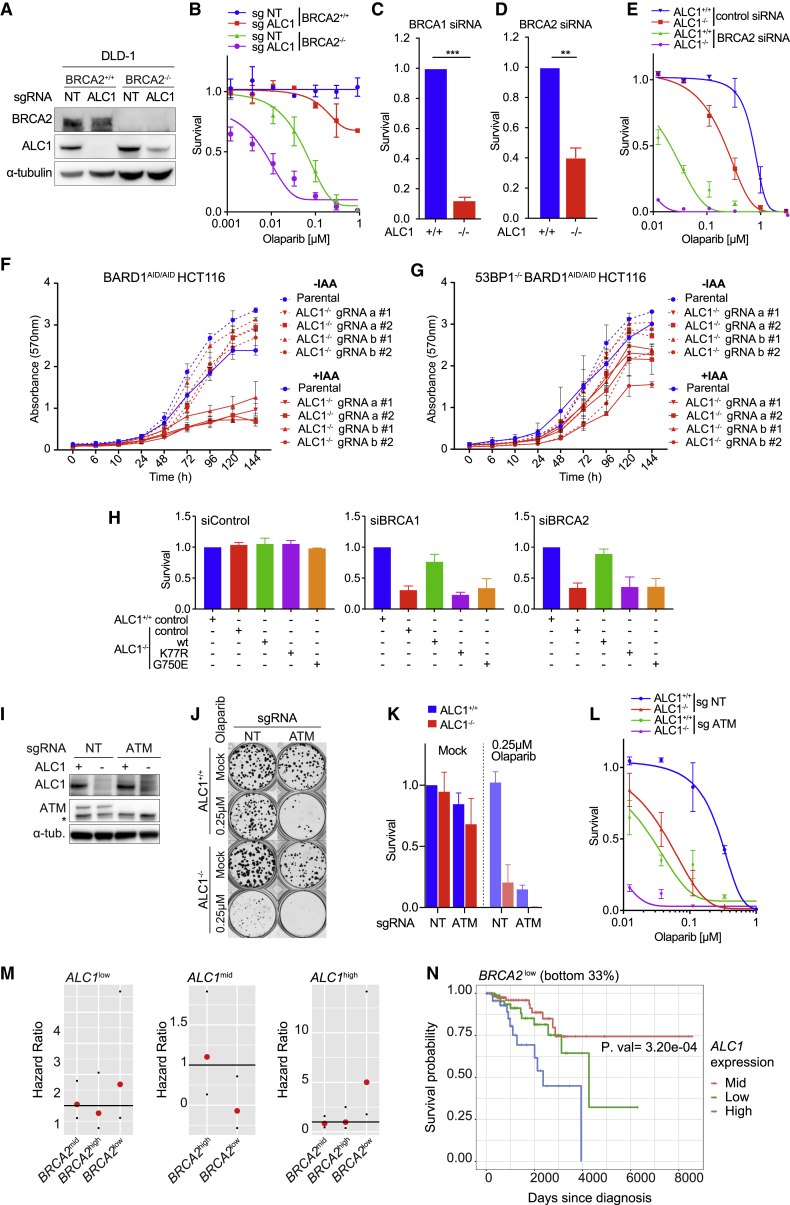
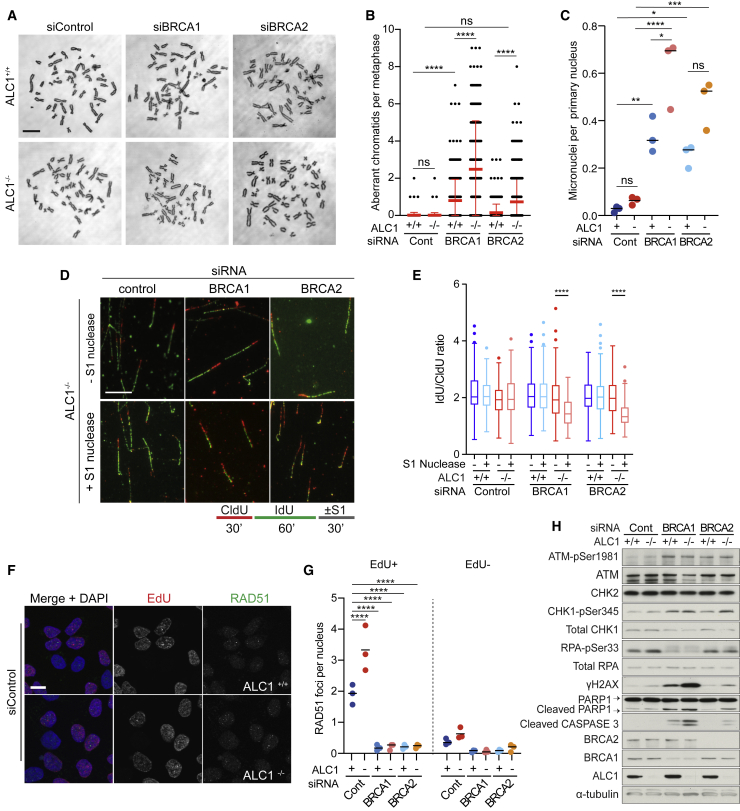
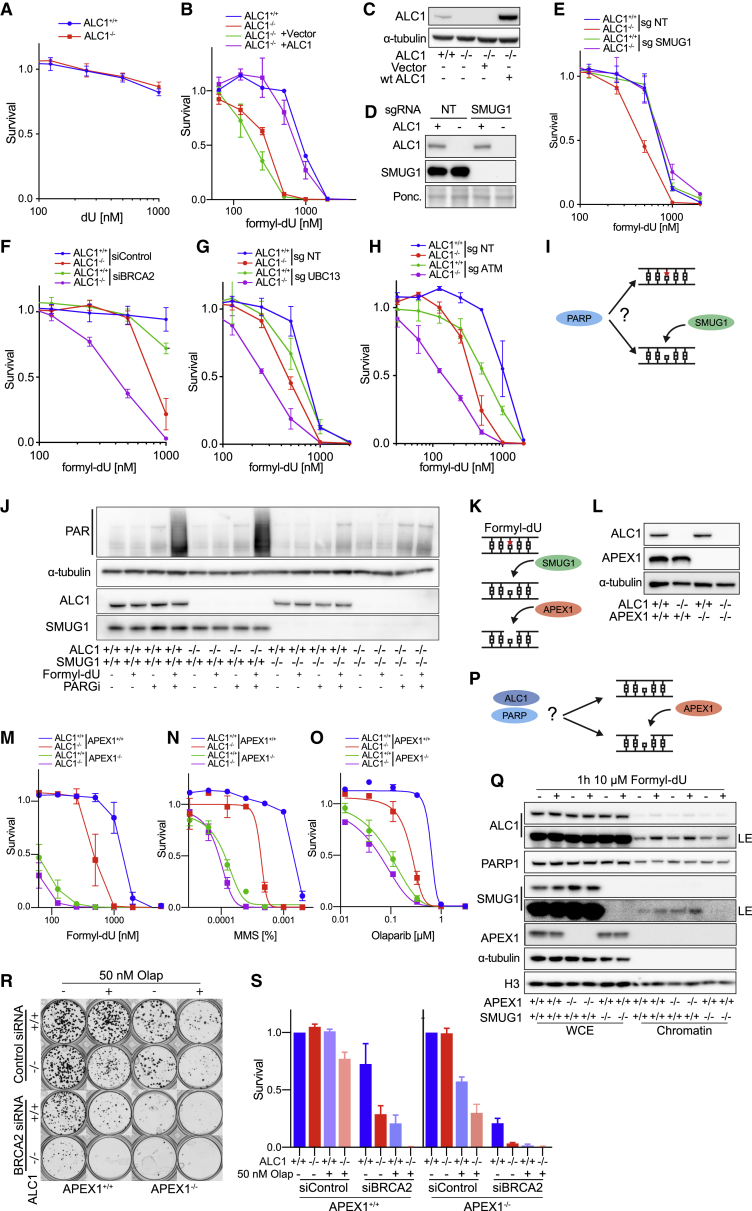
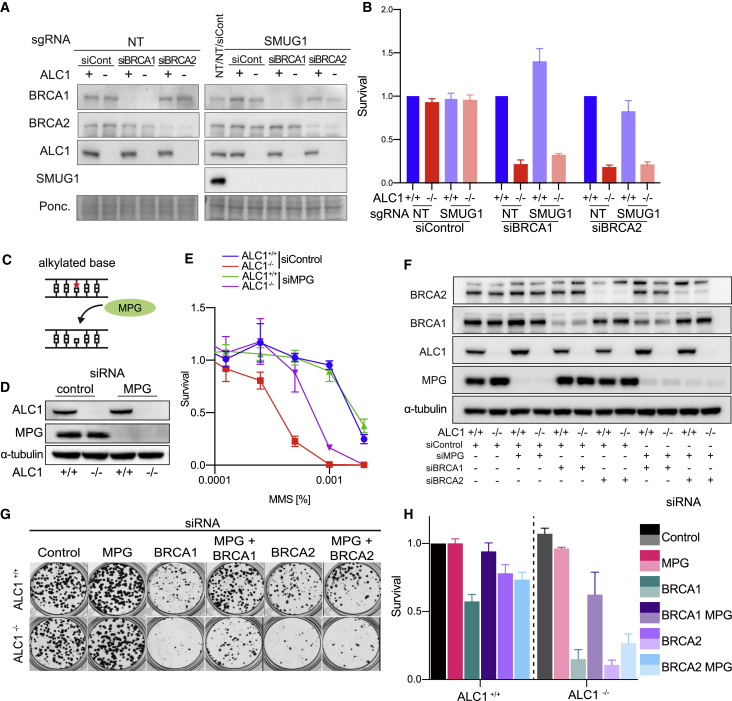
Chromatin is a barrier to efficient DNA repair, as it hinders access and processing of certain DNA lesions. ALC1/CHD1L is a nucleosome-remodeling enzyme that responds to DNA damage, but its precise function in DNA repair remains unknown. Here we report that loss of ALC1 confers sensitivity to PARP inhibitors, methyl-methanesulfonate, and uracil misincorporation, which reflects the need to remodel nucleosomes following base excision by DNA glycosylases but prior to handover to APEX1. Using CRISPR screens, we establish that ALC1 loss is synthetic lethal with homologous recombination deficiency (HRD), which we attribute to chromosome instability caused by unrepaired DNA gaps at replication forks. In the absence of ALC1 or APEX1, incomplete processing of BER intermediates results in post-replicative DNA gaps and a critical dependence on HR for repair. Hence, targeting ALC1 alone or as a PARP inhibitor sensitizer could be employed to augment existing therapeutic strategies for HRD cancers.

Keywords: ALC1; BRCAs; DNA damage repair; DNA gycosylases; PARPs; base excsion repair; chromatin remodeler; homologous recombination defieciency; poly(ADP)-ribosylation; synthetic lethality.


Conflict of interest statement

Declaration Of Interests G.H. and S.J.B are inventors on a patent derived from this work. S.J.B. is also scientific co-founder and VP Science Strategy at Artios Pharma Ltd., Babraham Research Campus, Cambridge, UK. The authors declare no other competing interests.

Figures

None
Graphical abstract
Figure 1
Figure 1
Loss of Alc1 does not affect lifespan and reduces DEN-induced tumor occurrence (A) Top: Schematic representation of mouse Alc1 genomic locus. The gene-trap vector rsFROSAbgeo0s is inserted at position 4827 in intron 1. The whole genomic locus is 49.461 kb, and introns (lines) and exons (bars) are approximately to scale. Gray lines represent primers used for genotype. Bottom: ALC1 protein organization. Alc1 mutant protein is truncated at the 45th amino acid and fused to the β-Geo cassette of the gene-trap vector. (B) Weight analysis of Alc1+/+ and Alc1−/− mice. Error bars are not shown to render the graph readable; data are from males and females with at least five mice measured at each time point. (C) Tumor-free survival of Alc1 mice. Significance: Mantel-Cox test, p = 0.4. n = 30 Alc1+/+ and n = 30 Alc1−/−. Mice culled due to nonspecific phenotypes (e.g., dermatitis, overgrown teeth, and fits) were excluded from this study. Right: Frequency of Alc1 mice that develop tumors. Note that there is no difference between both groups. (D–F) Alc1−/− mice show reduction in both spontaneous epithelial and mesenchymal and DEN-induced tumor formation. (D) Epithelial and mesenchymal tumor-free survival of Alc1 mice. Significance: Mantel-Cox test, p = 0.1. n = 30 Alc1+/+ and n = 30 Alc1−/−. Mice culled due to nonspecific phenotypes (e.g., dermatitis, overgrown teeth, and fits) were excluded from this study. Right: Frequency of Alc1 mice that develop epithelial or mesenchymal tumors. Note that there is a tendency for Alc1−/− mice to develop less epithelial and mesenchymal tumors. Significance: Fisher’s exact test, p = 0.2. (E) Left: Representative images of epithelial tumors. Note the presence a stomach adenoma with peculiar hyaline pink cells in the Alc1+/+ mouse. Scale bars represent 100 μm. Right: Representative images of mesenchymal tumors. Note the presence an hemangiosarcoma in the spleen of Alc1+/+ mouse. Scale bars represent 100 μm. (F) Left: Pictures of liver from 36-week-old Alc1+/+ and Alc1−/− male mice intraperitoneally injected with DEN (25 mg/kg body) at 2 weeks of age and fed with high-fat diet. n = 6. Right: Tumor size measurement in mm. Each tumor has been measured with a caliper. Note the smaller-sized tumors in the Alc1−/− group. Significance: t test, p < 0.0001. (G and H) Alc1−/− MEFs are sensitive to PARPi. (G) Reduced survival of Alc1−/− MEFs after treatment with Olaparib. Data are mean ± SEM normalized to untreated cells (n = 3 biologically independent experiments). (H) Growth curves in Alc1+/+ and Alc1−/− MEFs in non-treated controls and with indicated Olaparib doses. Data are mean ± SEM (n = 3 biologically independent experiments). (I) Reduced survival of Alc1−/− MEFs after treatment with MMS. Data are mean ± SEM normalized to untreated cells (n = 3 biologically independent experiments).ns, p > 0.05; p < 0.05; ∗∗p < 0.01; ∗∗∗p < 0.001; ∗∗∗∗p < 0.0001.
Figure 2
Figure 2
Defective PAR-binding and nucleosome remodeling confers PARPi and MMS sensitivity (A–D) ALC1−/− cells are sensitive to PARPi and MMS. (A) CRISPR-mediated inactivation of ALC1 in eHAP. Immunoblot of WCEs in ALC1+/+ and ALC1−/− cells, probed for ALC1. hnRNPA1 was used as a loading control. (B) Schematic representation of survival assays using CellTiter-Glo. (C and D) Reduced survival of eHAP ALC1−/− cells after treatment with indicated genotoxin. Data are mean ± SEM normalized to untreated cells (n = 3 biologically independent experiments). Solid lines show a nonlinear least-squares fit to a four-parameter dose-response model. (E and F) PARP trapping contributes to Olaparib sensitivity in ALC+/+ and ALC1−/− cells. (E) Immunoblot of WCEs versus chromatin in ALC1+/+ and ALC1−/− cells following indicated treatments, probed for ALC1, PARP1, and PARP2. α-tubulin was used as a loading control for cytoplasmic fraction. Histone H3 was used as a loading control for chromatin fraction (data are representative of n = 3 biologically independent experiments). (F) Rescue of Olaparib sensitivity in inducible CAS9 (iCAS9) ALC1+/+ and ALC1−/− eHAP-expressing PARP1 sgRNA following 72 h Dox induction. Data are mean ± SEM normalized to untreated cells (n = 3 biologically independent experiments). Solid lines show a nonlinear least-squares fit to a four-parameter dose-response model. (G) Rescue of Olaparib sensitivity in iCAS9 ALC1−/− eHAP-expressing PARP2 sgRNA following 72 h Dox induction. Data are mean ± SEM normalized to untreated cells (n = 3 biologically independent experiments). Solid lines show a nonlinear least-squares fit to a four-parameter dose-response model. (H) Rescue of Olaparib sensitivity in iCAS9 ALC1+/+ and ALC1−/− eHAP-expressing PARG sgRNA following 72 h Dox induction. Data are mean ± SEM normalized to untreated cells (n = 3 biologically independent experiments). Solid lines show a nonlinear least-squares fit to a four-parameter dose-response model. (I) Rescue of Olaparib sensitivity in iCAS9 ALC1+/+ and ALC1−/− eHAP-expressing 53BP1 sgRNA following 72 h Dox. Data are mean ± SEM normalized to untreated cells (n = 3 biologically independent experiments). Solid lines show a nonlinear least-squares fit to a four-parameter dose-response model. (J) Representative images (n = 3 biologically independent experiments) of clonogenic survival assays in ALC1+/+ and ALC1−/−iCAS9 cells expressing indicated sgRNA following 72 h Dox ± 250 nM Olaparib. (K) Quantification of clonogenic survival assays in ALC1+/+ and ALC1−/−iCAS9 cells expressing indicated sgRNAs following 72 h Dox ± 250 nM Olaparib. Data are mean ± SEM normalized to non-treated ALC1+/+ NT sgRNA (n = 3 biologically independent experiments). (L) Olaparib sensitivity is associated with defective nucleosome remodeling. ALC1+/+ and ALC1−/− eHAP transduced with indicated constructs. Data are mean ± SEM normalized to untreated cells (n = 3 biologically independent experiments). Solid lines show a nonlinear least-squares fit to a four-parameter dose-response model.
Figure 3
Figure 3
CRISPR screens identify novel synthetic lethalities with ALC1 deficiency (A) Schematic of screening pipeline. (B) Volcano plot of p value versus log-fold change (LFC), iCAS9 eHAP NT gRNA non-treated versus NT gRNA + 250 nM Olaparib. (C) Immunoblot of WCEs in eHAP iCAS9 NT gRNA and ALC1 gRNA from 3 independent biological replicates following 144 h Dox, probed for ALC1; α-tubulin was used as a loading control. (D) Volcano plot of p value versus LFC, iCAS9 eHAP NT gRNA + 250nM Olaparib versus ALC1 gRNA + 250 nM Olaparib.
Figure 4
Figure 4
Defective ALC1-mediated nucleosome remodeling confers synthetic lethality with HRD (A–E) Loss of ALC1 is synthetic lethal with HRD and leads to PARPi hypersensitivity. (A) Immunoblot of WCEs from DLD-1 WT and BRCA2−/− cells following transduction with LentiCRISPR NT sgRNA and ALC1 sgRNA and clonal selection (no BRCA2/ALC1 double knockouts were recovered), probed with BRCA2 and ALC1. α-tubulin was used as a loading control. (B) Olaparib colony survival in DLD-1 BRCA2+/+ALC1+/+, BRCA2−/−ALC1−/−, BRCA2−/−ALC1+/+, and BRCA2−/−ALC1Low expression. Data are mean ± SEM normalized to untreated cells (n = 3 independent biological experiments). Solid lines show a nonlinear least-squares fit to a four-parameter dose-response model. (C) Survival in ALC1+/+ and ALC1−/− eHAP cells transfected with BRCA1-targeting short interfering RNAs (siRNAs). Cell survival was measured using CellTiter-Glo. Data are mean ± SEM normalized to ALC1+/+ cells (n = 3 independent biological experiments). (D) Survival in ALC1+/+ and ALC1−/− eHAP cells transfected with BRCA2-targeting siRNAs. Cell survival was measured using CellTiter-Glo. Data are mean ± SEM normalized to ALC1+/+ cells (n = 3 independent biological experiments). (E) Olaparib survival in ALC1+/+ and ALC1−/− eHAP transfected with non-targeting or BRCA2-targeting siRNAs. Data are mean ± SEM normalized to untreated cells (n = 3 independent biological experiments). Solid lines show a nonlinear least-squares fit to a four-parameter dose-response model. (F) Quantification of a crystal violet proliferation assay in parental and ALC1-deleted BARD1AID/AID cells ± IAA. Data are mean ± SD (n = 3 independent biological experiments). (G) Quantification of a crystal violet proliferation assay in parental and ALC1-deleted 53BP1−/−BARD1AID/AID cells ± IAA. Data are mean ± SD (n = 3 independent biological experiments). (H) ALC1+/+ and ALC1−/− eHAP cells transduced with indicated ALC1 constructs were transfected with non-targeting, BRCA1-targeting, or BRCA2-targeting siRNAs. Cell survival was measured using CellTiter-Glo. Data are mean ± SEM normalized to ALC1+/+ cells for each siRNA (n = 3 independent biological experiments). (I) Immunoblot of WCEs in ALC1+/+ and ALC1−/− iCAS9 eHAP cells transduced with ATM sgRNA following 72 h Dox, probed with antibodies against ALC1 and ATM. α-tubulin is used as a loading control. (J) Representative images (n = 3 biologically independent experiments) of clonogenic survival assays in ALC1+/+ and ALC1−/− iCAS9 cells expressing NT and ATM sgRNA following 72 h Dox ± 250 nM Olaparib. (K) Quantification of clonogenic survival assays in ALC1+/+ and ALC1−/− iCAS9 cells expressing NT sgRNA and ATM sgRNA following 72 h Dox ± 250 nM Olaparib. Data are mean ± SEM normalized to non-treated ALC1+/+ NT sgRNA (n = 3 biologically independent experiments). (L) Olaparib survival of ALC1+/+ and ALC1−/− iCAS9 cells transduced with NT sgRNA and ATM sgRNA following 72 h Dox. Data are mean ± SEM normalized to untreated cells (n = 3 independent biological experiments). Solid lines show a nonlinear least-squares fit to a four-parameter dose-response model. (M) Hazard ratio analysis of breast cancer patients from TGCA according to ALC1 and BRCA2 expression. (N) KM survival analysis of BRCA2low breast cancer patients from TGCA according to ALC1 expression. ns, p > 0.05; p < 0.05; ∗∗p < 0.01; ∗∗∗p < 0.001; ∗∗∗∗p < 0.0001.
Figure 5
Figure 5
Loss of HR leads to single-stranded gaps at replication forks and gross genomic instability in ALC1−/− cells (A–D) Knockdown of BRCA1/2 in ALC1−/− cells results in genome instability. (A) Representative micrographs of metaphase spreads in ALC1+/+ and ALC1−/− eHAP transfected with the indicated siRNA. (B) Quantification of the number of aberrant chromatids per metaphase in ALC1+/+ and ALC1−/− eHAP transfected with indicated siRNA. Data are mean ± SEM (n = 3 independent biological experiments). (C) Quantification of number of micronuclei per primary nucleus from ALC1+/+ and ALC1−/− eHAP cells transfected with non-targeting, BRCA1-targeting, and BRCA2-targeting siRNAs. Data are means from individual experiments; bar represents median (n = 3 independent biological experiments). (D) Lower: scheme of the nucleotide labeling and S1 nuclease treatment strategy used for gap detection at the replication fork. Upper: Representative DNA fiber immunofluorescence images from ALC1−/− eHAP cells transfected with the indicated siRNAs and treated or not with S1 nuclease.Scale bars represent 100 μm. (E) Boxplot showing mean IdU/CldU ratio in ALC1+/+ and ALC1−/− eHAP transfected with the indicated siRNAs and treated or not with S1 nuclease. Data from 500–600 fibers/condition are represented as mean ± SD (2 technical replicates from 2 independent biological experiments). (F) Representative micrographs of ALC1+/+ and ALC1−/− eHAP cells transfected with non-targeting siRNAs stained with RAD51 antibody, EdU click-iT, and DAPI. Scale bar, 10 μm. (G) Quantification of nuclear RAD51 foci in CSK pre-extracted EdU+ and EdU− ALC1+/+ and ALC1−/− eHAP cells transfected with indicated siRNAs 72 h following knockdown. Data are means from individual experiments; bar represents median (n = 3 biologically independent experiments). (H) Immunoblot of WCEs in ALC1+/+ and ALC1−/− cells transfected with non-targeting, BRCA1-targeting, or BRCA2-targeting siRNAs, probed with ATM pSer1981, ATM, CHK2, CHK1-pSer345, total CHK1, RPA-pSer33, total-RPA, γH2AX, PARP1, cleaved caspase-3, BRCA2, BRCA1, and ALC1. α-tubulin was used as a loading control. ns, p > 0.05; p < 0.05; ∗∗p < 0.01; ∗∗∗p < 0.001; ∗∗∗∗p < 0.0001.
Figure 6
Figure 6
The monofunctional uracil glycosylase SMUG1 and APEX1 mediate formyl-dU sensitivity in ALC1-deficient cells (A) ALC1+/+ and ALC1−/− eHAP are not sensitive to dU. Data are mean ± SEM normalized to untreated cells (n = 3 independent biological experiments). (B) ALC1−/− cells are sensitive to formyl-dU. ALC1+/+ and ALC1−/− eHAP transduced with indicated constructs. Data are mean ± SEM normalized to untreated cells (n = 3 biologically independent experiments). (C) Immunoblot of WCEs in ALC1+/+ and ALC1−/− cells transduced with indicated constructs, probed for ALC1. α-tubulin was used as a loading control. (D and E) SMUG1 knockout rescues ALC1-dependent formyl-dU sensitivity. (D) Immunoblot of WCEs in ALC1+/+ and ALC1−/−iCAS9 cells transduced with NT sgRNA and SMUG1 sgRNA following 72 h Dox, probed with ALC1 and SMUG1. Ponceau was used as a loading control. (E) Formyl-dU survival of ALC1+/+ and ALC1−/−iCAS9 cells transduced with NT sgRNA and SMUG1 sgRNA following 72 h Dox. Data are mean ± SEM normalized to untreated cells (n = 3 independent biological experiments). (F) Formyl-dU survival of ALC1+/+ and ALC1−/− eHAP cells transfected with non-targeting or BRCA2-targeting siRNAs. Data are mean ± SEM normalized to untreated cells (n = 3 biologically independent experiments). (G) Formyl-dU survival of ALC1+/+ and ALC1−/− eHAP cells expressing NT or UBC13 sgRNA following 72 h Dox. Data are mean ± SEM normalized to untreated cells (n = 3 biologically independent experiments). (H) Formyl-dU survival of ALC1+/+ and ALC1−/− eHAP cells expressing NT or ATM sgRNA following 72 h Dox. Data are mean ± SEM normalized to untreated cells (n = 3 biologically independent experiments). (I) Is PARylation upstream of formyl-dU (red star) removal by SMUG1? (J) PARylation by PARPs occurs downstream of SMUG1. Immunoblot of WCEs in ALC1+/+SMUG1+/+, ALC1+/+SMUG1−/−, ALC1−/−SMUG1+/+, and ALC1−/−SMUG1−/− cells with indicated treatments, probed for ALC1, SMUG1, and anti-PAR binding reagent. α-tubulin was used as a loading control. (K) Schematic illustrating (BER) repair of formyl-dU (red star). The monofunctional glycosylase SMUG1 catalyzes the removal of formyl-dU, creating an abasic (AP) site. The endonuclease APEX1 catalyzes the incision of the DNA backbone, leaving a 5′-deoxyribose phosphate. (L) Immunoblot of WCEs in cells with indicated genotypes probed for ALC1 and APEX1. α-tubulin was used as a loading control. (M) Formyl-dU survival of ALC1+/+APEX1+/+, ALC1+/+APEX1−/−, ALC1−/−APEX1+/+, and ALC1−/−APEX−/− cells. Data are mean ± SEM normalized to untreated cells (n = 3 independent biological experiments). (N) MMS survival of ALC1+/+APEX1+/+, ALC1+/+APEX1−/−, ALC1−/−APEX1+/+, and ALC1−/−APEX1−/− cells. Data are mean ± SEM normalized to untreated cells (n = 3 independent biological experiments). (O) Olaparib survival of ALC1+/+APEX1+/+, ALC1+/+APEX1−/−, ALC1−/−APEX1+/+, and ALC1−/−APEX1−/− cells. Data are mean ± SEM normalized to untreated cells (n = 3 independent biological experiments). Solid lines show a nonlinear least-squares fit to a four-parameter dose-response model. (P) Is incision by APEX1 required for ALC1 recruitment? (Q) ALC1 recruitment is upstream of incision by APEX1. Immunoblot of CSK chromatin fractionation in cells with indicated genotype ± formyl-dU treatment, probed for ALC1, PARP1, SMUG1, and APEX1. α-tubulin and histone H3 were used as loading controls. (R) Representative images (n = 3 biologically independent experiments) of clonogenic survival assays in ALC1+/+APEX1+/+, ALC1+/+APEX1−/−, ALC1−/−APEX1+/+, and ALC1−/−APEX1−/− eHAP cells transfected with non-targeting or BRCA2-targeting siRNAs ± 50 nM Olaparib. (S) Quantification of clonogenic survival assays in ALC1+/+APEX1+/+, ALC1+/+APEX1−/−, ALC1−/−APEX1+/+, and ALC1−/−APEX1−/− eHAP cells transfected with non-targeting or BRCA2-targeting siRNAs ± 50 nM Olaparib. Data are mean ± SEM normalized to non-treated ALC1+/+APEX1+/+ (n = 3 biologically independent experiments).
Figure 7
Figure 7
The monofunctional glycosylase MPG drives MMS sensitivity and contributes to synthetic lethality with BRCA1/2 in ALC1-deficient cells (A and B) Processing of endogenous lesions by SMUG1 does not drive synthetic lethality with BRCA1/2 in ALC1-deficient cells. (A) Immunoblot of WCEs in ALC1+/+ and ALC1−/−iCAS9 cells transduced with NT sgRNA or SMUG1 sgRNA following 72 h Dox and transfected with non-targeting or BRCA1/2-targeting siRNAs, probed with ALC1, BRCA1, BRCA2, and SMUG1. Ponceau was used as a loading control. (B) Survival in ALC1+/+ and ALC1−/−iCAS9 cells transduced with NT sgRNA or SMUG1 sgRNA following 72 h Dox and transfected with non-targeting or BRCA1/2-targeting siRNAs. Cell survival was measured using CellTiter-Glo. Data are mean ± SEM normalized to ALC1+/+ cells (n = 3 independent biological experiments). (C–E) The monofunctional glycosylase MPG drives MMS sensitivity in ALC1-deficient cells. (C) The monofunctional glycosylase MPG catalyzes the removal of alkylated bases, creating an abasic (AP) site. (D) Immunoblot of WCEs in ALC1+/+ and ALC1−/− eHAP transfected with non-targeting or MPG-targeting siRNAs, probed for ALC1 and MPG. α-tubulin was used as a loading control. (E) MMS survival of ALC1+/+ALC1−/− eHAP cells transfected with non-targeting or MPG-targeting siRNAs. Data are mean ± SEM normalized to untreated cells (n = 3 independent biological experiments). (F–H) Processing of endogenous lesions by MPG contributes to synthetic lethality with BRCA1/2 in ALC1-deficient cells. (F) Immunoblot of WCEs in ALC1+/+ and ALC1−/− eHAP transfected with non-targeting, MPG, BRCA1/2-targeting siRNAs, probed with ALC1, BRCA1, BRCA2, and MPG. α-tubulin was used as a loading control. (G) Representative images (n = 3 biologically independent experiments) of clonogenic survival assays in ALC1+/+ and ALC1−/− eHAP cells transfected with non-targeting, MPG, and BRCA1/2-targeting siRNAs. (H) Quantification of clonogenic survival assays in ALC1+/+and ALC1−/− eHAP cells transfected with non-targeting, MPG, and BRCA1/2-targeting siRNAs. Data are mean ± SEM normalized to non-treated ALC1+/+ (n = 3 biologically independent experiments).

References

    1. Ahel D., Horejsí Z., Wiechens N., Polo S.E., Garcia-Wilson E., Ahel I., Flynn H., Skehel M., West S.C., Jackson S.P. Poly(ADP-ribose)-dependent regulation of DNA repair by the chromatin remodeling enzyme ALC1. Science. 2009;325:1240–1243. - PMC - PubMed
    1. Alexeeva M., Moen M.N., Grøsvik K., Tesfahun A.N., Xu X.M., Muruzábal-Lecumberri I., Olsen K.M., Rasmussen A., Ruoff P., Kirpekar F. Excision of uracil from DNA by hSMUG1 includes strand incision and processing. Nucleic Acids Res. 2019;47:779–793. - PMC - PubMed
    1. Bellelli R., Borel V., Logan C., Svendsen J., Cox D.E., Nye E., Metcalfe K., O’Connell S.M., Stamp G., Flynn H.R. Polepsilon Instability Drives Replication Stress, Abnormal Development, and Tumorigenesis. Mol. Cell. 2018;70:707–721. e707. - PMC - PubMed
    1. Bilokapic S., Suskiewicz M.J., Ahel I., Halic M. Bridging of DNA breaks activates PARP2-HPF1 to modify chromatin. Nature. 2020;585:609–613. - PMC - PubMed
    1. Bryant H.E., Schultz N., Thomas H.D., Parker K.M., Flower D., Lopez E., Kyle S., Meuth M., Curtin N.J., Helleday T. Specific killing of BRCA2-deficient tumours with inhibitors of poly(ADP-ribose) polymerase. Nature. 2005;434:913–917. - PubMed

Publication types

MeSH terms