. 2021 Jan 7;184(1):207-225.e24.
doi: 10.1016/j.cell.2020.11.030. Epub 2020 Dec 16.

RNA-Mediated Feedback Control of Transcriptional Condensates

Affiliations

RNA-Mediated Feedback Control of Transcriptional Condensates

Jonathan E Henninger et al. Cell. .

Abstract

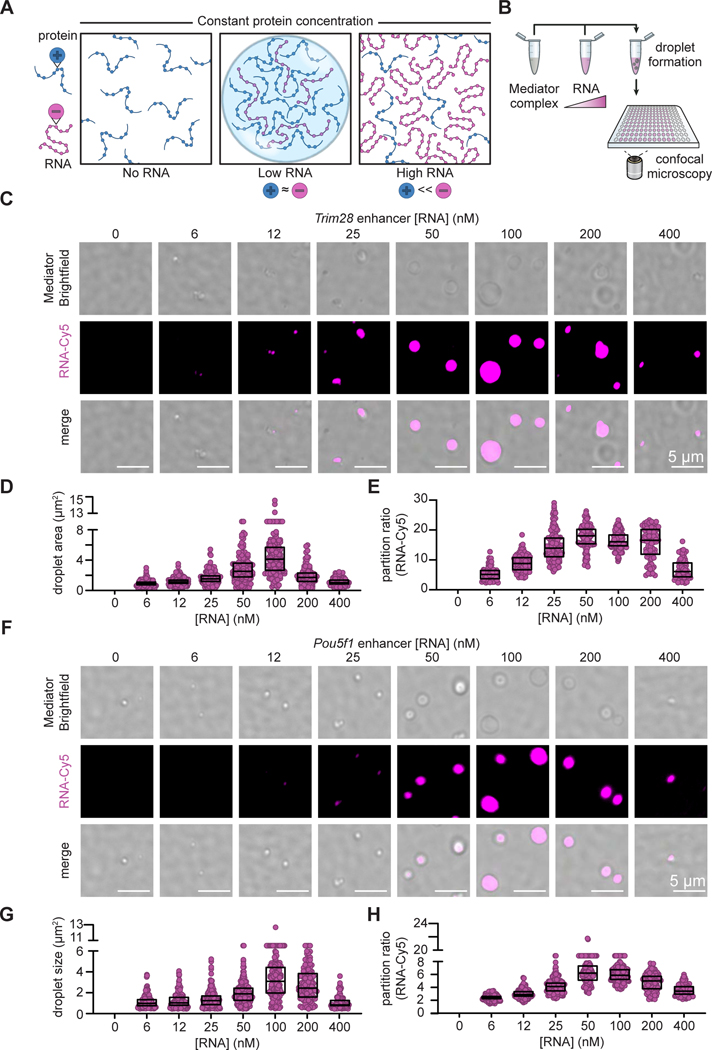
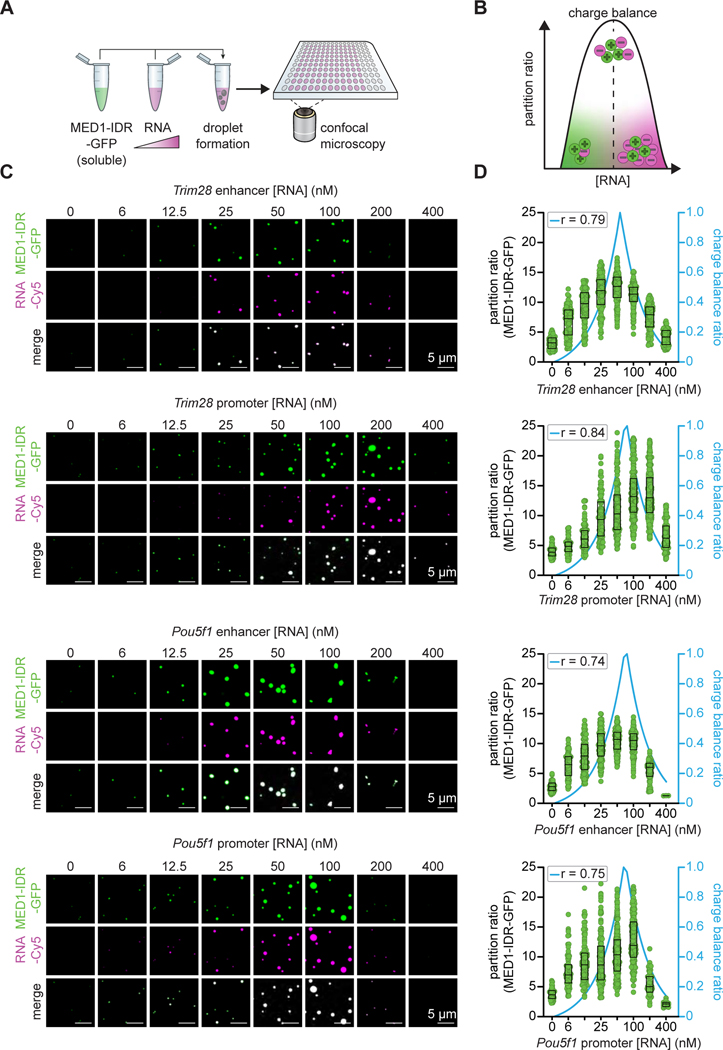
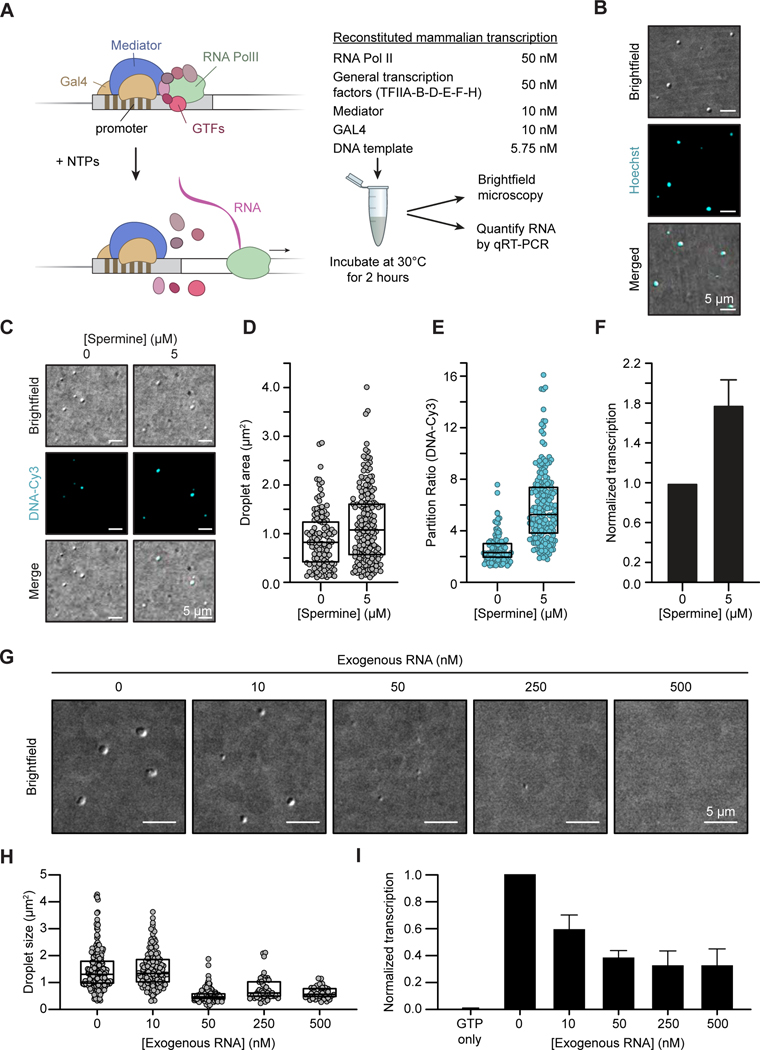
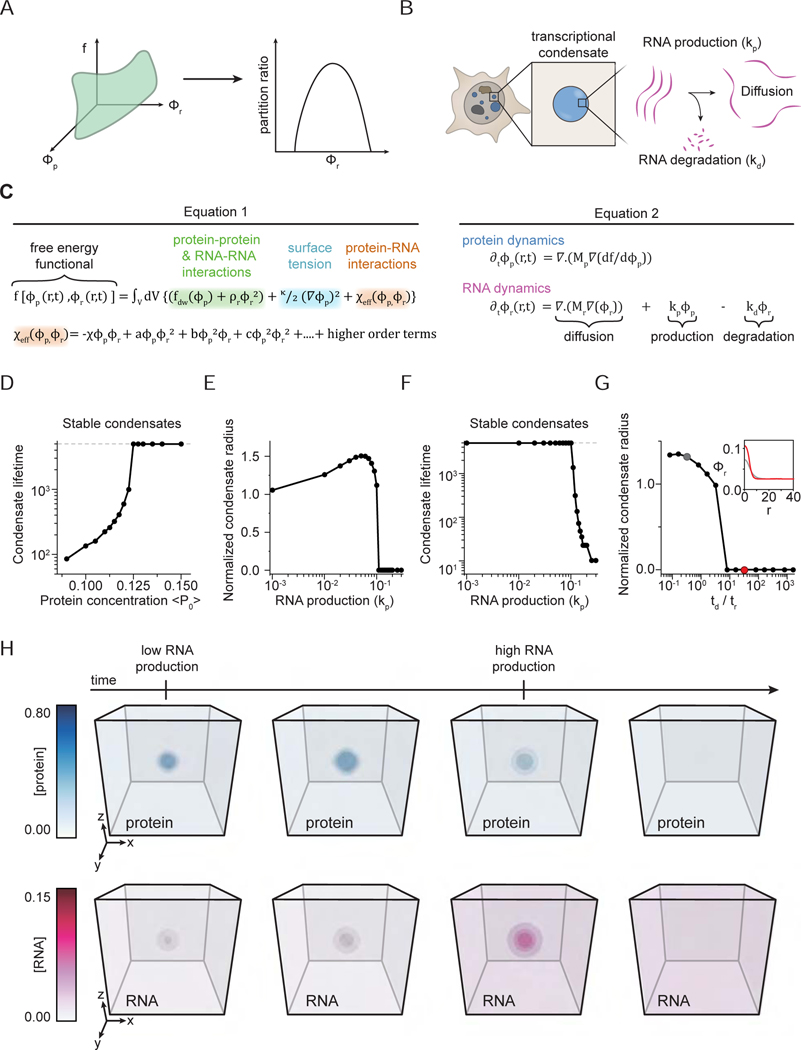
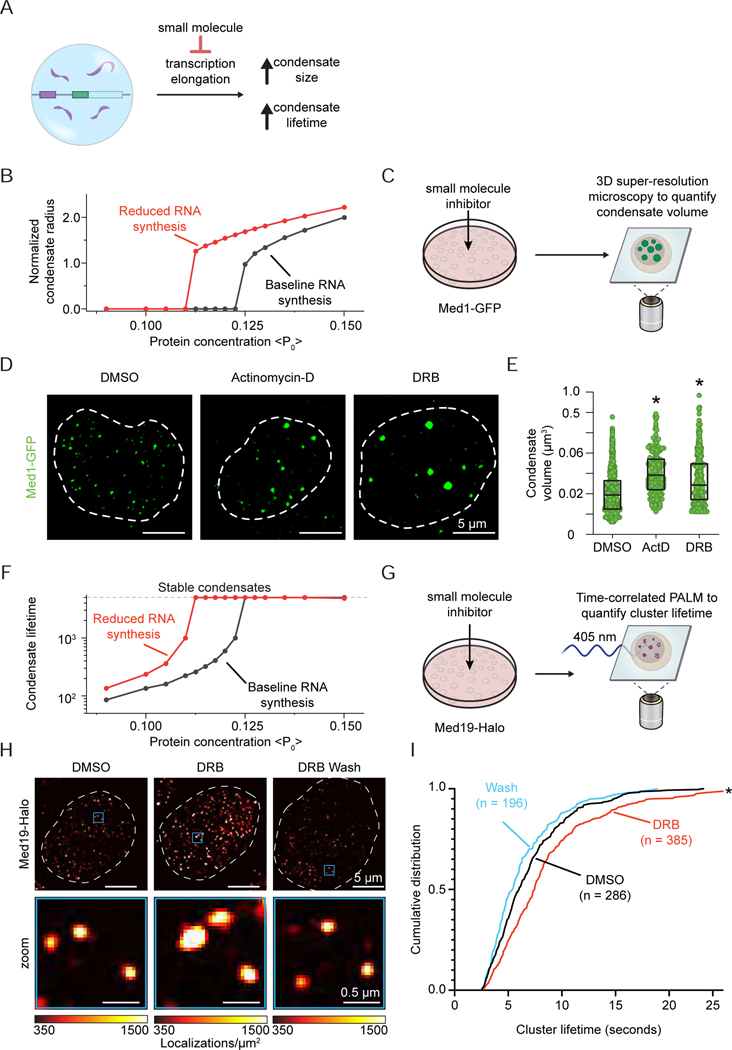
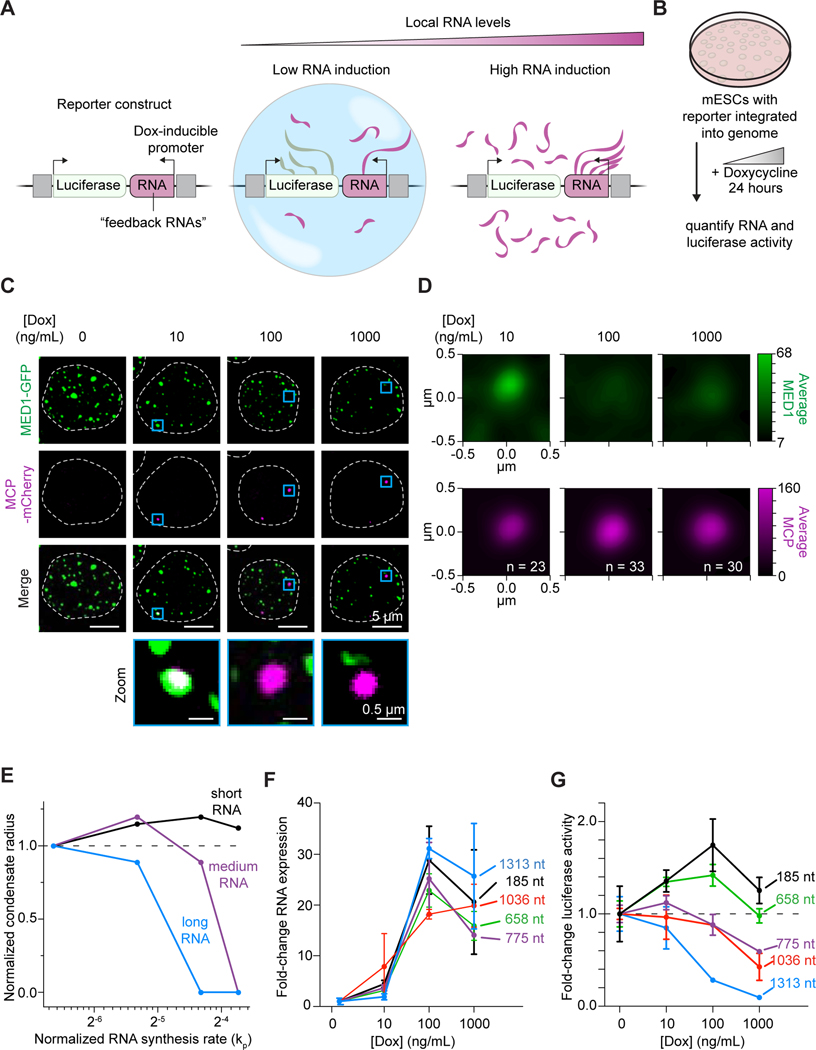
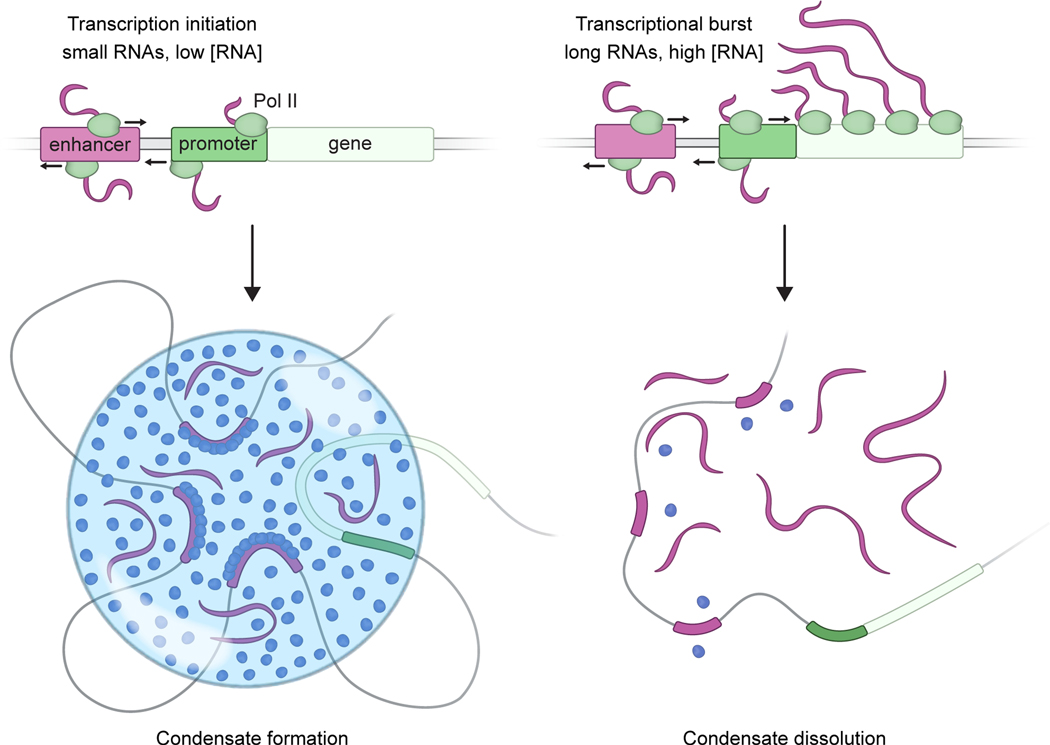
Regulation of biological processes typically incorporates mechanisms that initiate and terminate the process and, where understood, these mechanisms often involve feedback control. Regulation of transcription is a fundamental cellular process where the mechanisms involved in initiation have been studied extensively, but those involved in arresting the process are poorly understood. Modeling of the potential roles of RNA in transcriptional control suggested a non-equilibrium feedback control mechanism where low levels of RNA promote condensates formed by electrostatic interactions whereas relatively high levels promote dissolution of these condensates. Evidence from in vitro and in vivo experiments support a model where RNAs produced during early steps in transcription initiation stimulate condensate formation, whereas the burst of RNAs produced during elongation stimulate condensate dissolution. We propose that transcriptional regulation incorporates a feedback mechanism whereby transcribed RNAs initially stimulate but then ultimately arrest the process.

Keywords: RNA; complex coacervates; enhancer; feedback; mediator; non-equilibrium; noncoding RNA; phase separation; transcription; transcriptional condensates.


Conflict of interest statement

Declaration of Interests R.A.Y. is a founder and shareholder of Syros Pharmaceuticals, Camp4 Therapeutics, Omega Therapeutics, and Dewpoint Therapeutics. T.I.L. is a shareholder of Syros Pharmaceuticals and a consultant to Camp4 Therapeutics. A.K.C. and P.A.S. are shareholders and consultants to Dewpoint Therapeutics. A.K.C. is a SAB member of Omega Therapeutics. The Whitehead Institute has filed a patent application based on this study.

Figures

Figure 1.
Figure 1.. Low levels of RNA enhance and high levels dissolve Mediator condensates
A. Diagram of reentrant phase transition in response to increasing concentration of RNA over constant protein concentration. The condensed fraction of protein peaks at the RNA concentration at which the charges between protein and RNA are balanced, while alteration of this charge balance in either direction decreases the condensed fraction. B. Experimental design for in vitro droplet formation assay. Whole Mediator complex is mixed with increasing concentrations of RNA under physiologically-relevant buffer conditions and droplets are imaged under confocal microscopy. C. Representative images of droplets formed by the unlabeled whole Mediator complex (200 nM) and Cy5-labeled Pou5f1 enhancer RNA at increasing concentrations (0–400 nM). Brightfield images of the Mediator complex were divided by a median-filtered image (px=15) here and the subsequent panels. D. Droplet sizes in (C). E. Partition ratios of Cy5-labeled RNA within the droplets in (C). F. Representative images of droplets formed by the unlabeled whole Mediator complex (200 nM) and Cy5-labeled Trim28 enhancer RNA at increasing concentrations (0–400 nM). G. Droplet sizes in (F). H. Partition ratios of Cy5-labeled RNA within the droplets in (F). See also Figure S1
Figure 2.
Figure 2.. Charge balance mediates the regulation of MED1-IDR condensates by RNA
A. Experimental design for in vitro droplet formation assay. Soluble MED1-IDR-GFP is mixed with increasing concentrations of RNA under physiologically relevant buffer conditions and droplets are imaged with confocal microscopy. B. Scheme of charge balance ratio between constant protein concentration and increasing RNA concentration. C. Representative images of droplets formed by increasing concentrations (0–400 nM) of the indicated RNAs mixed with 1 μM of MED1-IDR-GFP. D. Partition ratios of MED1-IDR-GFP within the droplets in (C) (left y-axis). Charge balance ratios between MED1-IDR-GFP and increasing concentrations of the indicated RNAs are shown in blue lines (right y-axis). Correlation between partition ratio and charge balance is determined by Pearson correlation (r). See also Figures S2, S3 and S4
Figure 3.
Figure 3.. RNA-mediated effects on condensates in reconstituted in vitro transcription assays
A. Cartoon representation of the reconstituted in vitro mammalian transcription assay with purified components (left) and the design of the assay (right) (STAR Methods). B. Brightfield images of droplets formed within the in vitro transcription reaction. Droplets are stained with DNA dye (Hoechst). Brightfield images were white tophat filtered and smoothed here and in the subsequent panels (STAR Methods). C. Brightfield images of droplets formed within the in vitro transcription reaction performed in the presence of indicated spermine concentrations. Template DNA is labeled with Cy3. D. Droplet sizes in (C) (p=0.0011, Student’s t-test). E. Partition ratio of Cy3-labeled template DNA into the droplets in (C) (p<0.0001, Student’s t-test). F. qRT-PCR of transcriptional output upon addition of spermine. The values are normalized to the no spermine condition. The mean of 2 replicates are shown and error bars depict S.D. (p=0.0477, Student’s t-test). G. Representative images of droplets in the in vitro transcription reaction in the presence of indicated amounts of exogenous RNA. H. Droplet sizes in (G) (p=0.9309 0 vs. 10; p<0.001 for 0 vs. 50, 250, and 500, one-way ANOVA). I. qRT-PCR of transcriptional output upon addition of increasing concentration of exogenous RNA. The values are normalized to no RNA condition. The mean of 2 replicates are shown and error bars depict S.D. (p=0.0001 GTP only vs. 0; p=0.0111 0 vs. 10; p=0.0013 0 vs. 50; p=0.0008 0 vs. 250; p=0.008 0 vs. 500, one-way ANOVA). See also Figure S5
Figure 4.
Figure 4.. A model for RNA-mediated non-equilibrium feedback control of transcriptional condensates
A. Schematic of coarse-grained free-energy (f, green-surface) which depends on the transcriptional protein (ϕp) and RNA (ϕr) concentrations. This free-energy recapitulates in vitro observations of an equilibrium reentrant transition. B. Schematic of the non-equilibrium model coupling transcriptional activity with transcriptional condensate dynamics. In the model framework, we focus on a local micro-environment near a single transcriptional condensate (blue). RNA (magenta) is synthesized, degraded, and can diffuse. C. Equations underlying construction of the free-energy function (Equation 1) and dynamics of protein and RNA (Equation 2) (STAR Methods). D. Simulation predictions of transcriptional condensate lifetime with varying total protein concentrations (2D simulation grid). The dashed-line represents the lifetime of condensates (in units of simulation time) that don’t dissolve at steady state. E. F. Simulation predictions of transcriptional condensate radius (E) and lifetime (F) at varying effective rates of RNA synthesis (2D simulation grid). The radius values are normalized to r=6.0 mesh units. The dashed line in F represents lifetime of stable condensates in units of simulation time (STAR Methods). G. Variation of normalized condensate radius (ordinate, normalized to r=6.0 mesh units) with changing relative time-scales of reaction and diffusion (abcissa, td/tr) (2D simulation grid). In these simulations, the total effective concentration of RNA produced is held constant (see text). The inset graphs the distribution of RNA concentrations at early simulation times (tstep = 100) for two different values of td/tr (highlighted in the main panel with corresponding colors). H. Visualization of protein (blue) and RNA (magenta) concentration fields over simulation time for 3D simulations. The condensate is initialized (first panel) and then grows under low transcriptional activity (second panel). After a finite-time (tstep = 1000), the effective rate of RNA synthesis (kp) is increased by 2.5-fold, which in turn, drives condensate shrinkage (third panel) and ultimately, dissolution (fourth panel) (STAR Methods). See also Figures S6 and S7
Figure 5.
Figure 5.. Inhibition of RNA elongation leads to enhanced condensate size and lifetime in cells
A. Scheme for preventing condensate dissolution upon transcriptional burst by treatment with small molecules that inhibit transcriptional elongation. B. Simulation predictions show variation of normalized condensate radius with total protein amount (abscissa) in absence (black, kp =0.1) and presence (red, kp = 0.05) of RNA synthesis inhibition (2D simulation grid). The radius is normalized by the radius at kp = 0.05 < P0 > = 0.115. C. Experimental design to test the effect of transcriptional inhibition on the size of Mediator condensates. MED1-GFP mESCs are imaged by 3D super-resolution microscopy after treatment with small molecules. D. Max intensity projection images of single nuclei tagged with endogenous Med1-GFP in the presence of indicated transcriptional inhibitors or DMSO control. E. Volumes of Med1-GFP condensates in (D). (p-value for DMSO vs. ActD < 0.0001 and p-value for DMSO vs. DRB < 0.0001, one-way ANOVA). F. Simulation predictions show variation of condensate lifetime with total protein amount (abscissa) in absence (black, kp =0.1) and presence (red, kp = 0.05) of RNA synthesis inhibition (2D simulation grid). The lifetime is presented in units of simulation time. G. Experimental design to test the effect of DRB on the lifetime of Mediator clusters in Med19-tagged mESCs. Lifetimes are quantified by time-correlated PALM. H. Representative heatmap of Med19-Halo localizations in single nucleus upon addition of transcriptional inhibitor DRB, DRB wash or DMSO control. I. Cumulative distribution frequency plot of condensate lifetime in response to indicated treatments are shown (p < 0.0001, one-way ANOVA). See also Figure S7
Figure 6.
Figure 6.. Increasing the levels of local RNA synthesis reduces condensate formation and transcription in cells
A. Scheme depicting the reporter system (left) where local RNA expression near a luciferase reporter gene can be induced by doxycycline. B. Experimental design to test the effect of increasing local RNA levels on condensate formation and on reporter gene expression. C. Live-cell imaging showing localization of Mediator condensates and MS2-tagged RNA expressed near the reporter gene at indicated dox stimulations. Med1-GFP mESCs have an integrated reporter system and 2xMCP-mCherry to visualize MS2-tagged RNA (2456 nt). Representative images are maximum projections that have been subtracted by a median filter and smoothed (STAR Methods). D. Average density of MED1 signal centered at RNA signal at indicated dox stimulations (p=0.066 10 ng/mL vs 100 ng/mL Dox;p=0.013 10 ng/mL vs 1000 ng/mL Dox, p=0.315 100 ng/mL vs 1000 ng/mL, 2-way Kolmongorov-Smirnoff test). E. Simulations predict the variation of condensate size with increasing effective rates of RNA synthesis (abscissa) (2D simulation grid). The condensate radius is normalized by value at rate=1 and RNA synthesis rates are normalized to kp = 0.02 (STAR Methods) F. qRT-PCR of various “feedback RNAs” with increasing dox concentrations. Markers show the mean of at least 3 replicates and error bars depict the S.D. G. Luciferase luminescence with increasing dox concentrations. Markers show the mean of at least 3 replicates and error bars depict the S.D. See also Figure S7
Figure 7.
Figure 7.. A model for RNA-mediated feedback control of transcriptional condensates
Cartoon depicting a model whereby low levels of RNA present at transcription initiation promote condensate formation while high levels of RNA present during a transcriptional burst promote condensate dissolution.

Comment in

  • RNA-mediated (de)condensation.
    Zlotorynski E. Zlotorynski E. Nat Rev Mol Cell Biol. 2021 Mar;22(3):164. doi: 10.1038/s41580-021-00340-2. Nat Rev Mol Cell Biol. 2021. PMID: 33526934 No abstract available.

Similar articles

Cited by

References

    1. Adelman K, and Lis JT (2012). Promoter-proximal pausing of RNA polymerase II: emerging roles in metazoans. Nat Rev Genet 13, 720–731. - PMC - PubMed
    1. Adhikari S, Leaf MA, and Muthukumar M. (2018). Polyelectrolyte complex coacervation by electrostatic dipolar interactions. J Chem Phys 149, 163308. - PubMed
    1. Andersson R, Gebhard C, Miguel-Escalada I, Hoof I, Bornholdt J, Boyd M, Chen Y, Zhao X, Schmidl C, Suzuki T, et al. (2014). An atlas of active enhancers across human cell types and tissues. Nature 507, 455–461. - PMC - PubMed
    1. Andrews JO, Conway W, Cho W-K, Narayanan A, Spille J-H, Jayanth N, Inoue T, Mullen S, Thaler J, and Cissé II (2018). qSR: a quantitative super-resolution analysis tool reveals the cell-cycle dependent organization of RNA Polymerase I in live human cells. Scientific Reports 8, 1–10. - PMC - PubMed
    1. Aumiller WM, Pir Cakmak F, Davis BW, and Keating CD (2016). RNA-Based Coacervates as a Model for Membraneless Organelles: Formation, Properties, and Interfacial Liposome Assembly. Langmuir 32, 10042–10053. - PubMed

Publication types