. 2020 Dec 23;183(7):1913-1929.e26.
doi: 10.1016/j.cell.2020.11.017. Epub 2020 Dec 16.

Generation of Functional Human 3D Cortico-Motor Assembloids

Affiliations

Generation of Functional Human 3D Cortico-Motor Assembloids

Jimena Andersen et al. Cell. .

Abstract

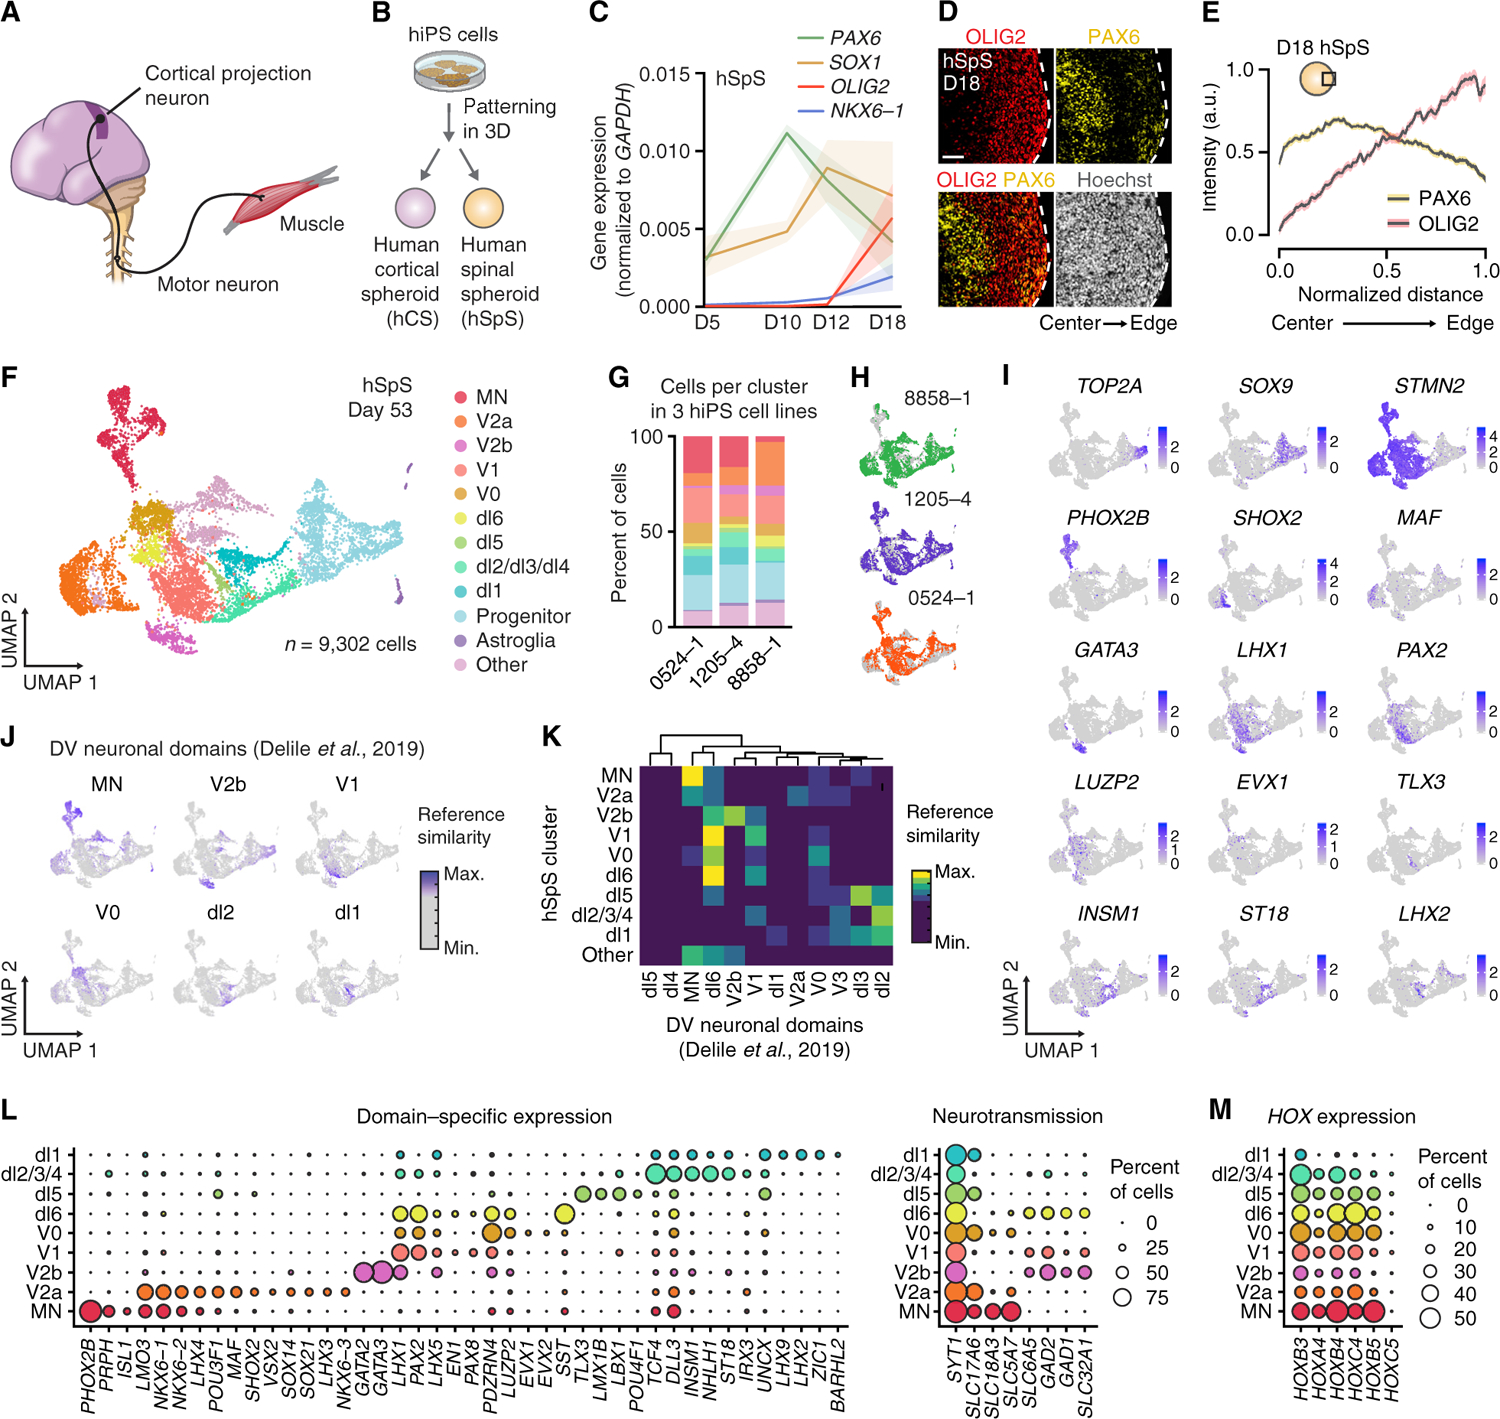
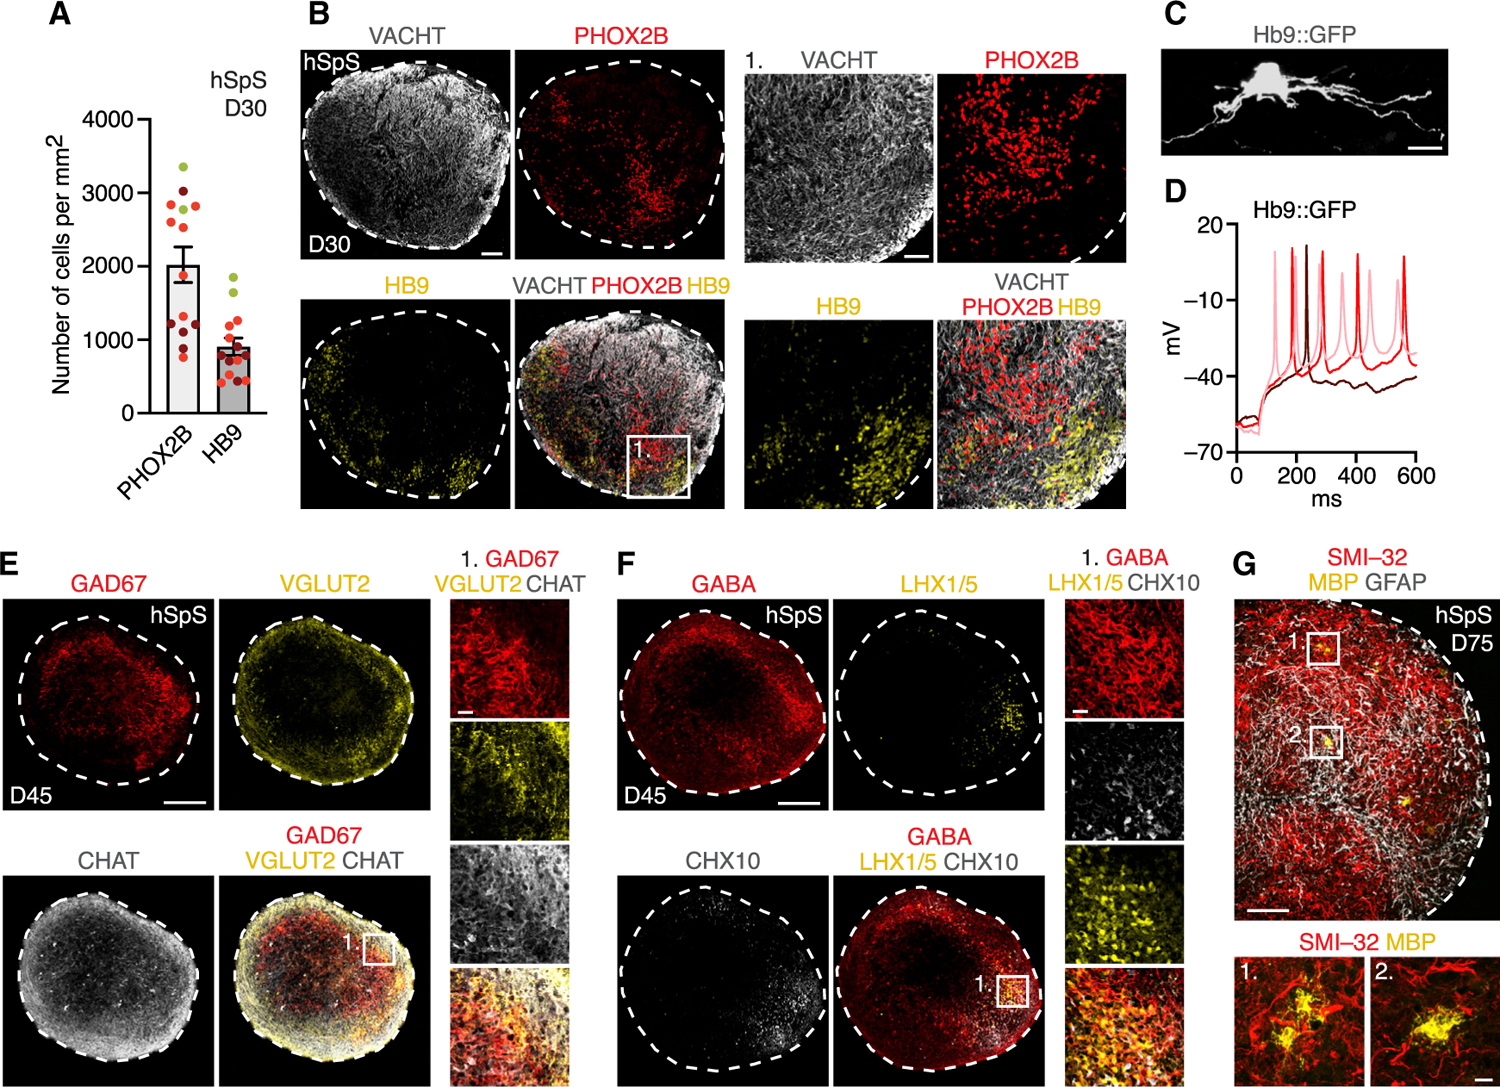
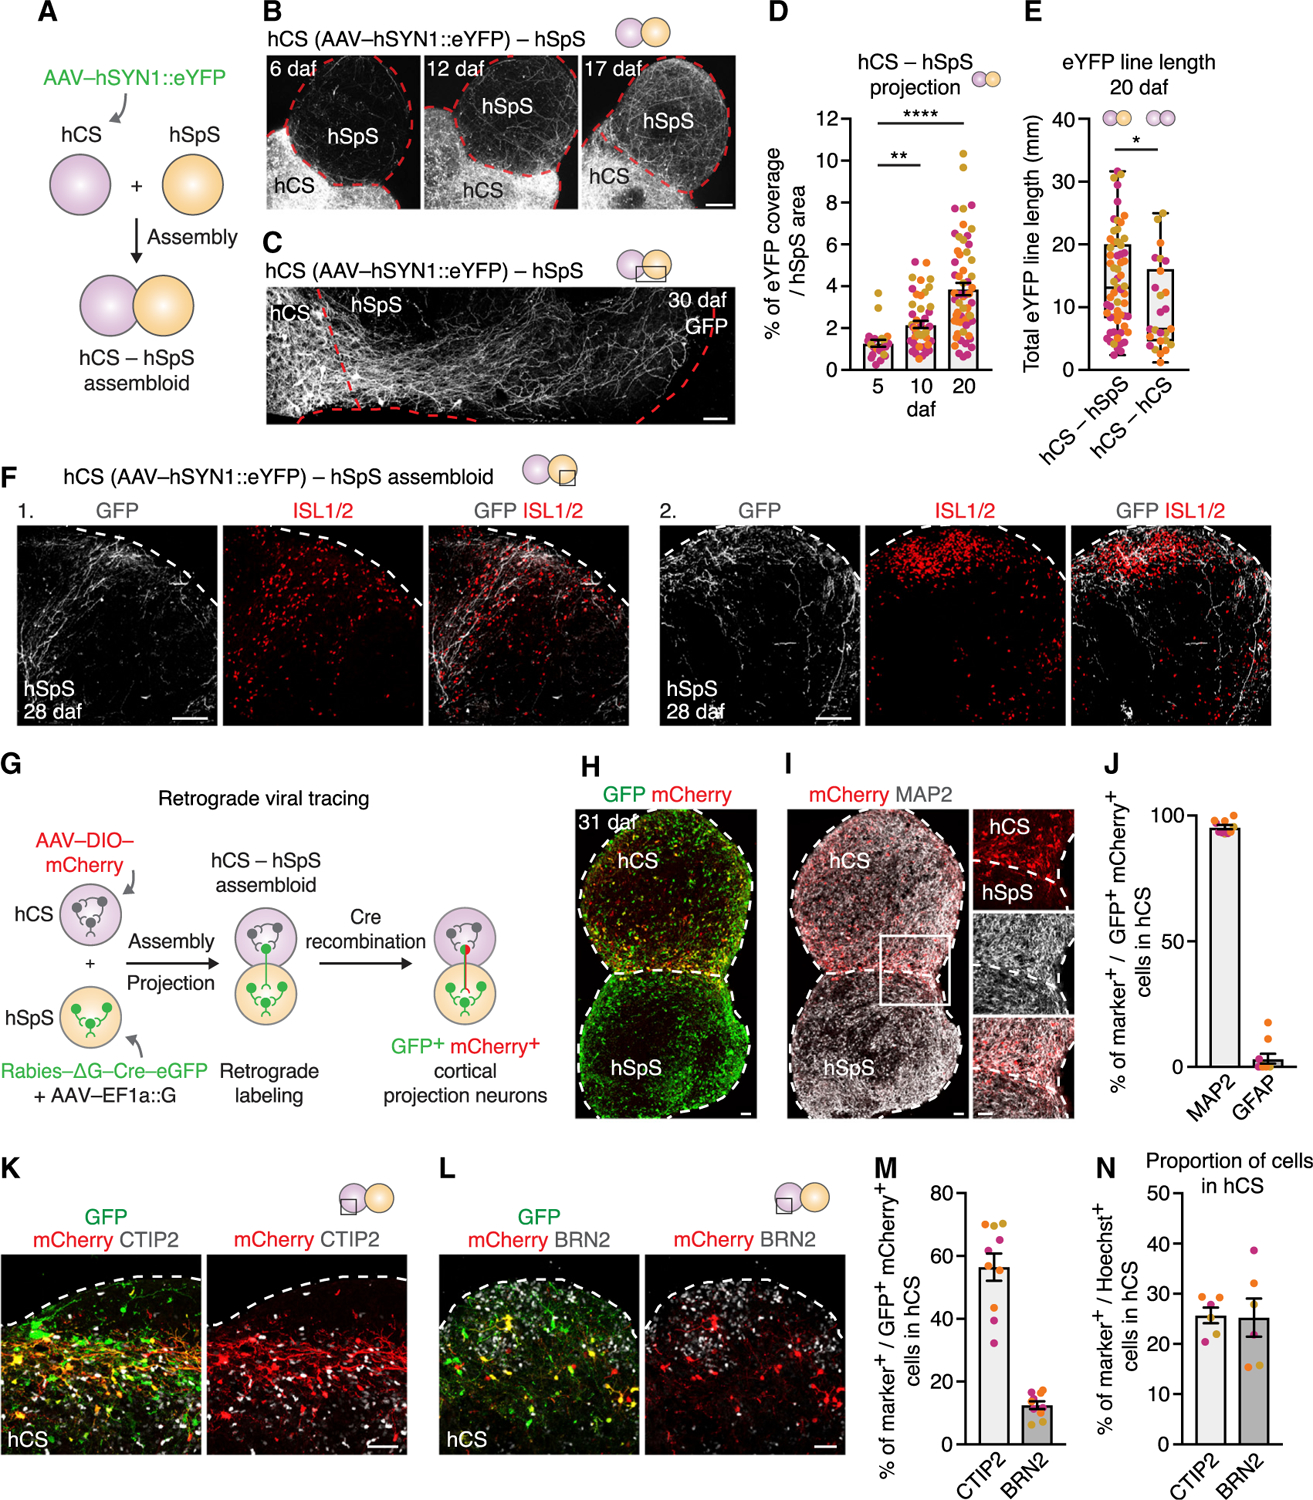
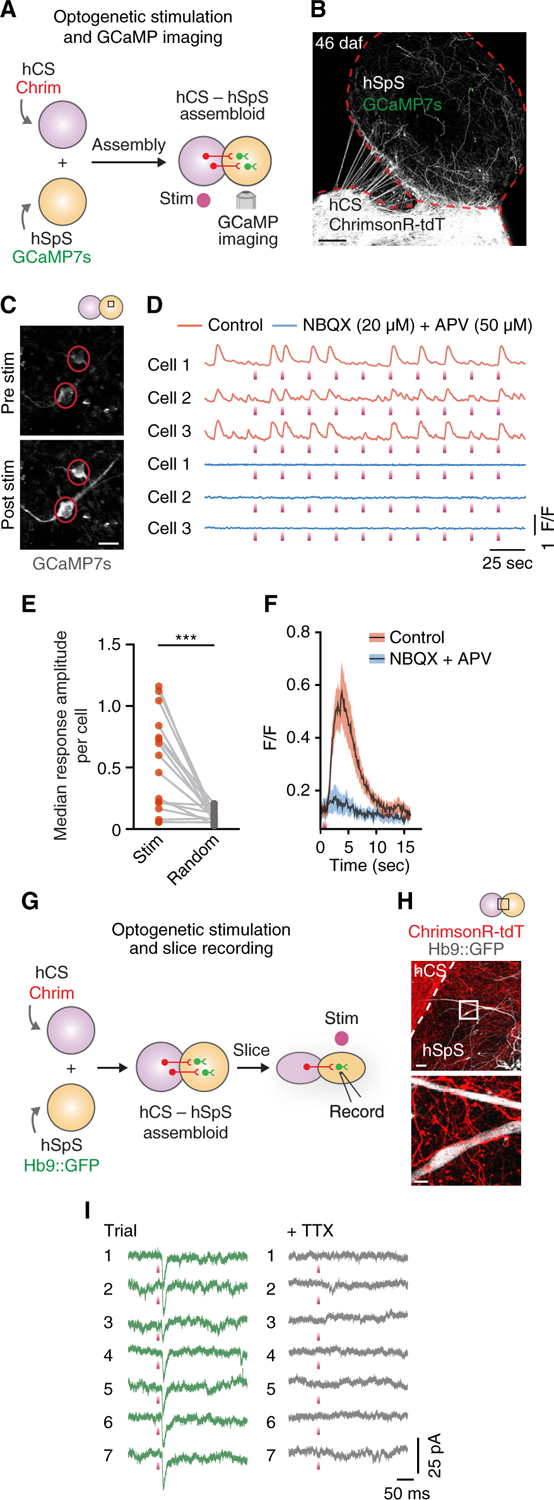
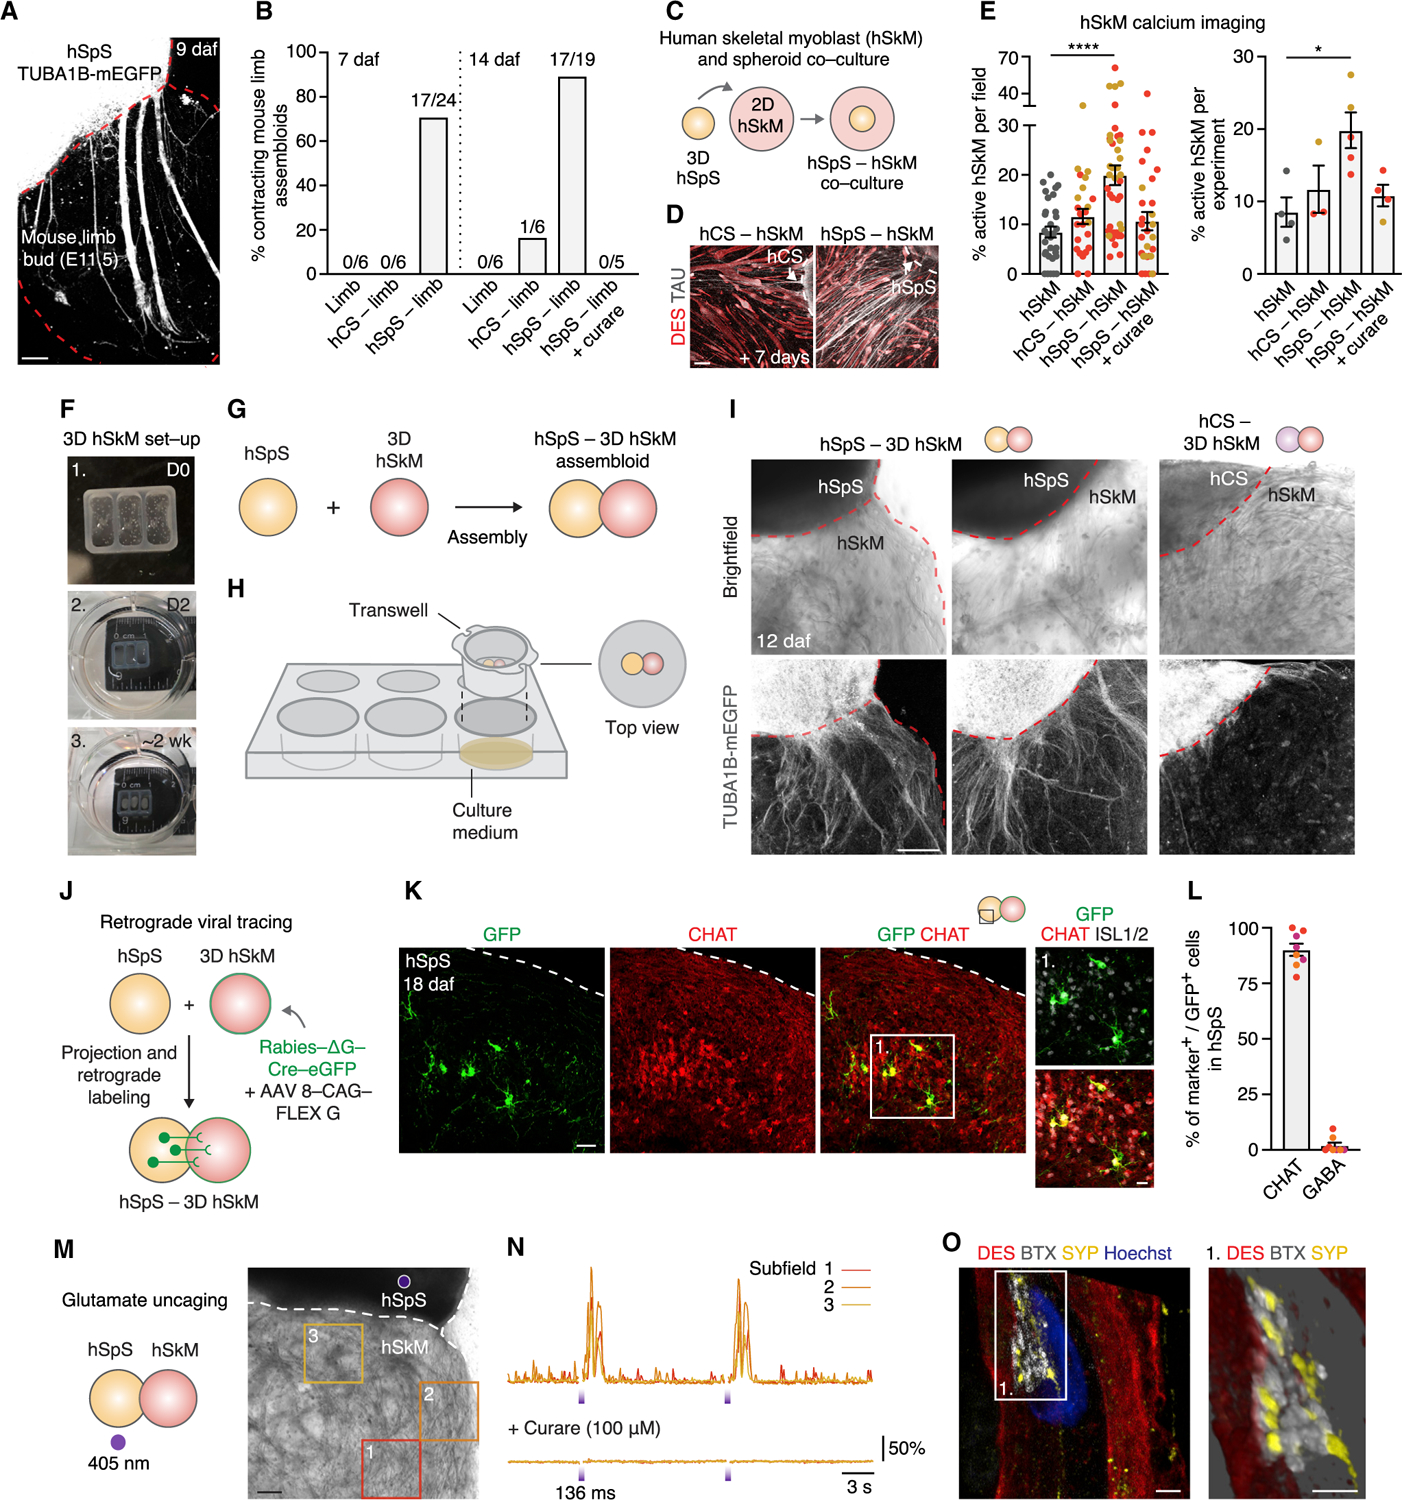
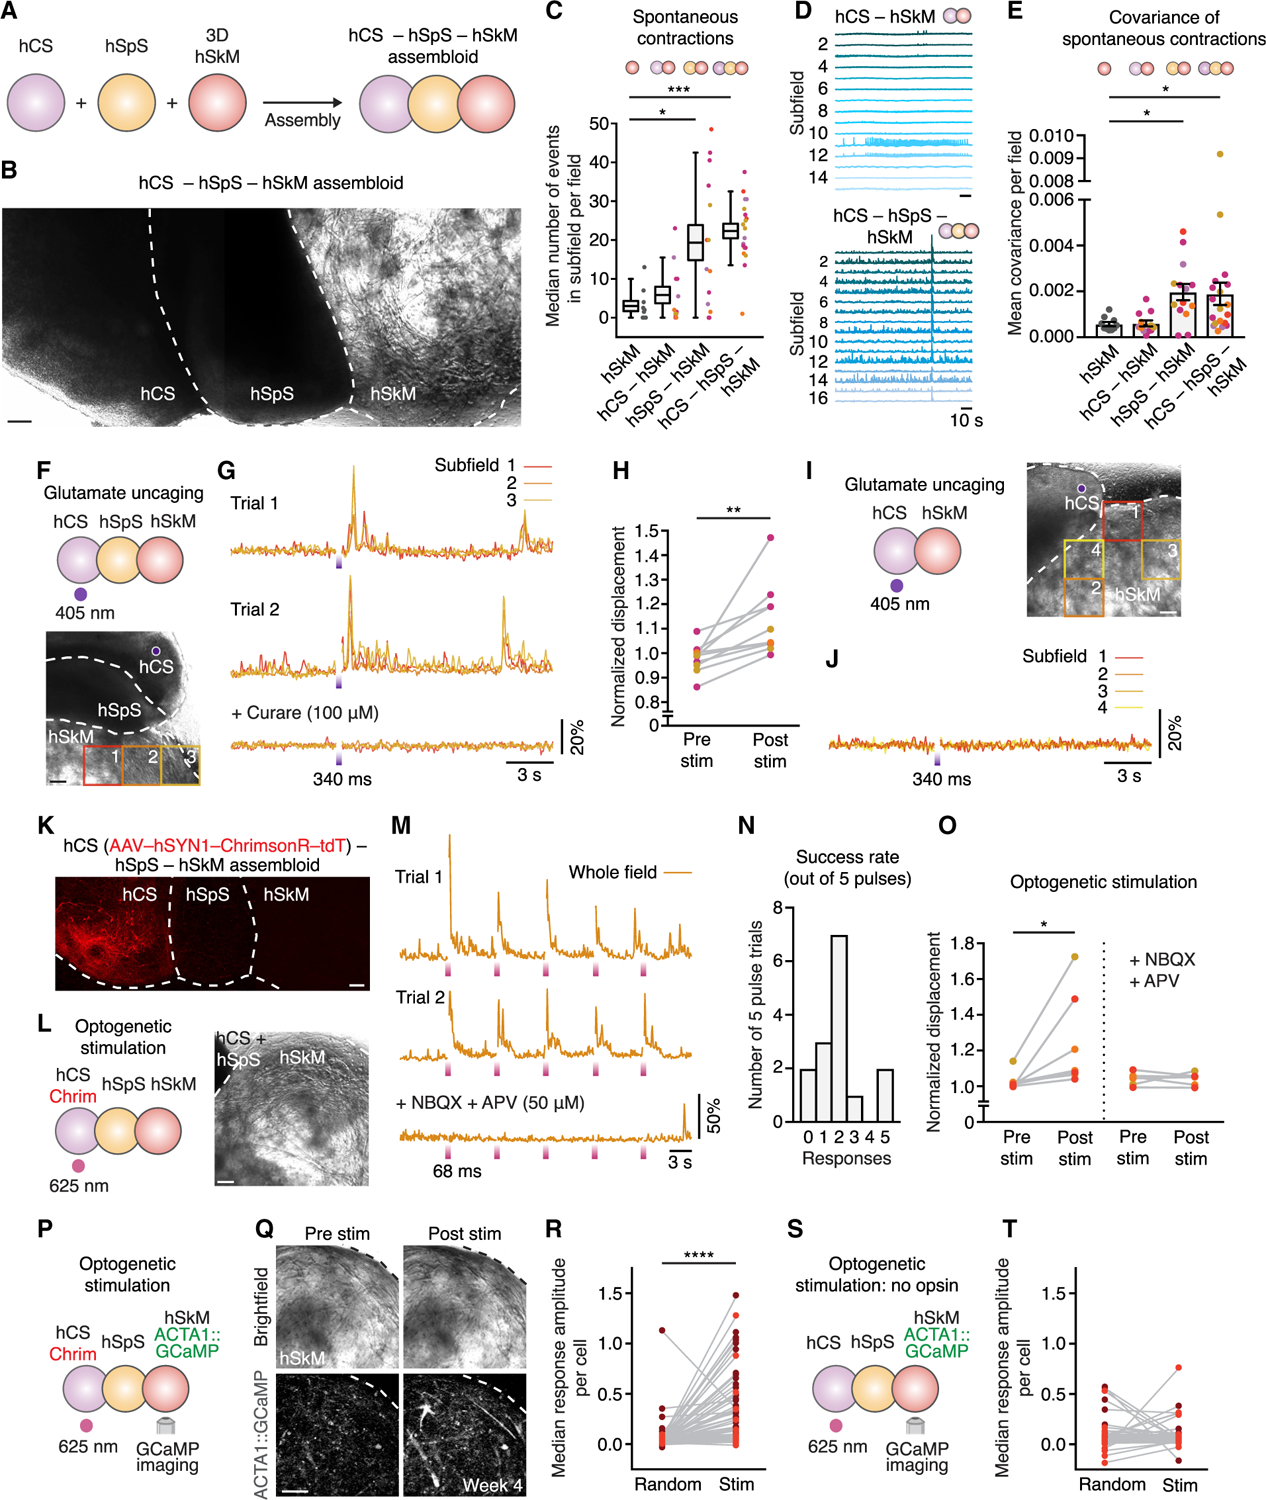
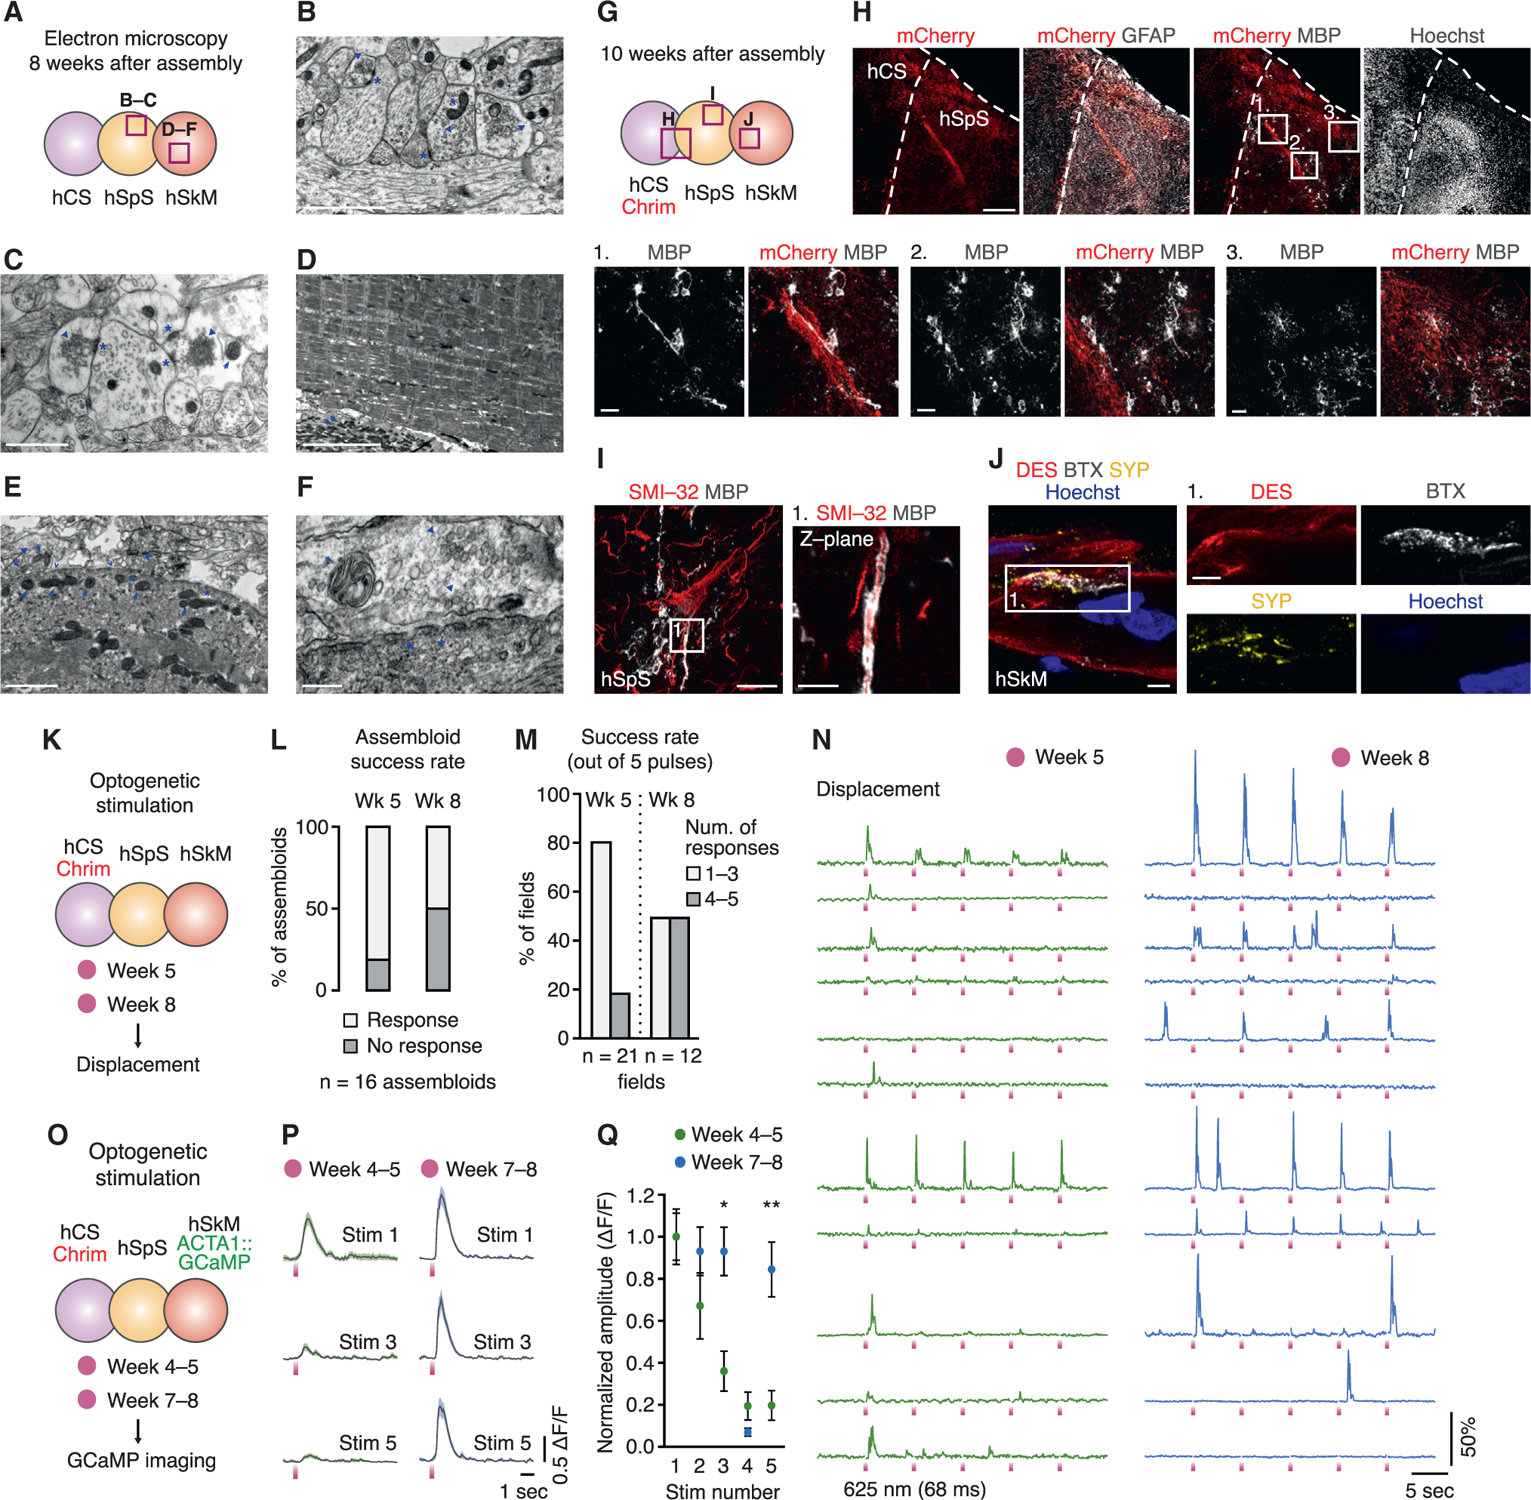
Neurons in the cerebral cortex connect through descending pathways to hindbrain and spinal cord to activate muscle and generate movement. Although components of this pathway have been previously generated and studied in vitro, the assembly of this multi-synaptic circuit has not yet been achieved with human cells. Here, we derive organoids resembling the cerebral cortex or the hindbrain/spinal cord and assemble them with human skeletal muscle spheroids to generate 3D cortico-motor assembloids. Using rabies tracing, calcium imaging, and patch-clamp recordings, we show that corticofugal neurons project and connect with spinal spheroids, while spinal-derived motor neurons connect with muscle. Glutamate uncaging or optogenetic stimulation of cortical spheroids triggers robust contraction of 3D muscle, and assembloids are morphologically and functionally intact for up to 10 weeks post-fusion. Together, this system highlights the remarkable self-assembly capacity of 3D cultures to form functional circuits that could be used to understand development and disease.

Keywords: assembloids; cerebral cortex; connectivity; corticospinal; human pluripotent stem cells; neuromuscular; optogenetics; organoids; rabies tracing; spinal cord.


Conflict of interest statement

Declaration of Interests Stanford University has filed a provisional patent application that covers the generation and assembly of region-specific cortico-spinal-muscle spheroids. H.C.F. and E.M.W. were employees of BD Genomics during this study.

Figures

Figure 1.
Figure 1.. Generation of hSpS from hiPS Cells
(A) Schematic illustrating the main cellular components of the cortico-motor system. (B) Schematic illustrating the generation of human cortical spheroids (hCS) and human spinal spheroids (hSpS) from hiPS cells. (C) Gene expression (RT-qPCR) of spinal cord-related gene markers at 5, 10, 12, and 18 days in hSpS. Data represent mean ± SEM (n = 3 hiPS cell lines from 1 differentiation; two-way ANOVA, interaction F[9,32] = 3.29, p = 0.005). (D) Representative immunocytochemistry images of OLIG2 and PAX6 in hSpS at day 18. Scale bar, 50 µm. (E) Fluorescence intensity analysis showing expression of OLIG2 and PAX6 plotted versus the distance from the center (left) to the edge (right) of hSpS at day 18. Black traces represent the mean and shaded bars represent the SEM (n = 20 hSpS derived from 3 hiPS cell lines from 2 separate differentiations, with 2–4 cryosections quantified per hSpS). (F) UMAP visualization of single cell gene expression of hSpS at day 53 (n = 9,302 cells from 3 hiPS cell lines). (G) Graph showing the percentage of cells in each of the three hiPS cell lines used for this experiment belonging to each cluster in hSpS. (H) UMAP plot showing cells separately colored by the hiPS cell line they were derived from. (I) UMAP plots showing gene expression of selected hSpS cluster-specific markers. Colored scale shows normalized gene expression data, log (counts per 10,000). (J) hSpS UMAP plots colored by reference similarity spectrum (RSS) to selected single-cell RNA sequencing (RNA-seq) clusters from mouse spinal cord from Delile et al. (2019). (K) Hierarchical clustering showing RSS analysis of hSpS clusters to single-cell RNA-seq clusters from mouse developing spinal cord neuronal clusters from Delile et al. (2019). (L and M) Dot plots showing the expression of selected domain-specific and neurotransmitter identity-related genes (L), and expression of HOX genes (M) in each of the neuronal clusters in hSpS. The size of the circle represents the percent of cells expressing each gene per cluster. See also Figures S1, S2, and S3 and Table S1.
Figure 2.
Figure 2.. Characterization of hSpS
(A) Quantification of the total number of cells expressing PHOX2B or HB9 per area (mm2) in 16 µm hSpS cryosections at day 30. Data represent mean ± SEM (n = 14 hSpS derived from 3 hiPS cell lines from 1–2 differentiations, with 2–4 cryosections quantified per hSpS). (B) Representative immunohistochemistry images of day 30 hSpS. (C) Immunocytochemistry showing a lenti-Hb9::GFP+ neuron in an hSpS cryosection. (D) Whole-cell current-clamp recording from an Hb9::GFP cell showing action potential generation in response to depolarizing current injections. (E and F) Representative immunohistochemistry images of neuronal domains with diverse neurotransmitter identities on day 45 hSpS. (G) Immunocytochemistry in day 75 hSpS showing expression of the astrocyte marker GFAP and the oligodendrocyte marker MBP. Scale bars, 10 µm (C), inset in (G), 20 µm (insets in E and F), 50 µm (inset in B), 100 µm (B and G), and 200 µm (E and F). See also Figure S4 and Table S1.
Figure 3.
Figure 3.. Generation of hCS-hSpS Assembloids and Characterization of Cortico-Spinal Projections
(A) Schematic illustrating the fusion of hCS and hSpS to form hCS-hSpS assembloids. (B) Representative images of intact hCS-hSpS assembloid showing hCS-derived hSYN1::eYFP projections 6, 12, and 17 days after fusion (daf). See Video S1 for live imaging of AAV-hSYN1::eYFP projection at 5 daf. (C) Immunocytochemistry of hCS-hSpS assembloid 30 days after fusion (daf). (D) Quantification of hCS-derived eYFP coverage in hSpS area at 5, 10, and 20 daf in hCS-hSpS assembloids (n = assembloids from 3 hiPS cell lines from 3 separate differentiations, Kruskal-Wallis test p < 0.0001 with Dunn’s multiple test comparison: **p = 0.009 for 10 daf versus 5 daf, ****p < 0.0001 for 20 daf versus 5 daf). (E) Quantification of total eYFP line length on the projection side of hCS-hSpS or hCS-hCS assembloids at 20 daf (n = 3 hiPS cell lines from 1–2 differentiations; Mann-Whitney test: *p = 0.01). Boxplot shows median and 75th and 25thth percentiles, and whiskers show minimum (min.) and maximum (max.) values. (F) Immunohistochemistry images in hCS-hSpS assembloids at 28 daf showing eYFP projections overlapping with ISL1+ cell clusters. (G) Schematic detailing retrograde viral tracing experiment in hCS-hSpS assembloids. (H) Immunocytochemistry of hCS-hSpS assembloid at 31 daf showing co-expression of GFP and mCherry on the hCS side. (I) Immunocytochemistry of hCS-hSpS assembloid at 31 daf showing expression of mCherry and MAP2. (J) Quantification of the percentage (%) of GFP+ and mCherry+ cells on the hCS side that co-express MAP2 or GFAP (n = 10 assembloids from 3 hiPS cell lines from 1–2 separate differentiations, with 2–3 cryosections quantified per assembloid). (K and L) Representative immunocytochemistry image for CTIP2 (K) or BRN2 (L) on the hCS side of hCS-hSpS assembloids at 31 daf. (M) Quantification of the percentage (%) of GFP+ and mCherry+ cells on the hCS side that co-express either CTIP2 or BRN2 (n = 10 assembloids derived from 3 hiPS cell lines from 1–2 separate differentiations, with 2–3 cryosections quantified per assembloid). (N) Quantification of the percentage (%) of CTIP2+ or BRN2+ among all Hoechst+ cells in hCS (n = 6 assembloids derived from 3 hiPS cell lines from 1–2 separate differentiations, with 2–3 cryosections quantified per assembloid). Data represent mean ± SEM unless otherwise specified. Scale bars, 50 µm (C, H, I, K, L, and inset in I), 100 µm (F), and 200 µm (B). See also Figure S5 and Table S1.
Figure 4.
Figure 4.. Functional Connectivity in hCS-hSpS Assembloids
(A) Schematic detailing optogenetic stimulation coupled with GCaMP imaging in hCS-hSpS assembloids. (B) Representative picture of intact hCSAAV-Chrim-hSpSGCaMP7s assembloid 46 days after fusion (daf). (C) Representative images of two GCaMP7s-infected cells in an hCS-hSpS assembloid before and after optogenetic stimulation (625 nm, 100 ms each). (D) Representative ΔF/F traces showing spontaneous and light-evoked calcium responses in three GCaMP7s-infected cells before and after adding NBQX (20 µM) and APV (50 µM). Optogenetic stimulation (625 nm, 100 ms each) is indicated with a purple rectangle. ΔF/F indicates the fluorescence intensity over baseline fluorescence. (E) Quantification of the stimulation-triggered ΔF/F amplitudes, shown in comparison to randomized-triggered amplitudes (n = 16 cells from 4 assembloids derived from 2 hiPS cell lines from 1–2 differentiations; two-tailed paired t test: ***p = 0.0005). (F) Stimulation-triggered average of the calcium response to optogenetic stimulation in paired cells with and without NBQX and APV (n = 16 cells from 4 assembloids derived from 2 hiPS cell lines). Black traces represent the mean and shaded bars represent the SEM. (G) Schematic detailing optogenetic stimulation coupled with patch clamping slice recording in hCS-hSpS assembloids. (H) Example images of an hCSAAV-Chrim-hSpSHb9::GFP assembloid. (I) Chrimson-triggered EPSCs in an Hb9::GFP+ neuron voltage clamped to –70 mV, (left) and lack of EPSCs following TTX application (right). Scale bars, 10 µm (inset in H), 20 µm (C), 50 µm (H), and 200 µm (B). See also Table S1.
Figure 5.
Figure 5.. hSpS Control of Muscle Activity
(A) Image of intact assembloid showing hSpS derived from TUBA1B-mEGFP projecting into mouse limb. This image was generated by manual stitching of individual images. (B) Quantification of the proportion of contracting limb, hCS-limb or hSpS-limb assembloids 7 and 14 days after fusion (daf; n = 3 hiPS cell lines from 1 differentiation; χ2 test, p = 0.02), in the absence or presence of curare (100 µM; n = 3 hiPS cell lines; χ2 test, p = 0.02). See Video S2, sequence 1, for live imaging of a contracting hSpS-limb assembloid with or without curare. (C) Schematic showing the co-culture of 2D human skeletal myoblasts (hSkM) and spheroids (hCS or hSpS). (D) Immunocytochemistry of 2D hSkM 7 days after co-culture with hCS or hSpS. (E) Quantification of spontaneous calcium activity in hSkM (Cal-590 AM) in either hSkM alone or after co-culture with hCS, hSpS or hSpS + curare (100 µM). Graph on the left shows % of active hSkM per field recorded (n = 2 hiPS cell lines from 1–2 differentiations; Kruskal-Wallis test: p < 0.0001, with Dunn’s multiple comparison test ****p < 0.0001). Graph on the right shows the percentage (%) of active hSkM per co-culture experiment (fields imaged in one experiment combined; n = 2 hiPS cell lines from 1–2 differentiations; Kruskal-Wallis test: p = 0.02, with Dunn’s multiple comparison test *p = 0.01). See Video S2, sequence 2 for calcium activity of hSkM and hSpS-hSkM. (F) Images showing the generation of 3D hSkM and the assembly with hCS and hSpS. (1) Dissociated hSkM are resuspended in Geltrex and placed in silicone wells. (2) Silicone wells are placed in ultra-low attachment plates in hSkM growth medium. (3) hSkM growth medium is switched to differentiation medium. (G and H) Schematics showing hSpS-hSkM assembloid set-up. (I) Representative images of 3D hSkM that have been assembled with hCS or hSpS derived from a TUBA1B-mEGFP hiPS cell line. (J) Schematic detailing retrograde viral tracing experiment in hSpS-hSkM assembloid. (K) Representative immunohistochemistry image for rabies-derived GFP, CHAT, and ISL1 on the hSpS side of hSpS-hSkM assembloids at 18 daf. (L) Quantification of the percentage (%) of GFP+ cells on the hSpS side of hSpS-hSkM assembloids that co-express either CHAT or GABA (n = 8 assembloids derived from 3 hiPS cell lines from 1 differentiation, with 3–6 cryosections quantified per assembloid). (M and N) Glutamate uncaging in hSpS-hSkM assembloid. UV light (405 nm, 136 ms) uncages glutamate on hSpS (M). Displacement normalized to baseline over time is shown for 3 subfields in the presence or absence of curare (100 µM; N). See Video S3 for an example of glutamate uncaging in an hSpS-hSkM assembloid. Table S1 shows details of all stimulation experiments. (O) Representative immunohistochemistry showing a neuromuscular junction (NMJ) with synaptophysin 1 (SYP) and bungarotoxin (BTX) on a desmin+ (DES) myofiber. Inset: 3D rendering of the NMJ. Data represent mean ± SEM. Scale bars, 2 µm (O), 20 µm (inset in K), 50 µm (K), 100 µm (A), and 200 µm (D, I, and M). See also Figure S6.
Figure 6.
Figure 6.. Cortical Activity Modulates Muscle Function in hCS-hSpS-hSkM Assembloids
(A) Schematic showing hCS-hSpS-hSkM assembloid set-up. (B) Representative image showing intact hCS-hSpS-hSkM assembloid. This image was generated by manual stitching of individual images. (C) Quantification of spontaneous contractions over a 2-min period showing the median number of events in subfields per field (n = 10 fields from 5 assembloids for hSkM, n = 12 fields from 6 assembloids from 1–2 differentiations for hCS-hSkM, n = 14 fields from 7 assembloids from 1–2 differentiations for hSpS-hSkM, n = 19 fields from 11 assembloids from 1–2 differentiations for hCS-hSpS-hSkM; Kruskal-Wallis test p < 0.0001, with Dunn’s multiple comparison test: *p = 0.03 for hSpS-hSkM versus hSkM, ***p = 0.0003 for hCS-hSpS-hSkM versus hSkM). Boxplot shows mean ± SEM and whiskers show 90th and 10th percentiles. See Video S4 for an example of spontaneous contractions in an hCS-hSpS-hSkM assembloid. (D) Representative spontaneous contraction traces in subfields of hCS-hSkM or hCS-hSpS-hSkM assembloids. (E) Correlation of displacements between subfields in a field quantified using covariance analysis. Data represent mean ± SEM (n = 10 fields from 5 assembloids for hSkM, n = 12 fields from 6 assembloids for hCS-hSkM, n = 14 fields from 7 assembloids for hSpS-hSkM, n = 19 fields from 11 assembloids for hCS-hSpS-hSkM; Kruskal-Wallis test p = 0.001, with Dunn’s multiple comparison test: *p = 0.01 for hSpS-hSkM versus hSkM, *p = 0.03 for hCS-hSpS-hSkM versus hSkM). (F and G) Glutamate uncaging in hCS-hSpS-hSkM assembloid. UV light (405 nm) uncages glutamate specifically on hCS (F). Displacement normalized to baseline over time is shown for 3 subfields and two trials (G). (H) Quantification of displacement normalized to baseline in different glutamate uncaging experiments. Values of the last frame before stimulation (Pre stim) and the highest of the first 3 frames or 204 ms after stimulation (Post stim) are plotted per field (subfields per field are averaged; n = 10 fields from 7 assembloids derived from 3 hiPS cell lines from 1–2 differentiations; Wilcoxon test **p = 0.002). (I and J) Glutamate uncaging of hCS in hCS-hSkM assembloid (I). Displacement normalized to baseline over time is shown for 4 subfields in the presence of caged glutamate (J). Similar results were obtained in n = 4 hCS-hSkM assembloids derived from 2 hiPS cell lines. (K) Representative image showing an intact hCS-hSpS-hSkM assembloid in which hCS was infected with AAV-hSYN1-ChrimsonR-tdT prior to assembly. This image was generated by manual stitching of individual images. (L and M) Optogenetic stimulation in hCS-hSpS-hSkM assembloids. Five consecutive pulses of light (625 nm, 68 ms in duration each and 6.8 s apart) were delivered (L). Traces of whole-field muscle displacement are shown after normalization to the pre-stimulation baseline in the absence or presence of NBQX (50 µM) and APV (50 µM) (M). See Video S5, sequence 1 for an example of optogenetic stimulation in a hCS-hSpS-hSkM assembloid. (N) Histogram illustrating the success rate of optogenetic stimulation (out of 5 consecutive pulses for each assembloid; n = 15 trials of 5 pulses in 7 assembloids from 1–2 differentiations). (O) Quantification of displacement (normalized to pre-stimulation baseline) per assembloid in the presence or absence of NBQX and APV (50 µM). Pre stim represents the highest value of displacement in the 20 frames (1.36 s) before stimulation. Post stim represents the average across 5 pulses of the highest value in the 20 frames immediately following stimulation (left: n = 7 assembloids derived from 3 hiPS cell lines from 1–2 differentiations; Wilcoxon matched paired t test *p = 0.01; right: n = 6 assembloids derived from 3 hiPS cell lines from 1–2 differentiations; two-tailed paired t test p = 0.94). Table S1 includes details of stimulation experiments. (P) Optogenetic stimulation coupled with calcium imaging in hCSAAV-Chrim-hSpS-hSkMACTA1::GCaMP6s. Five consecutive pulses of light (625 nm, 100 ms in duration each and 10 s apart) were delivered. (Q) Representative bright-field and ACTA1::GCaMP6s images of hSkM in hCS-hSpS-hSkM assembloid before and after stimulation. See Video S5, sequence 2 for an example of optogenetic stimulation coupled with calcium imaging in a hCS-hSpS-hSkM assembloid. (R) Quantification of the stimulation-triggered ΔF/F amplitudes, shown in comparison to randomized-triggered amplitudes in hSkM cells. The median ΔF/F amplitude of the five pulses delivered per cell is shown (n = 82 cells from 8 fields in 6 assembloids derived from 2 hiPS cell lines and 2 separate differentiations; Wilcoxon matched paired t test: ****p < 0.0001). (S) Optogenetic stimulation in hCS-hSpS-hSkMACTA1::GCaMP6s assembloid (no opsin; five consecutive 100-ms pulses). (T) Quantification of stimulation-triggered ΔF/F amplitudes, shown in comparison to randomized-triggered amplitudes in hSkM cells of hCS-hSpS-hSkM assembloids without Chrimson. The median ΔF/F amplitudes of the five pulses delivered per cell are shown (n = 91 cells from 6 fields in 4 assembloids derived from 2 hiPS cell lines and 1 differentiation; Wilcoxon matched paired t test: p = 0.27). Scale bars, 200 µm (B, F, I, K, L, and Q). See also Figures S7 and S8.
Figure 7.
Figure 7.. Long-Term Culture and Functionality of hCS-hSpS-hSkM Assembloids
(A) Schematic detailing location of electron microscopy images within hCS-hSpS-hSkM assembloids. (B and C) Representative images within hSpS in hCS-hSpS-hSkM assembloids showing dendrites and synapses with synaptic vesicles (arrowheads), post-synaptic densities (asterisks), and mitochondria (arrows). (D) Representative images within hSkM in hCS-hSpS-hSkM assembloids showing skeletal muscle fibers with actin and myosin filaments and mitochondria (arrows). (E and F) Representative images within hSkM in hCS-hSpS-hSkM assembloids showing points of contact between hSpS neurons and hSkM. Neuron terminals are vesicle-laden (arrow heads) and present mitochondria (arrows). hSkM are surrounded by a basal lamina (hollow arrowheads) and present small invaginations on the membrane (asterisks, F). (G) Schematic detailing location of images within hCSAAV-Chrim-hSpS-hSkM assembloids. (H–J) Representative immunohistochemistry images in cryosections of hCSAAV-Chrim-hSpS-hSkM assembloids showing oligodendrocytes (H), motor neurons (I) and neuromuscular junctions (J). Insets in (H) show oligodendrocytes in hSpS, and inset in (I) shows a single Z plane. Optogenetic stimulation in hCS-hSpS-hSkM assembloid (five consecutive 68 ms pulses) at 5 and 8 weeks post-assembly. Displacement in hSkM was quantified. (L) Success rate per assembloid following optogenetic stimulation at 5 and 8 weeks post-assembly. Two separate fields per assembloid were imaged at each time-point (n = 16 assembloids for both time-points from 2 hiPS cell lines and 1 differentiation; χ2 test, p = 0.06). (M) Success rate out of 5 consecutive light pulses per responding field following optogenetic stimulation at 5 and 8 weeks post-assembly (n = 21 and 12 fields for weeks 5 and 8, respectively, from 13 or 8 assembloids derived from 2 hiPS cell lines and 1 differentiation; χ2 test, p = 0.06). (N) Representative traces of whole-field muscle displacement shown after normalization to the pre-stimulation baseline in hCS-hSpS-hSkM assembloid (five consecutive 68-ms pulses) at 5 and 8 weeks post-assembly. (O) Optogenetic stimulation coupled with calcium imaging in hCSAAV-Chrim-hSpS-hSkMACTA1::GCaMP6s at 4–5 and 7–8 weeks post-assembly. Five consecutive pulses of light (625 nm, 100 ms in duration each and 10 s apart) were delivered. (P) Average ACTA1::GCaMP6s signal aligned to the time of the pulse in stimulations of numbers 1, 3, and 5 in hCS-hSpS-hSkM assembloids at 4–5 and 7–8 weeks after assembly. (Q) GCaMP6s ΔF/F amplitudes plotted for stimulation numbers 1–5 normalized to the first stimulation (n = 22 cells from 4 assembloids from 1 differentiation at 4– 5 weeks, and 13 cells from 3 assembloids from 1 differentiation at 7–8 weeks; two-way repeated-measures ANOVA with Tukey multiple comparisons: *p = 0.1, **p = 0.003). Scale bars, 200 nm (F), 1 µm (C and E), 2 µm (B), 5 µm (D, J, and inset in I), 20 µm (I and insets in H), and 200 µm (H)

Comment in

  • Assembling organs in vitro.
    Mukhopadhyay M. Mukhopadhyay M. Nat Methods. 2021 Feb;18(2):119. doi: 10.1038/s41592-021-01068-9. Nat Methods. 2021. PMID: 33542506 No abstract available.

References

    1. Alaynick WA, Jessell TM, and Pfaff SL (2011). SnapShot: spinal cord development. Cell 146, 178. - PMC - PubMed
    1. Amin ND, and Paşca SP (2018). Building Models of Brain Disorders with Three-Dimensional Organoids. Neuron 100, 389–405. - PubMed
    1. Amoroso MW, Croft GF, Williams DJ, O’Keeffe S, Carrasco MA, Davis AR, Roybon L, Oakley DH, Maniatis T, Henderson CE, and Wichterle H (2013). Accelerated high-yield generation of limb-innervating motor neurons from human stem cells. J. Neurosci 33, 574–586. - PMC - PubMed
    1. Birey F, Andersen J, Makinson CD, Islam S, Wei W, Huber N, Fan HC, Metzler KRC, Panagiotakos G, Thom N, et al. (2017). Assembly of functionally integrated human forebrain spheroids. Nature 545, 54–59. - PMC - PubMed
    1. Blesch A, and Tuszynski MH (2009). Spinal cord injury: plasticity, regeneration and the challenge of translational drug development. Trends Neurosci 32, 41–47. - PubMed

Publication types

MeSH terms